This website works best with a newer web browser such as Chrome, Firefox, Safari or Microsoft
Edge. Internet Explorer is not supported by this website.
JMA Himawari-9 Dust RGB images created using Geo2Grid (above) spanned the period from 2100 UTC on 20 March to 2350 UTC on 22 March 2023 — and showed a large area of dense blowing dust (brighter shades of magenta to pink) across parts of eastern Mongolia and northern/northeastern China (eventually crossing... Read More
Himawari-9 Dust RGB images, from 2100 UTC on 20 March to 2350 UTC on 22 March [click to play MP4 animation]
JMA Himawari-9 Dust RGB images created using Geo2Grid(above) spanned the period from 2100 UTC on 20 March to 2350 UTC on 22 March 2023 — and showed a large area of dense blowing dust (brighter shades of magenta to pink) across parts of eastern Mongolia and northern/northeastern China (eventually crossing the China/Russia border). This Gobi Desert dust was lofted by strong winds produced by the tight pressure gradient between high pressure that was moving from Russia into western Mongolia and low pressure that was drifting from eastern Mongolia to northeastern China (KMA surface analyses: GIF | MP4).
The Himawari-9 Split Window Difference product (below) showed that this blowing dust (brighter shades of yellow to cyan/blue to red) restricted the surface visibility to 1 mile or less at some sites during the period from 0000 UTC on 21 March to 0000 UTC on 23 March.
Himawari-9 Split Window Difference product, from 0000 UTC on 21 March to 0000 UTC on 23 March [click to play animated GIF | MP4]
Himawari-9 True Color RGB images, from 2210 UTC on 20 March to 0950 UTC on 21 March [click to play animated GIF | MP4]
Himawari-9 True Color RGB images (above) showed the initial formation of blowing dust plmes (shades of tan) from 2210 UTC on 20 March to 0950 UTC on 21 March — which later became entrained into the aforementioned low pressure system (as it was centered over far northeastern China) during the period from 2210 UTC on 21 March to 0950 UTC on 22 March (below). An animation which combines these 2 daytime periods (20-21 March, and 21-22 March) is available here.
Himawari-9 True Color RGB images, from 2210 UTC on 21 March to 0950 UTC on 22 March [click to play animated GIF | MP4]
Similar cases of dust entrainment into the circulation of a midlatitude cyclone in this region were documented in blog posts from May 2021 and May 2019.
This blog post reported on the addition of data from the AOML Direct Broadcast site in Miami to data from the SSEC/CIMSS Direct Broadcast ftp site. Now, data from the Direct Broadcast site in San Juan, Puerto Rico, have also been added, allowing imagery to extend all the way into central Brazil! These... Read More
NOAA-20 VIIRS Dynamic Day Night Band imagery, 0547 UTC on 22 March 2023 (Click to enlarge)
This blog post reported on the addition of data from the AOML Direct Broadcast site in Miami to data from the SSEC/CIMSS Direct Broadcast ftp site. Now, data from the Direct Broadcast site in San Juan, Puerto Rico, have also been added, allowing imagery to extend all the way into central Brazil! These images are available at the CIMSS Direct Broadcast ftp site for Suomi NPP (https://ftp.ssec.wisc.edu/pub/eosdb/npp/) and for NOAA-20 (https://ftp.ssec.wisc.edu/pub/eosdb/j01) . The image above, for example, shows NOAA-20 Day Night Band imagery that combines data from the direct broadcast sites at AOML and San Juan (temporary direct link to CIMSS Direct Broadcast ftp site is here). The derived Sea Surface Temperature field from that time (here), shows River Surface Temperatures in the Amazon River basin! The first day-time image on 22 March, below, shows Suomi NPP (click here to see the orbits) data from the San Juan Puerto Rico antenna only — far out in the central Atlantic Ocean. (Here’s ATMS data — channel 21 at 183.31 GHz — that includes a map to help you judge where the data are!)
Suomi NPP True-Color imagery, 1613 UTC on 22 March 2023 (click to enlarge)
Tutuila, the large island of American Samoa, experienced very heavy rain early in the morning of 21 March 2023, especially over the western parts of the Island. (However, the raingauge at the Pago Pago airport, in central Tutuila, received only 0.15″ of rain!) The animation above shows the development of... Read More
GOES-18 Band 13 (Clean Window infrared, 10.3 µm) imagery and Total Precipitable Water in clear skies, 0900 – 1600 UTC on 21 March 2023 (Click to enlarge)
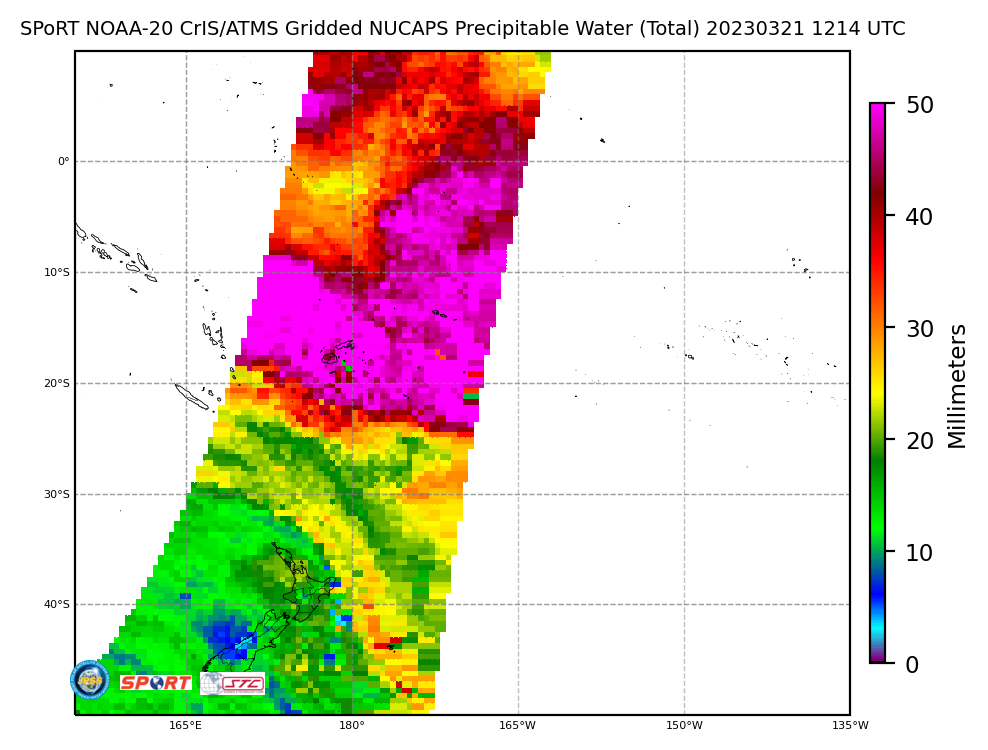
Tutuila, the large island of American Samoa, experienced very heavy rain early in the morning of 21 March 2023, especially over the western parts of the Island. (However, the raingauge at the Pago Pago airport, in central Tutuila, received only 0.15″ of rain!) The animation above shows the development of convection in a corridor of moisture as suggested by the Total Precipitable Water (TPW) fields. Values diagnosed by the GOES-R algorithm exceed 2.1″ (magenta) near the clouds vs. values around 1.8-1.9″ (yellow/orange enhancement) to the east and to the west. How confident are you that that ribbon of moisture is true, and perhaps not an artifact of the clouds? TPW fields from gridded NUCAPS, below, (from this site), also show a local maximum in TPW oriented southeast-to-northwest over the Samoan Islands. MIMIC Total Precipitable Water from 1500 UTC on the 21st, shown here, from this site, also show the local maximum.
Gridded NUCAPS field of Total Precipitable Water, 1214 UTC on 21 March 2023 (Click to enlarge)
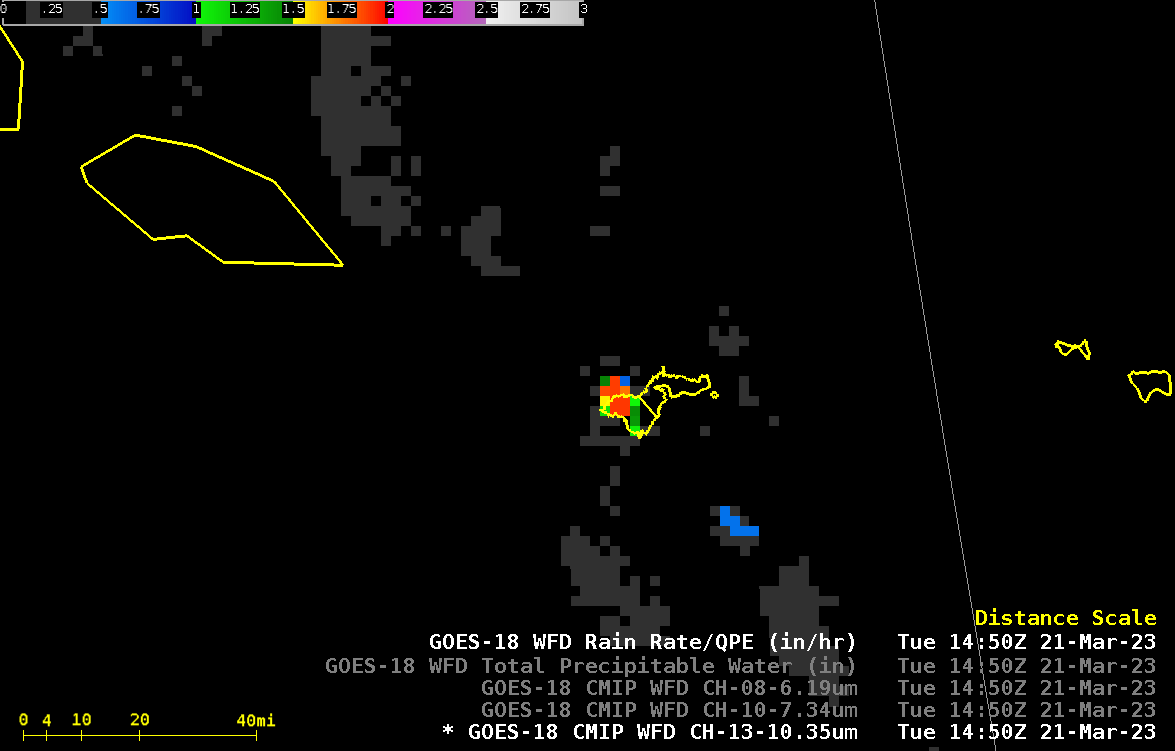
The animation below shows GOES-18 Band 13 infrared (10.3 µm) imagery, the Level 2 Rain Rate product, and that Rain Rate product overlain on top of the low-level water vapor infrared imagery (Band 10, 7.34 µm), all centered on the island of Tutuila. Very heavy rain is diagnosed over western Tutuila, with values exceeding 1.9″/hour, values that are red in the enhancement used. This is more easily viewed in the animation at bottom.
GOES-18 Band 13 (Clean windown infrared imagery, 10.3 µm), GOES-18 Derived Rain Rate, and GOES-18 Low-Level water vapor infrared imagery (Band 10, 7.34 µm) overlain with Rain Rate, 0900 – 1600 UTC on 21 March 2023 (Click to enlarge)
A zoomed-in look at GOES-18 Rain Rate, below, from 1430-1530 UTC, shows when the heaviest rain was falling over the island; orange/red values are close to 2″/hour. The GOES-R Rain Rate Level 2 product is not parallax-corrected, so it is displayed a bit farther from the sub-satellite point (at 137oW, or about 33o longitude from Tutuila) than it is in reality.
GOES-18 Rain Rate, 1430-1530 UTC on 21 March 2023 (Click to enlarge)
This was a case where the GOES-R product diagnosed much heavier rain than JAXA’s GsMAP (shown below in an animation) or CMORPH fields (available at RealEarth).
Diagnosed 1-h rainfall, 12 – 17 UTC on 21 March 2023 (click to enlarge)
Rotation off the coast of California near San Francisco was present on Tuesday 2023-03-21 as the area got hit with rains and high windspeeds. The rotation is apparent in both visible RGB satellite imagery and radar reflectivity, animated below using RealEarth. Circular formations in cloud structure, seen by GOES-16, and... Read More
Rotation off the coast of California near San Francisco was present on Tuesday 2023-03-21 as the area got hit with rains and high windspeeds. The rotation is apparent in both visible RGB satellite imagery and radar reflectivity, animated below using RealEarth. Circular formations in cloud structure, seen by GOES-16, and rain bands picked up in the radar, are visible.
GOES-16 true color imagery and NEXRAD Radar Reflectivity every hour off the coast of the Bay Area, California from 2023-03-21 1600Z to 2023-03-22 1600Z . Rotational structure in the clouds and precipitation can be seen. This animation can be recreated in RealEarth.
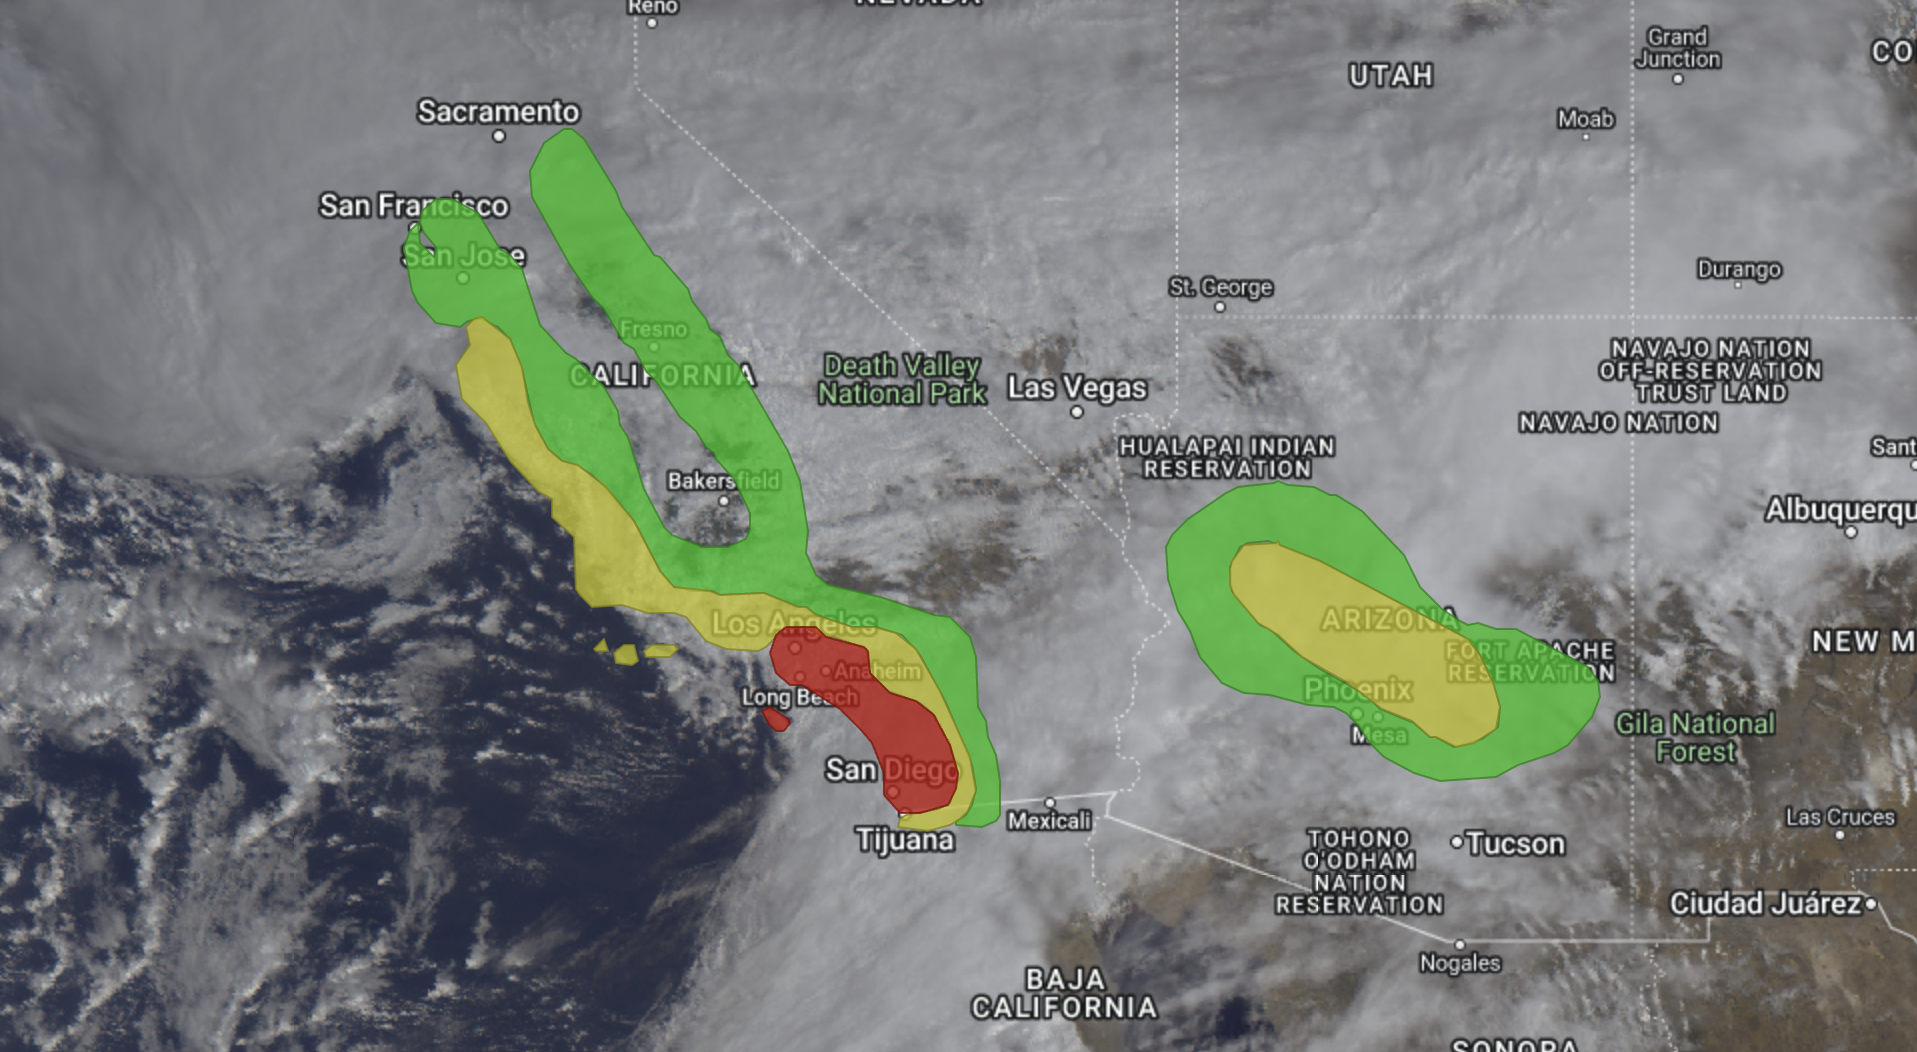
California isn’t the only state in the region to experience an excess in rain. Much of central and Northern Arizona are also under flood warnings. Below, the ‘Excessive Rainfall Outlook’ product is displayed in RealEarth. The Excessive Rainfall Outlook is a forecast of the likelihood that rainfall will exceed flash flood guidance (FFG) at a point. This product is issued by the Weather Prediction Center(WPC).
The Excessive Rainfall Outlook forecasts the likelihood of flooding. Much of Central and Southern California, as well as Central and Northern Arizona, were at risk of flooding on 2023-03-21. You can explore the Excessive Rainfall Outlook product using RealEarth.


