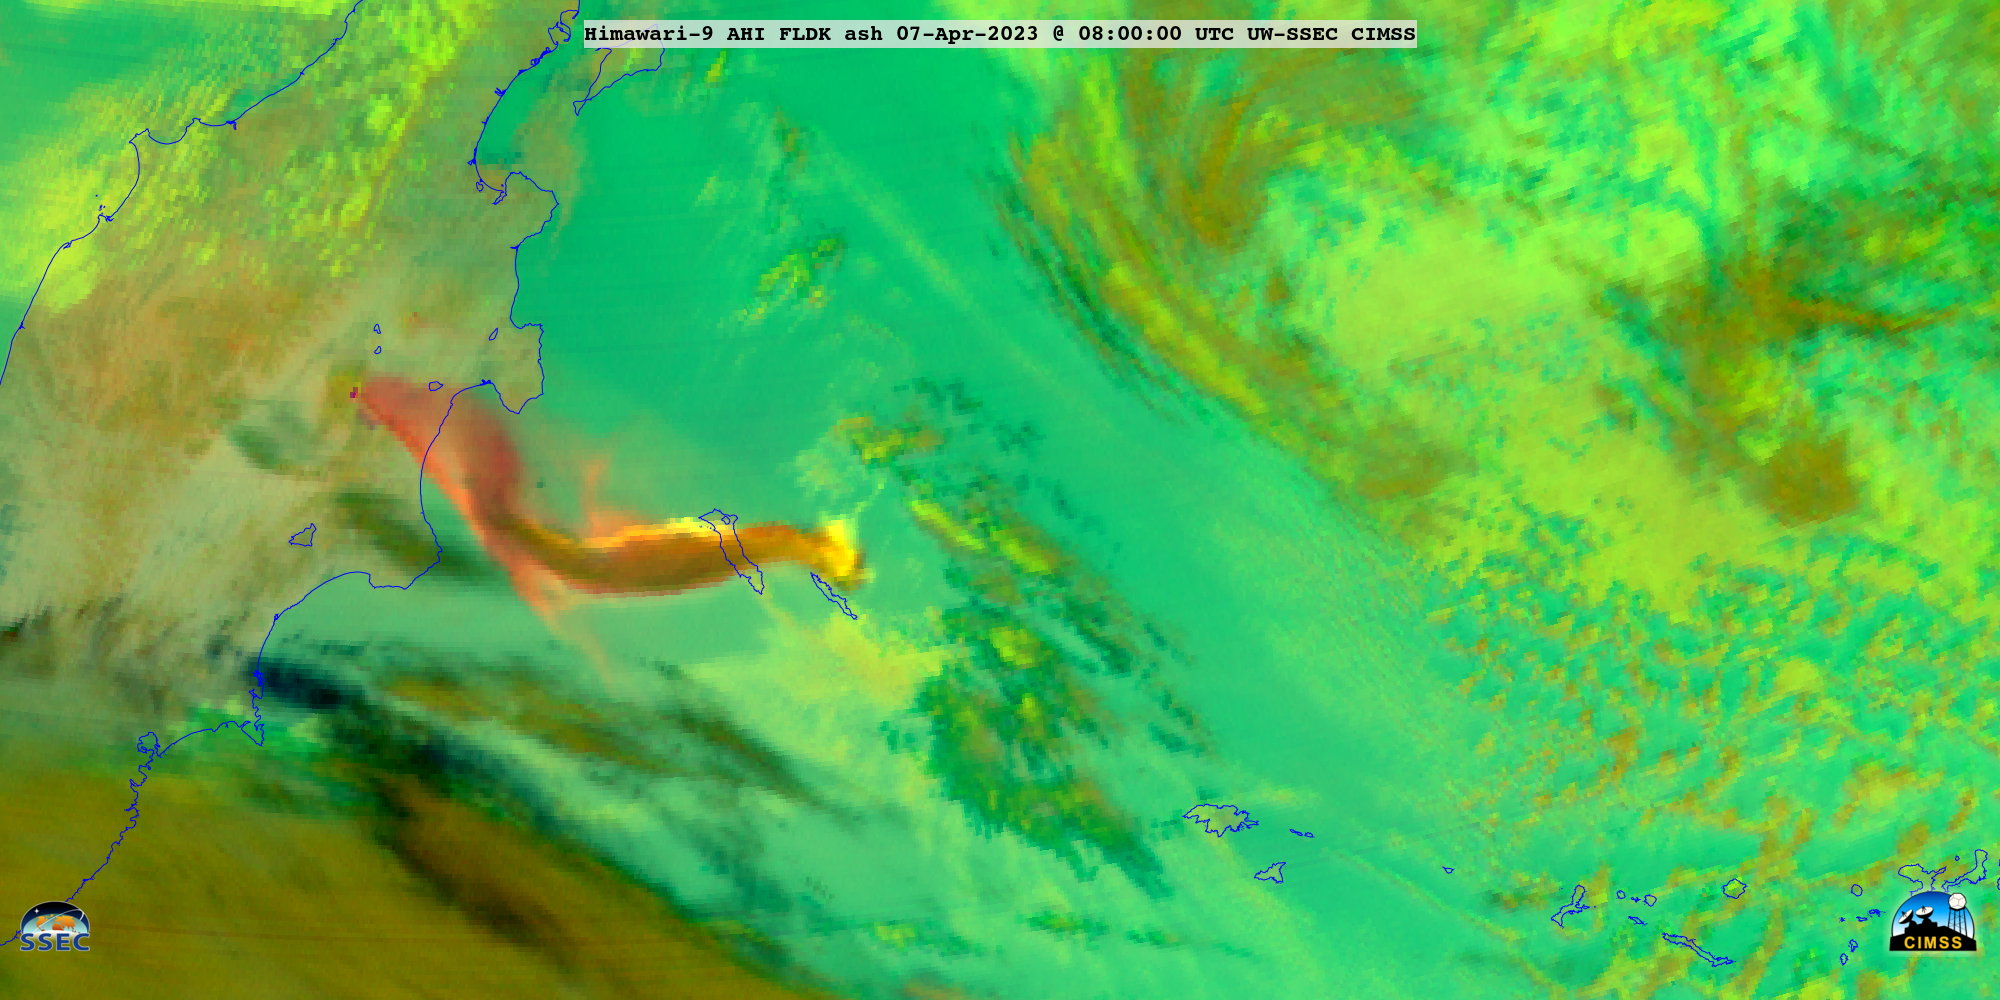
JMA Himawari-9 Ash RGB images created using Geo2Grid (above) showed the volcanic plume — which included a violent eruptive pulse that began at 0540 UTC on 07 April — from Bezymianny on the Kamchatka Peninsula of Russia during 06-07 April 2023. Signatures of ash (shades of pink to violet) were evident,... Read More

JMA Himawari-9 Ash RGB images [click to play animated GIF | MP4]
Himawari-9
Ash RGB images created using
Geo2Grid (above) showed the volcanic plume — which included a violent eruptive pulse that began at 0540 UTC on 07 April — from Bezymianny on the Kamchatka Peninsula of Russia during 06-07 April 2023. Signatures of ash (shades of pink to violet) were evident, along with the signature of SO2 mixed with ash (brighter shades of yellow) associated with the violent eruptive pulse.
A closer view of the volcanic cloud produced by the violent eruptive pulse is shown below, using Himawari-9 True Color RGB and Ash RGB images.
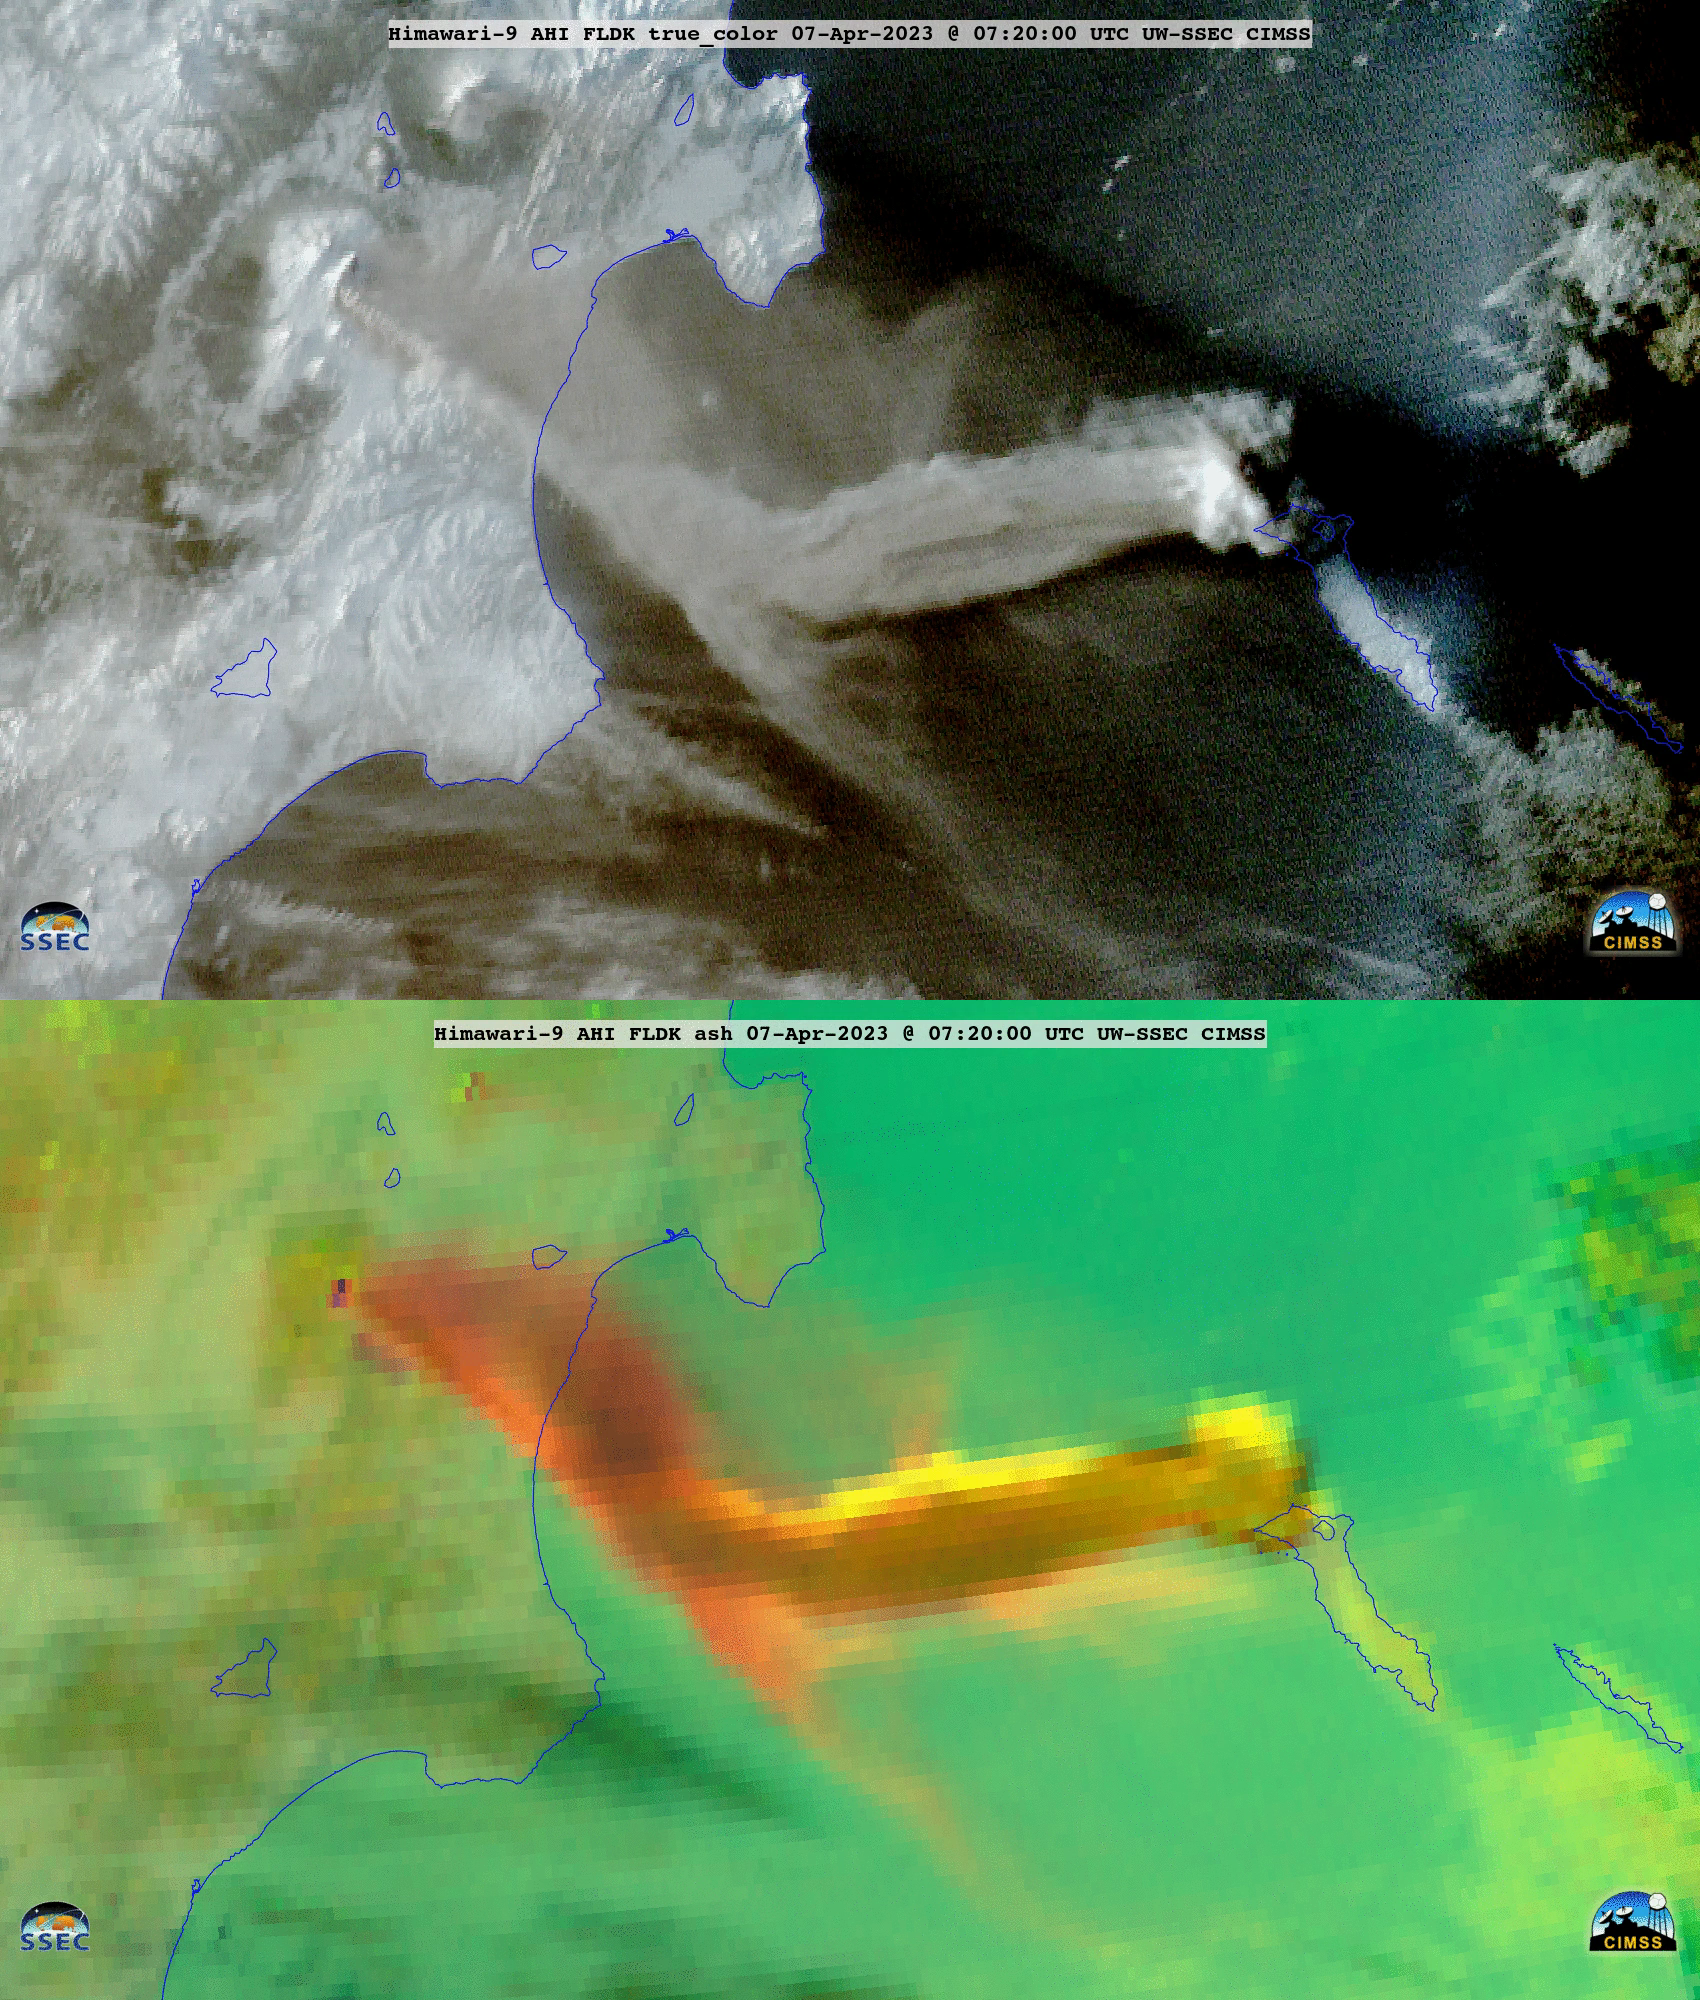
JMA Himawari-9 True Color RGB images (top) and Ash RGB images (bottom) [click to play animated GIF | MP4]
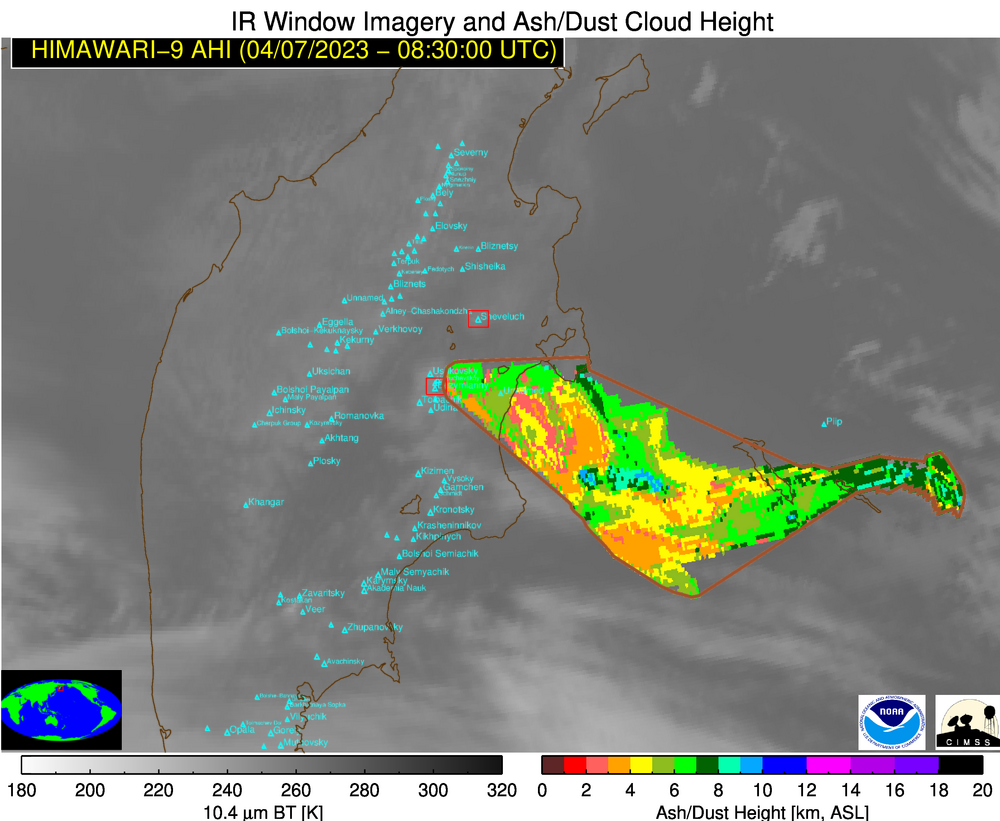
Himawari-9 Ash Height product [click to play animated GIF | MP4]
A Himawari-9 Ash Height retrieved product from the
NOAA/CIMSS Volcanic Cloud Monitoring site
(above) indicated that the violent eruptive pulse reached heights 10-12 km — and Ash Loading was high within that portion of the volcanic cloud
(below).
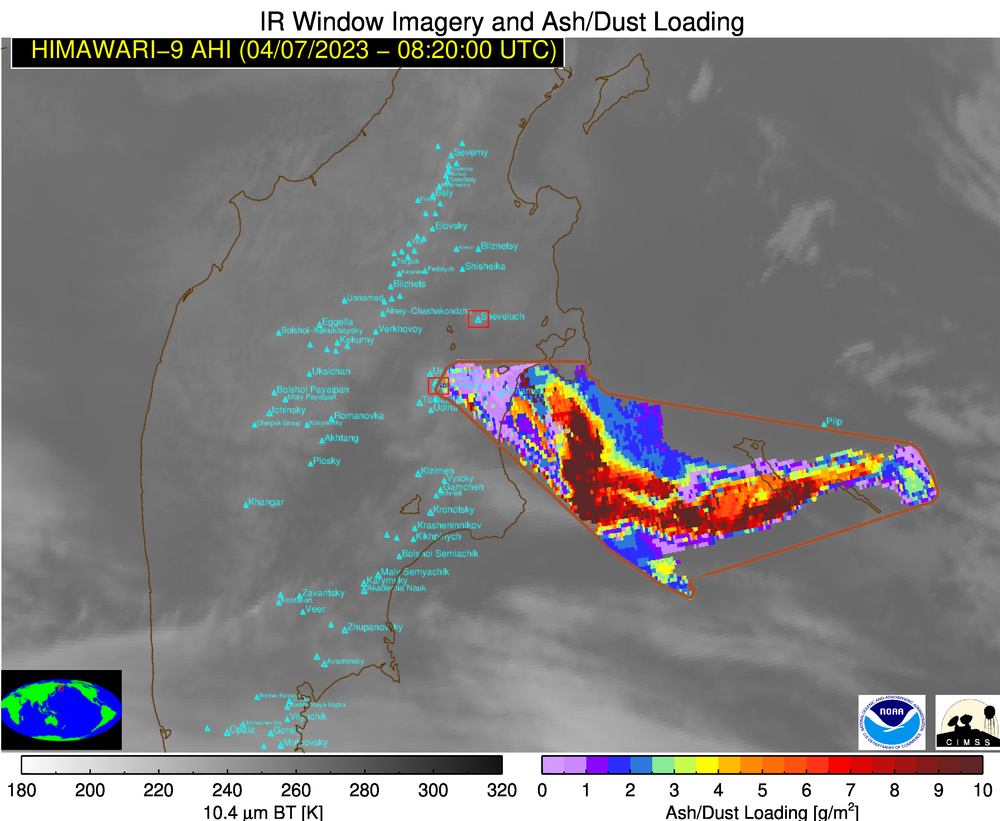
Himawari-9 Ash Loading product [click to play animated GIF | MP4]
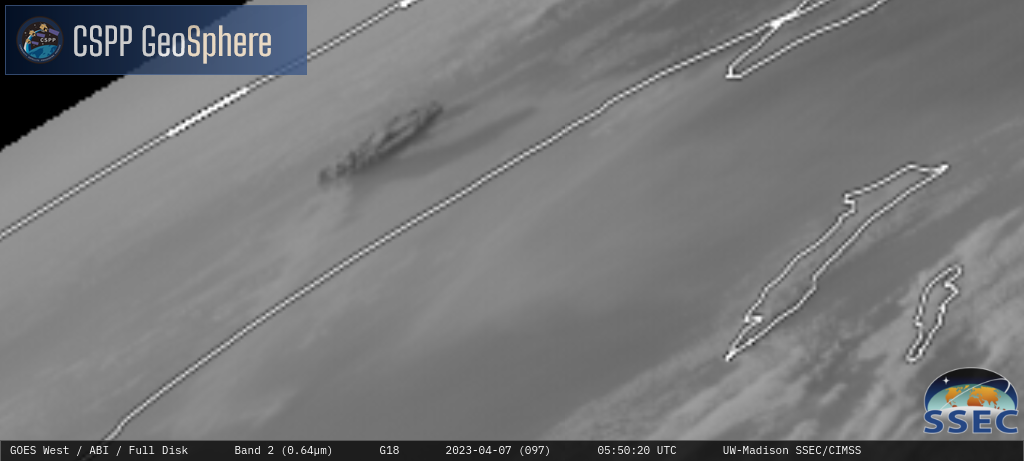
GOES-18
(GOES-West) “Red” Visible (
0.64 µm) images from the
CSPP GeoSphere site
(below) provided an oblique view of the cloud produced by the violent eruptive pulse.
GOES-18 “Red” Visible (0.64 µm) images [click to play animated GIF | MP4]
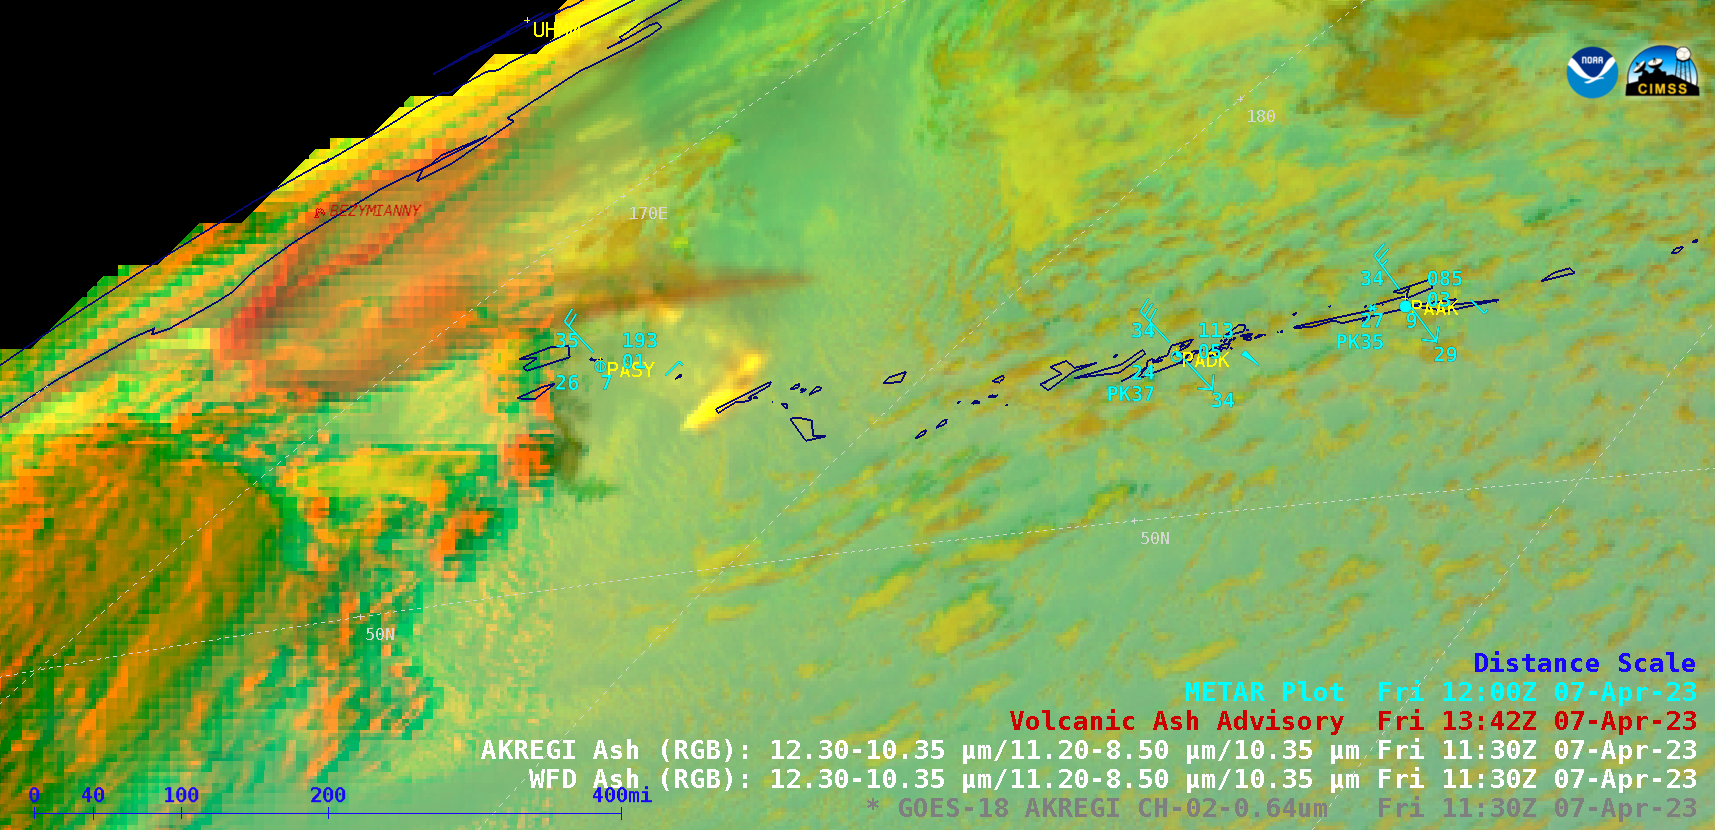
GOES-18 Ash RGB mages [click to play animated GIF | MP4]
GOES-18 Ash RGB images
(above) also showed signatures of both ash (shades of pink to violet) and mixed SO2/ash (brighter shades of yellow) as the volcanic plume moved over the far western Aleutian Islands. An aviation Volcanic Ash Advisory was issued, stating that ash was possible between the surface and 40,000 feet (12 km), moving to the east-southeast at 100 knots
(below).
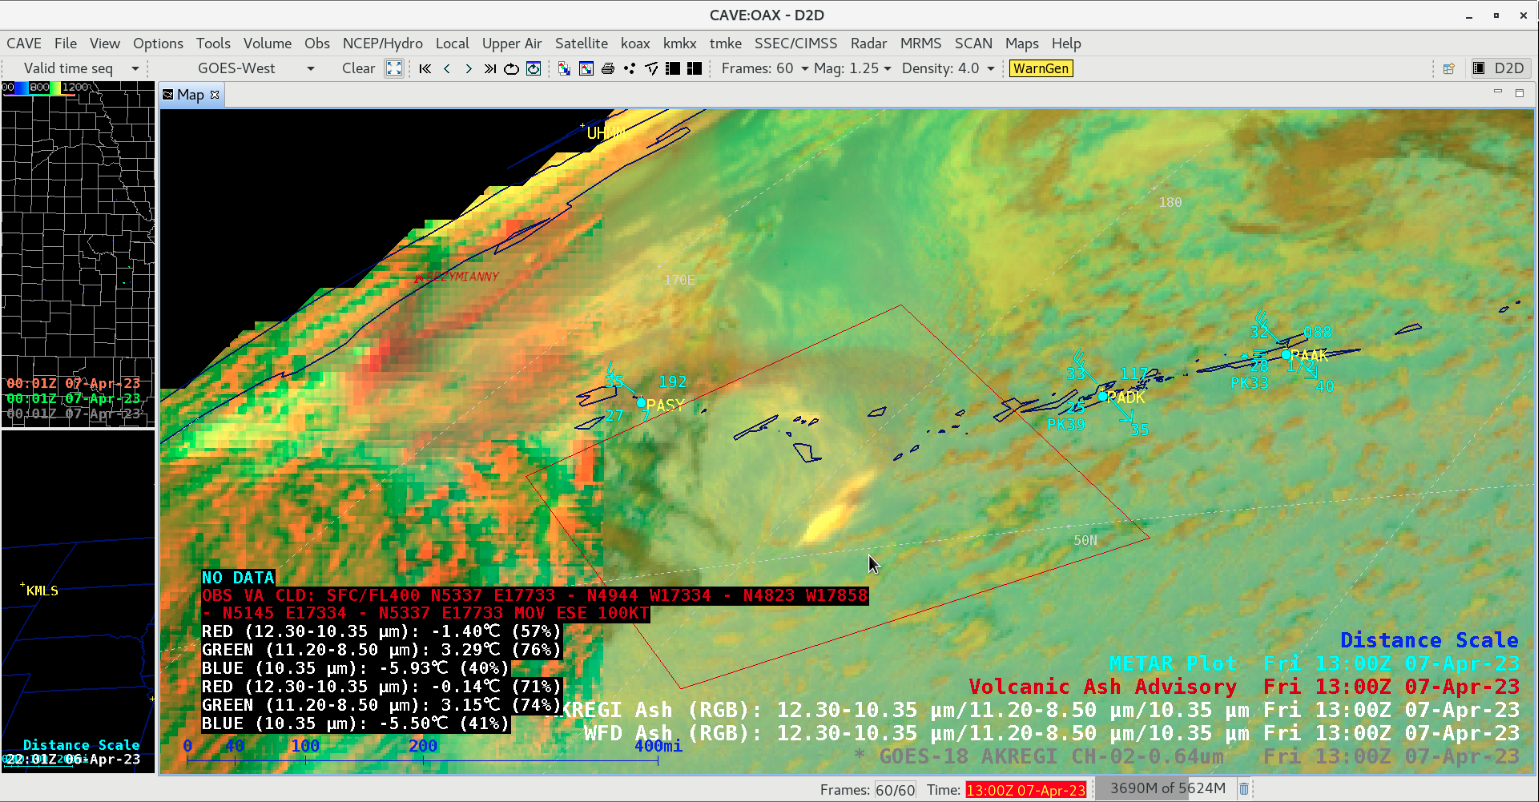
GOES-18 Air Mass RGB image at 1300 UTC, with Volcanic Ash Advisory polygon and cursor readout in red [click to enlarge]
In a larger-scale view of GOES-18 Ash RGB images
(below) the brighter yellow SO2/ash feature could be followed for several more hours as it moved across the western and central Gulf of Alaska.
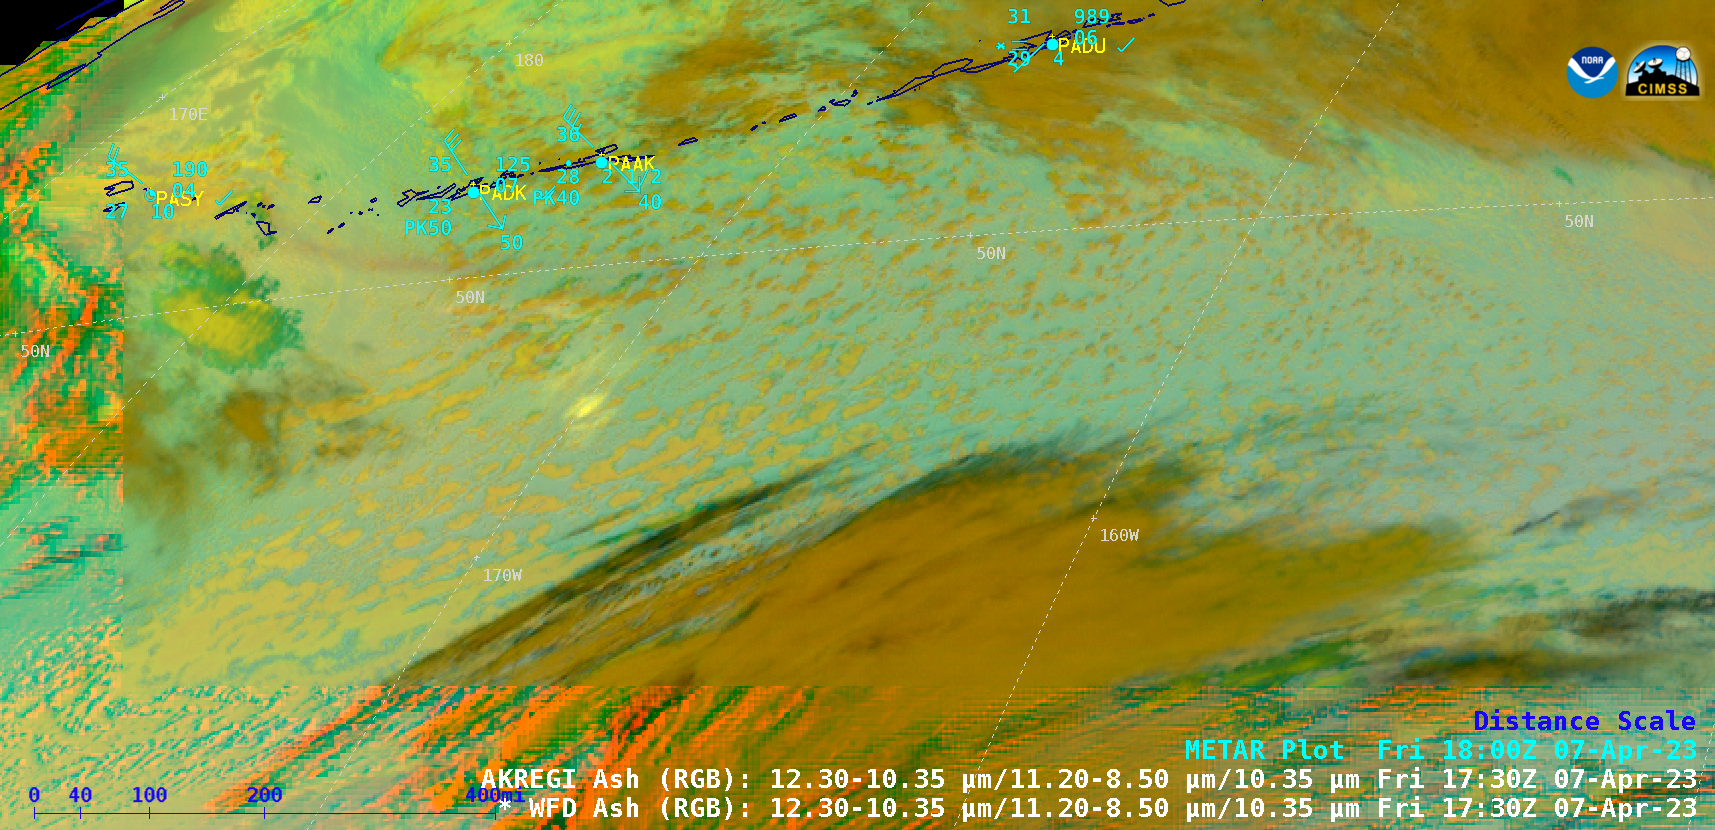
GOES-18 Ash RGB mages [click to play animated GIF | MP4]
View only this post
Read Less


