“Barcode Artifact” in GOES-18 Band 07 (Shortwave Infrared) imagery

GOES-18 Shortwave Infrared (3.9 µm) images [click to play animated GIF | MP4]
GOES-18 images shown in this blog post are preliminary and non-operational
During its Post-Launch Testing (PLT) period, once GOES-18 drifted to a position close to its final “Operational GOES-West” longitude of 137º W, a “Barcode Artifact” of vertical striping was occasionally seen in colder scenes of Band 07 Shortwave Infrared (3.9 µm) imagery — primarily centered around “spacecraft midnight” times, from 06-12 UTC . One example, using 1-minute Mesoscale Domain Sector images over the Alaska region on 20 July 2022, is shown above. Note that the vertical striping is more obvious over the colder (brighter white) clouds.
GOES-18 Shortwave Infrared (3.9 µm) images [click to play animated GIF | MP4]
GOES-18 Shortwave Infrared (3.9 µm) images [click to play animated GIF |
The vertical striping of the Barcode Artifact will also appear in many multispectral products that use 3.9 µm imagery — for example, GOES-18 Nighttime Microphysics RGB images (created using Geo2Grid) over that same region are shown below.
GOES-18 Nighttime Microphysics RGB images [click to play animated GIF | MP4]
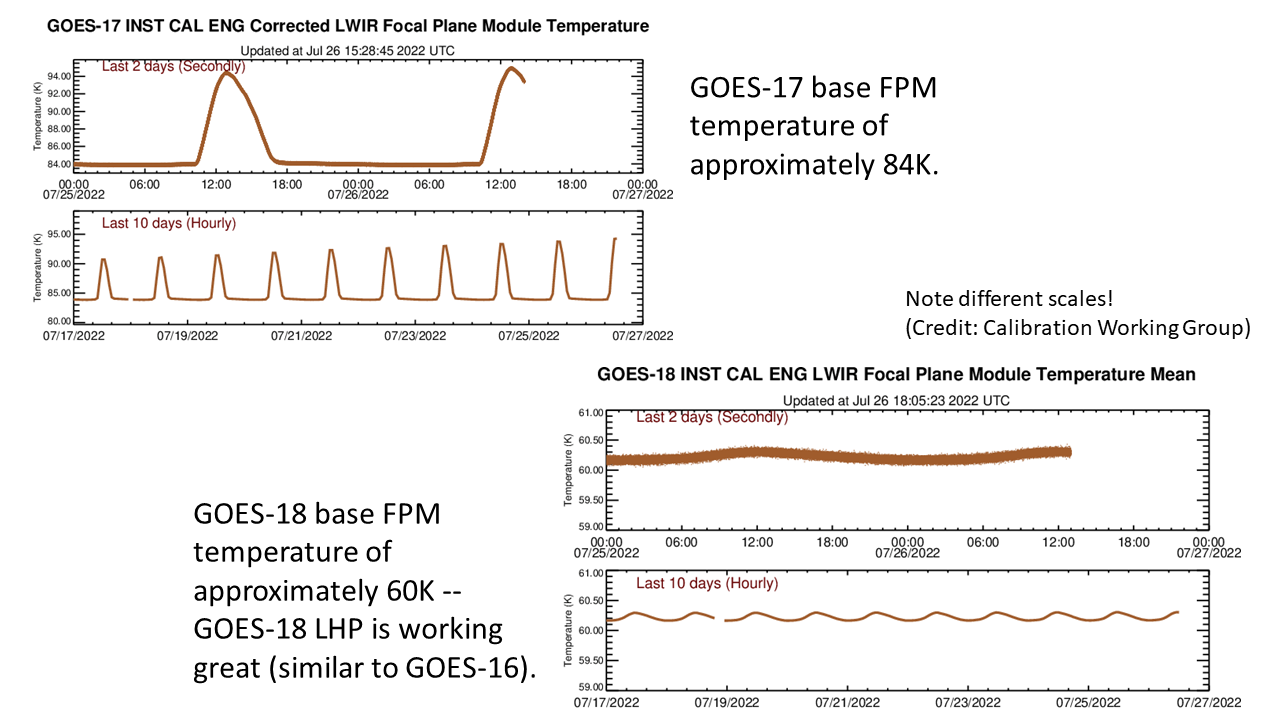
2-day and 10-day plots of Focal Plane Module temperatures for GOES-17 (top) and GOES-18 (bottom), ending on 26 July 2022 [click to enlarge]

Plot of Band07-Band13 Difference values for GOES-17 and GOES-18 on 27 July 2022 (credit: Mat Gunshor, CIMSS) [click to enlarge]
GOES-17 Night Fog BTD (11.2 µm – 3.9 µm) images [click to play animated GIF | MP4]