
The 3-panel animation above shows the 3 “Water Vapor” channels on GOES-R Satellites — Bands 8, 9 and 10 that sense emitted radiation centered at 6.19 µm, 6.95 µm and 7.34 µm, respectively. The date of these images is 24 May 2022, when SPC suggested a modest risk of severe weather over parts of west Texas, shown below (link).
Weighting functions for a USA Standard Atmosphere, below, for the three water vapor channels (from this website; you can find real-time weighting functions here), show that Band 10, at 7.34 µm receives energy from closer to the surface than Band 9 (6.95 µm), or Band 8 (6.19 µm).
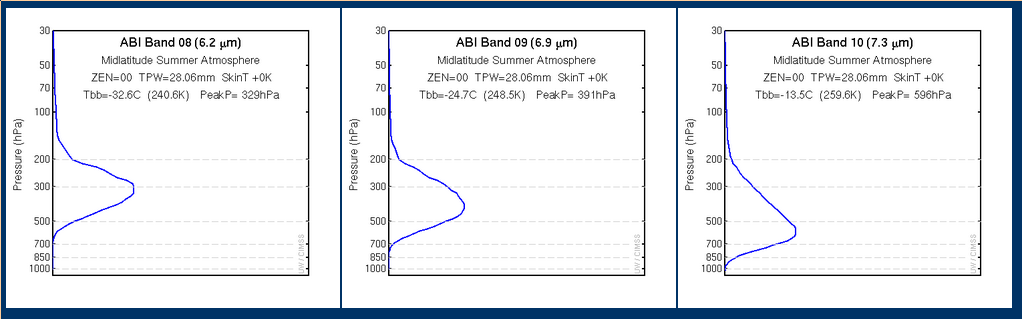
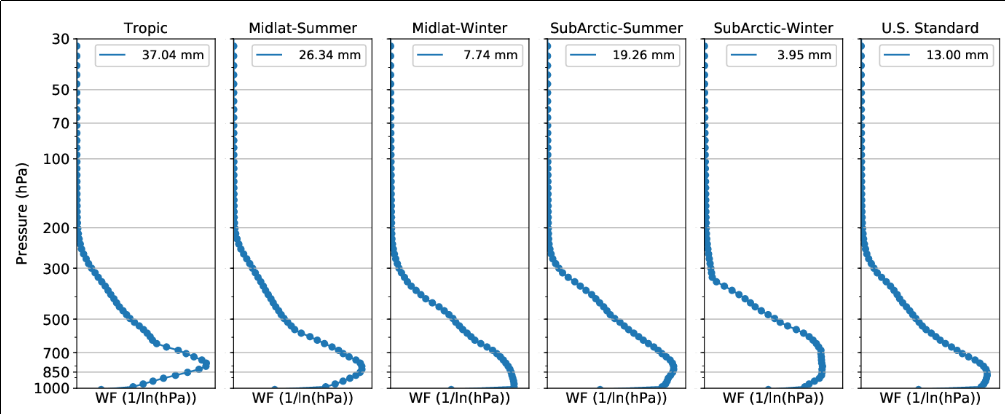
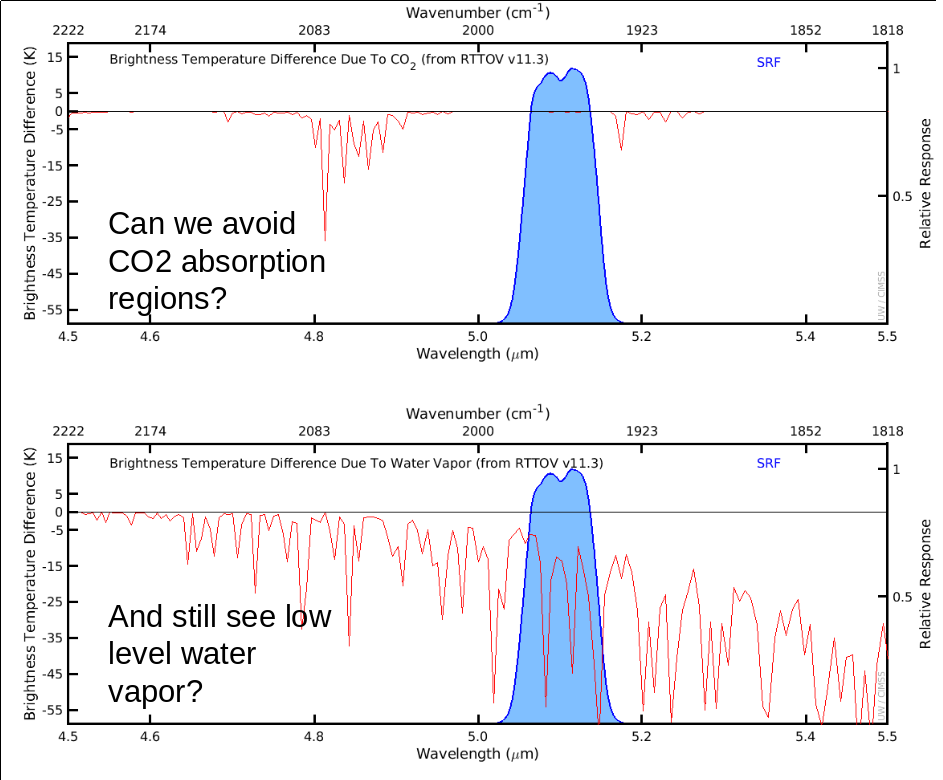
GeoXO, the follow-on mission to GOES-R, will include a few more channels on the planned Imager (GXI), including one to sense radiation at 5.1 µm; water vapor absorbs energy at this wavelength, although its weighting function peaks much closer to the surface. This previous blog post shows weighting functions for 5.1 µm, and also the spectral response function.
Data Fusion is a technique (see this paper by Elisabeth Weisz and Paul Menzel for information on this particular case and for references on the technique) that marries the dense spectral information available on IASI or CrIS to the dense spatio-temporal resolution information (for infrared channels) available on ABI in a way that allows the Sounder information from the Low Earth Orbit (LEO) satellite to be tracked with time. Briefly, relationships between the LEO Sounder Observations and ABI infrared observations (Bands 8-16, at a degraded resolution (“LORES”) similar to the LEO footprints) are established via a K-D Search Tree. Then, high-resolution ABI observations at subsequent times are matched to the 5 closest LORES profiles, and the 5 LEO profiles at those LORES points are averaged to produce the fusion data. This procedure is transferring CrIS (or IASI) retrieval products to ABI spatial resolution by using ABI observations coincident with the CrIS (or IASI) overpass; the image (now at high spatial resolution) is then transferred to preceding or succeeding ABI measurement times to create a time sequence of hyperspectral sounder data products. The animation below, courtesy Elisabeth Weisz, shows ABI plus IASI Data Fusion 5.15 µm imagery from 1600-1900 UTC on 24 May 2022, coincident with the animations shown above. IASI data from the 1700 UTC Metop-B overpass is first convolved to 5.15 µm and then transferred to high spatial as well as high temporal resolution dictated by the ABI radiance information (collected every 10 minutes). The proposed GeoXO 5.15 µm band will provide valuable low level moisture information that is not offered by the current ABI bands. An animation of that field is shown below.
A comparison of the 5.15 µm animation above with the 10.35 µm Data Fusion imagery is shown below. In particular, consider the west-southwest to east-northeast boundary that moves through El Paso TX during the animation in the 5.15 µm imagery, but not the 10.35 µm imagery (nor in the 6.19 µm – 7.35 µm imagery shown at the top of this blog post). Such a low-level moisture gradient detected in the lowest-level water vapor imagery could serve as a focusing mechanism for subsequent convection.
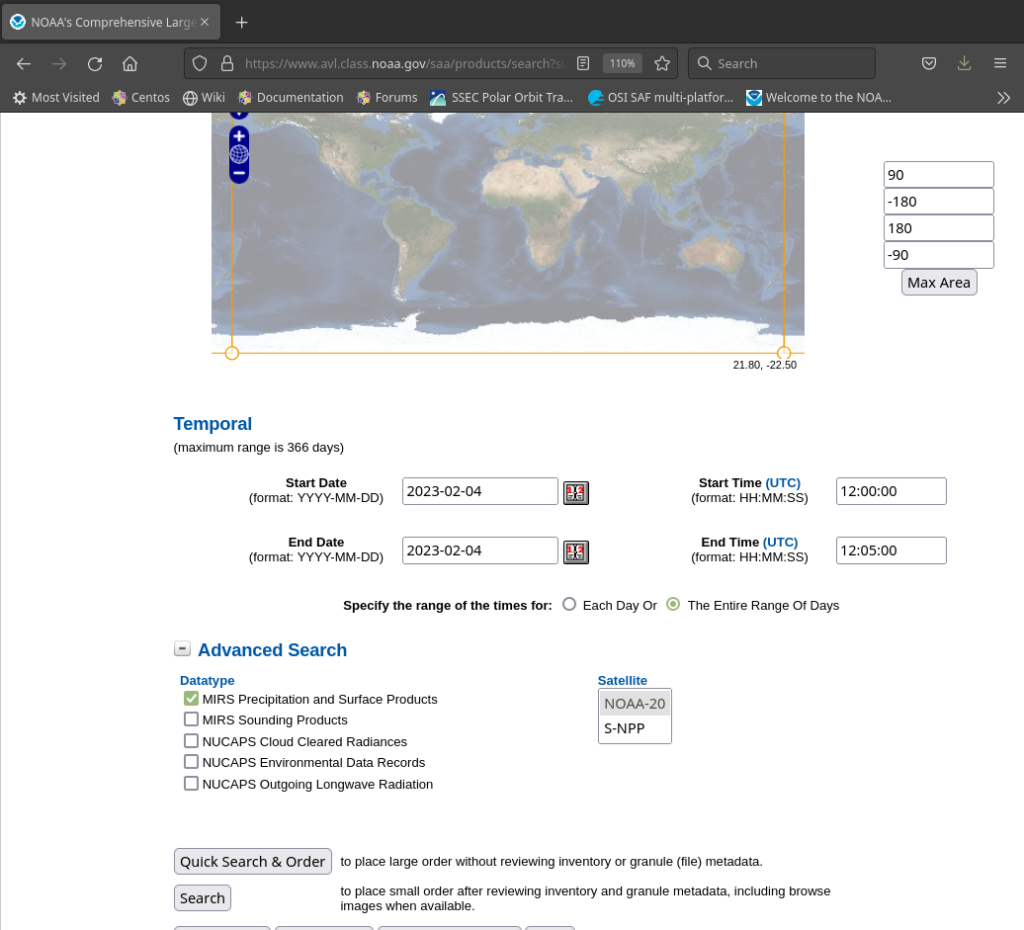
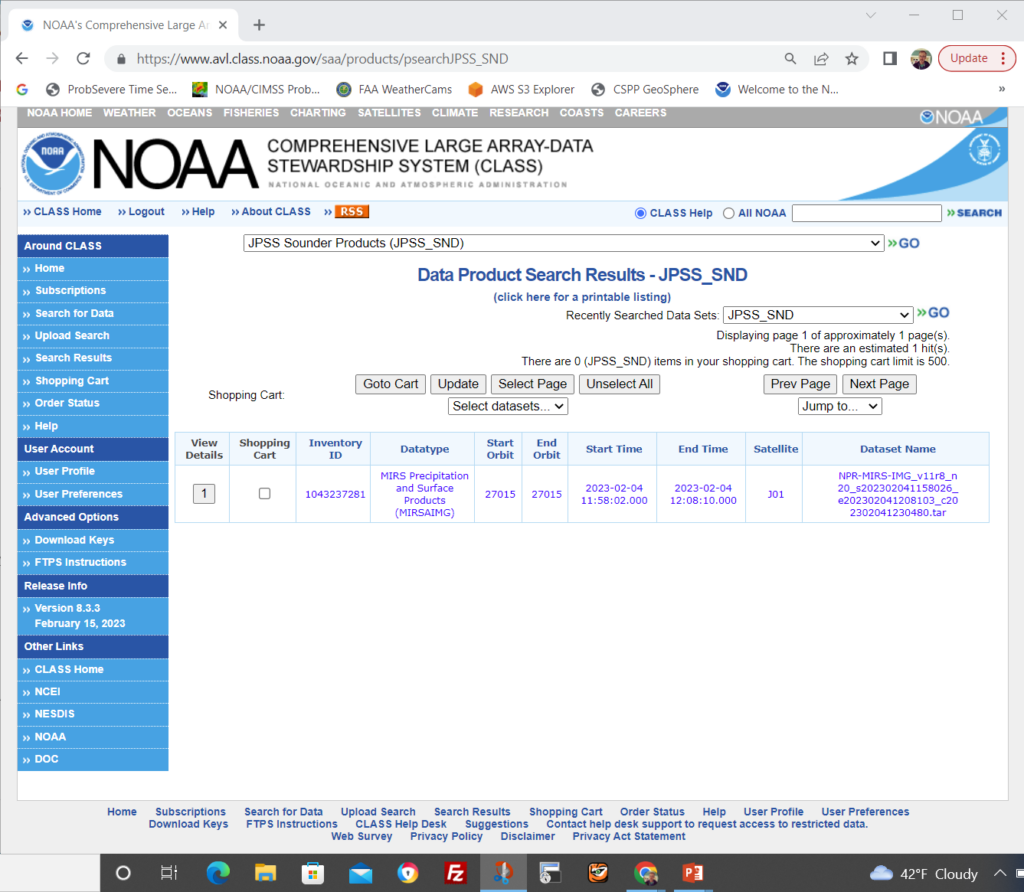
As it happened, 1600-1900 UTC on 24 May 2022 is an (unwelcome!!) data gap for GOES-16/GOES-17 data at the NOAA CLASS Data Repository because of a PDA issue. However, the SSEC Data Center did save the L1b files from other sources. Many thanks to that facility for its data. This event was also the subject of a blog post, with animations starting after 1900 UTC, here. GOES-16 Meso-sector 2 was positioned to view the event.
This blog post benefited enormously from Elisabeth Weisz’s input. Thank you!
View only this post Read Less


