
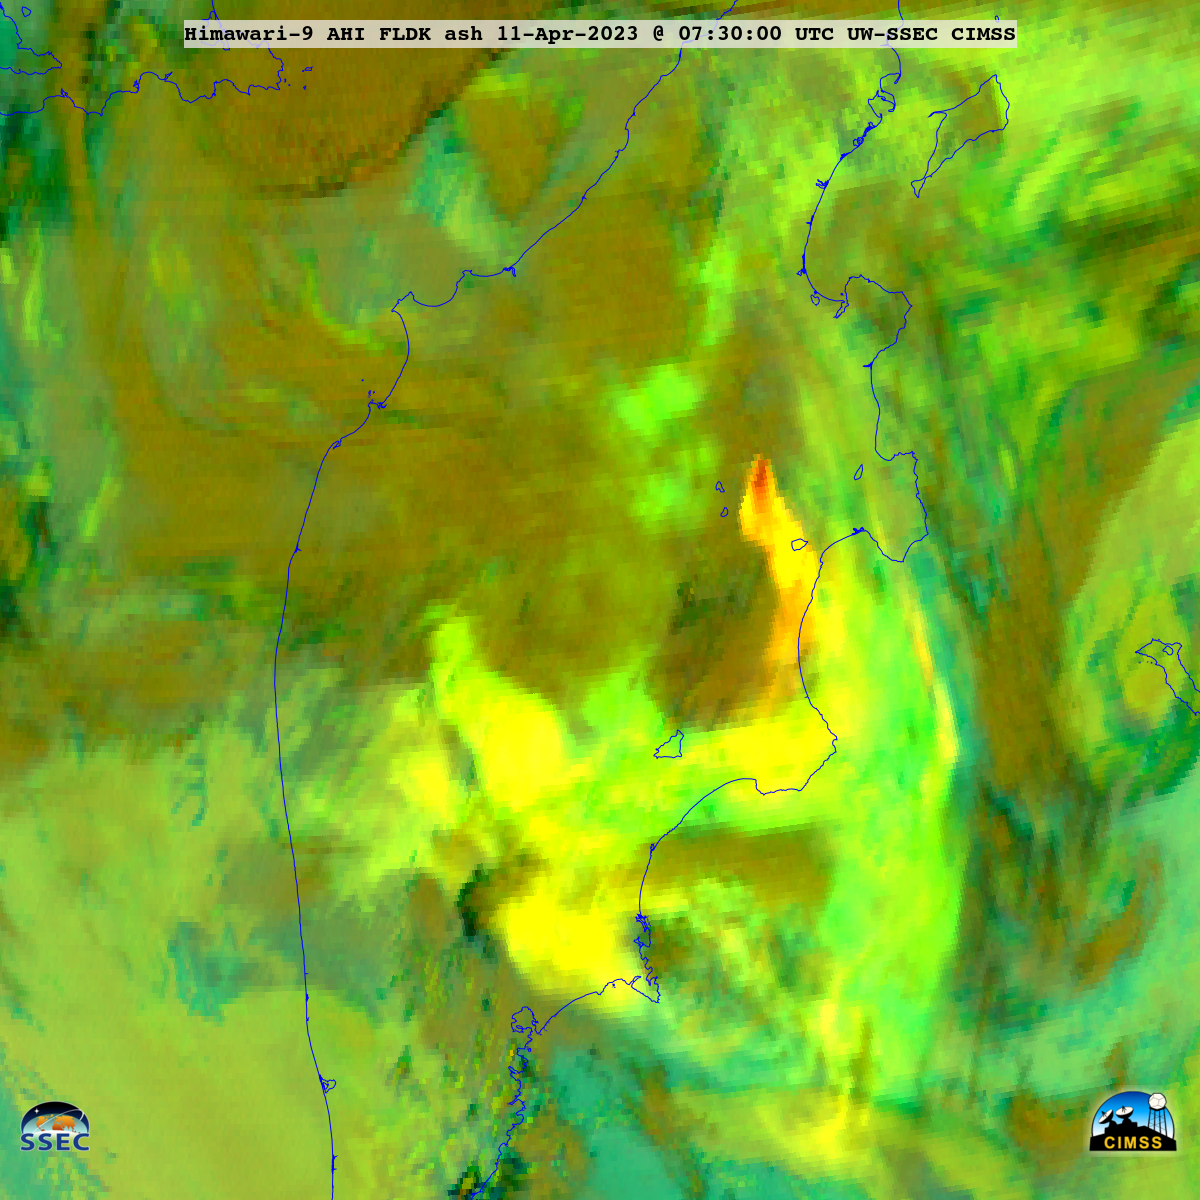
JMA Himawari-9 Ash RGB images created using Geo2Grid (above) showed a complex volcanic cloud resulting from an eruption of Shiveluch that began just after 1300 UTC on 10 April 2023. Much of the volcanic cloud exhibited brighter shades of yellow (indicating a mixture of ash and SO2), but there were also areas of brighter green (indicating... Read More
JMA Himawari-9 Ash RGB images [click to play animated GIF | MP4]
JMA Himawari-9 Ash RGB images created using Geo2Grid (above) showed a complex volcanic cloud resulting from an eruption of Shiveluch that began just after 1300 UTC on 10 April 2023. Much of the volcanic cloud exhibited brighter shades of yellow (indicating a mixture of ash and SO2), but there were also areas of brighter green (indicating larger concentrations of SO2) along with more localized pink-to-magenta features (a signature of larger ash concentrations).
Similar to what was seen during an eruption of Bezymianny on 07 April, GOES-18 (GOES-West) “Red” Visible (0.64 µm) images from the CSPP GeoSphere site (below) provided an oblique view of overshooting volcanic clouds produced during one of the eruptive pulses.
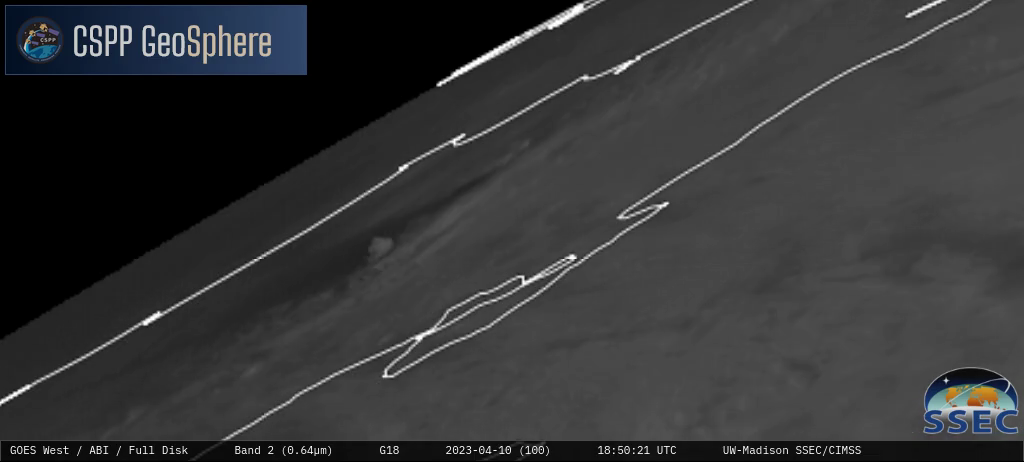
GOES-18 “Red” Visible (0.64 µm) images [click to play animated GIF | MP4]
===== 14 April Update =====
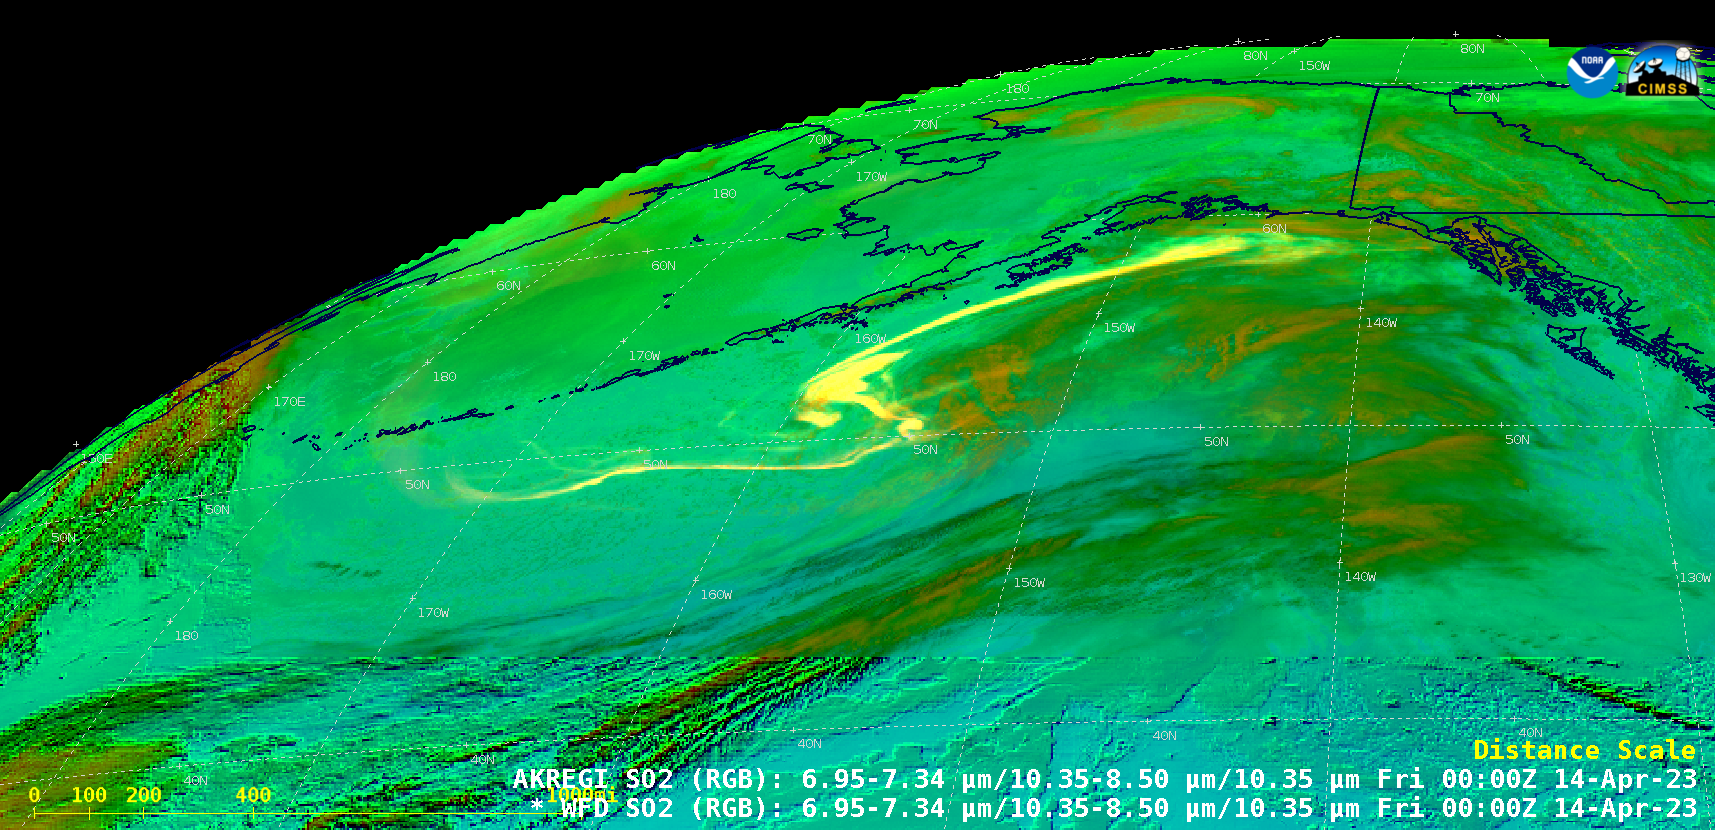
GOES-18 SO2 RGB images, 11-14 April [click to play animated GIF | MP4]
GOES-18 SO2 RGB images during the 4-day period from 11-14 April (above) showed the eastward transport of high-altitude filaments of mixed SO2 and Ash (brighter shades of yellow) across the Bering Sea and Gulf of Alaska, eventually moving over parts of Alaska, British Columbia and Yukon. Given the large amount of SO2 produced by this Shiveluch eruption, the SO2 RGB was a very effective product for monitoring the long range transport of its volcanic cloud.
A number of Aviation Ash Advisories were issued within the Alaska region, including those on 14 April that are displayed below.
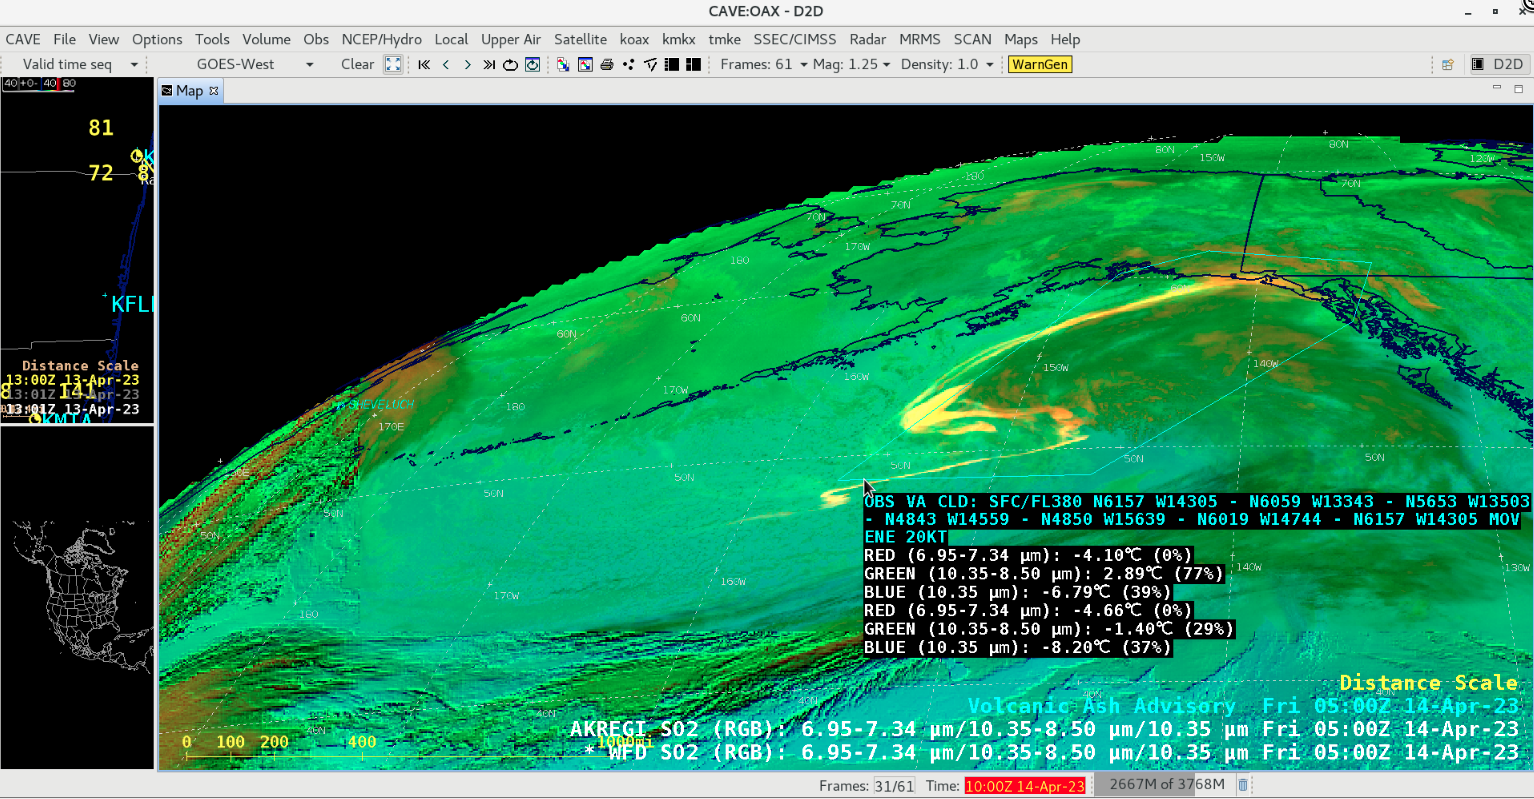
Ash Advisory issued at 0500 UTC on 14 April [click to enlarge]
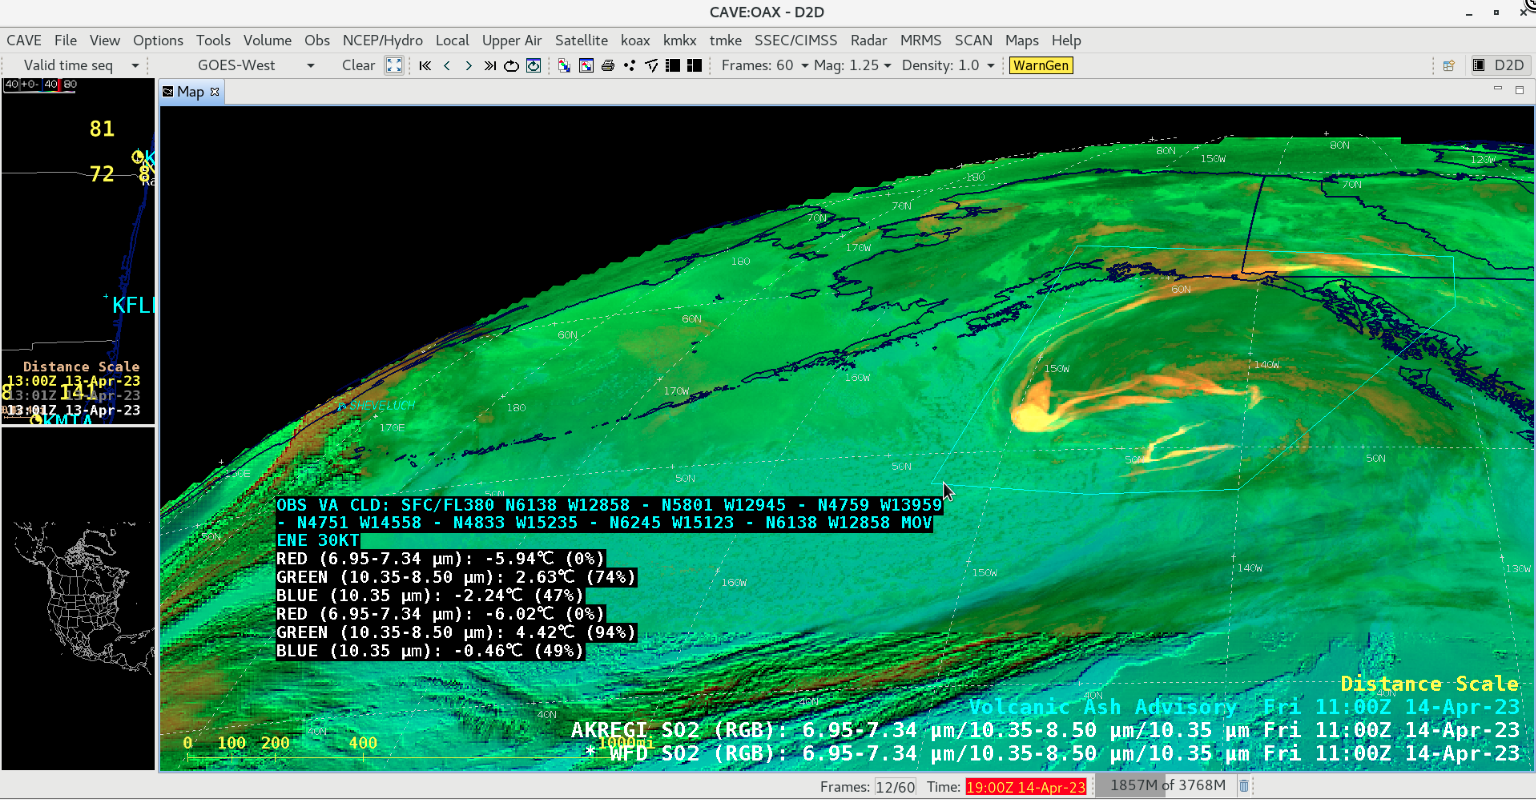
Ash Advisory issued at 1100 UTC on 14 April [click to enlarge]
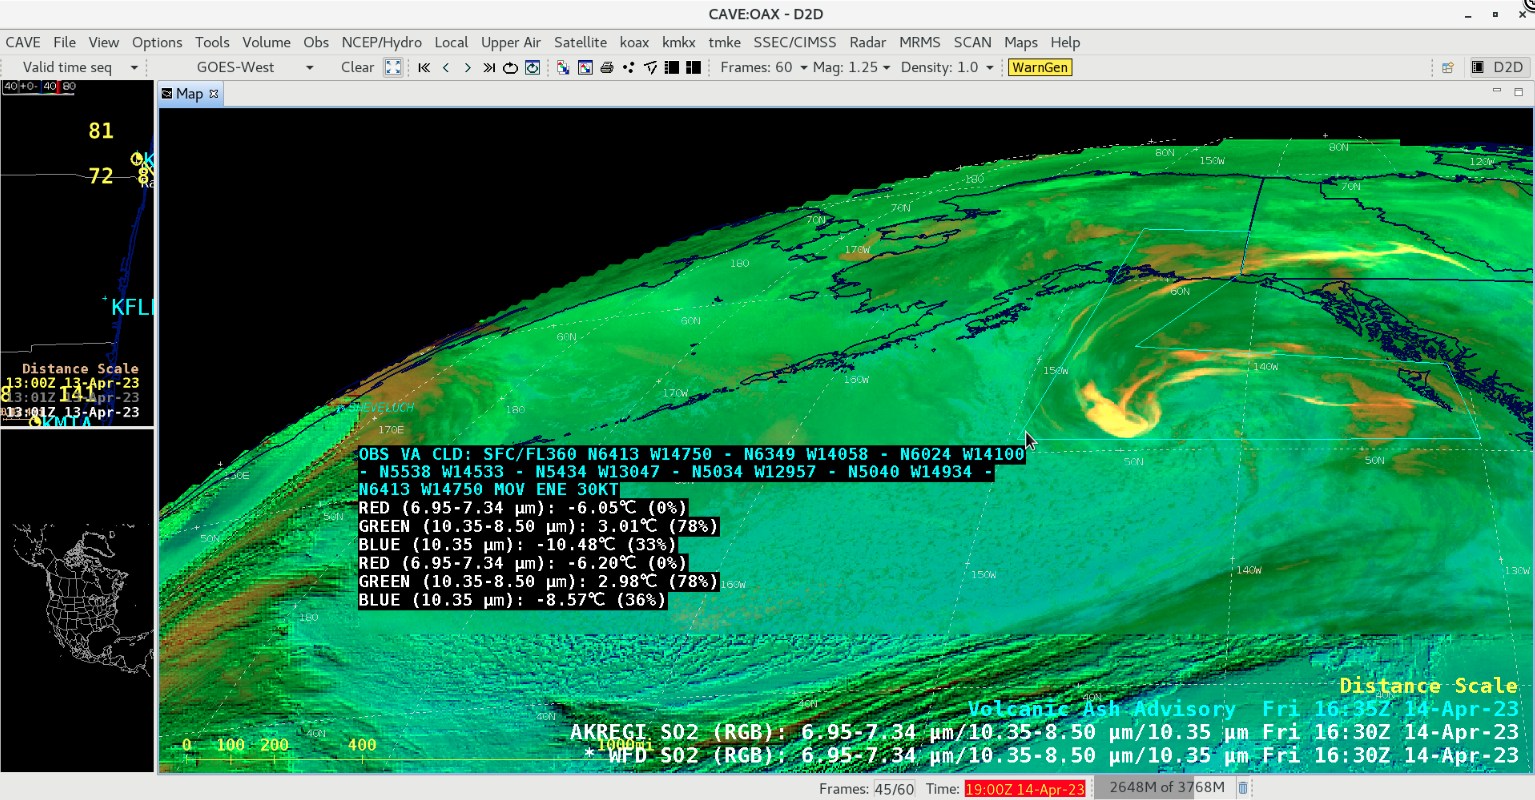
Ash Advisory issued at 1630 UTC on 14 April [click to enlarge]
View only this post
Read Less


