This website works best with a newer web browser such as Chrome, Firefox, Safari or Microsoft
Edge. Internet Explorer is not supported by this website.
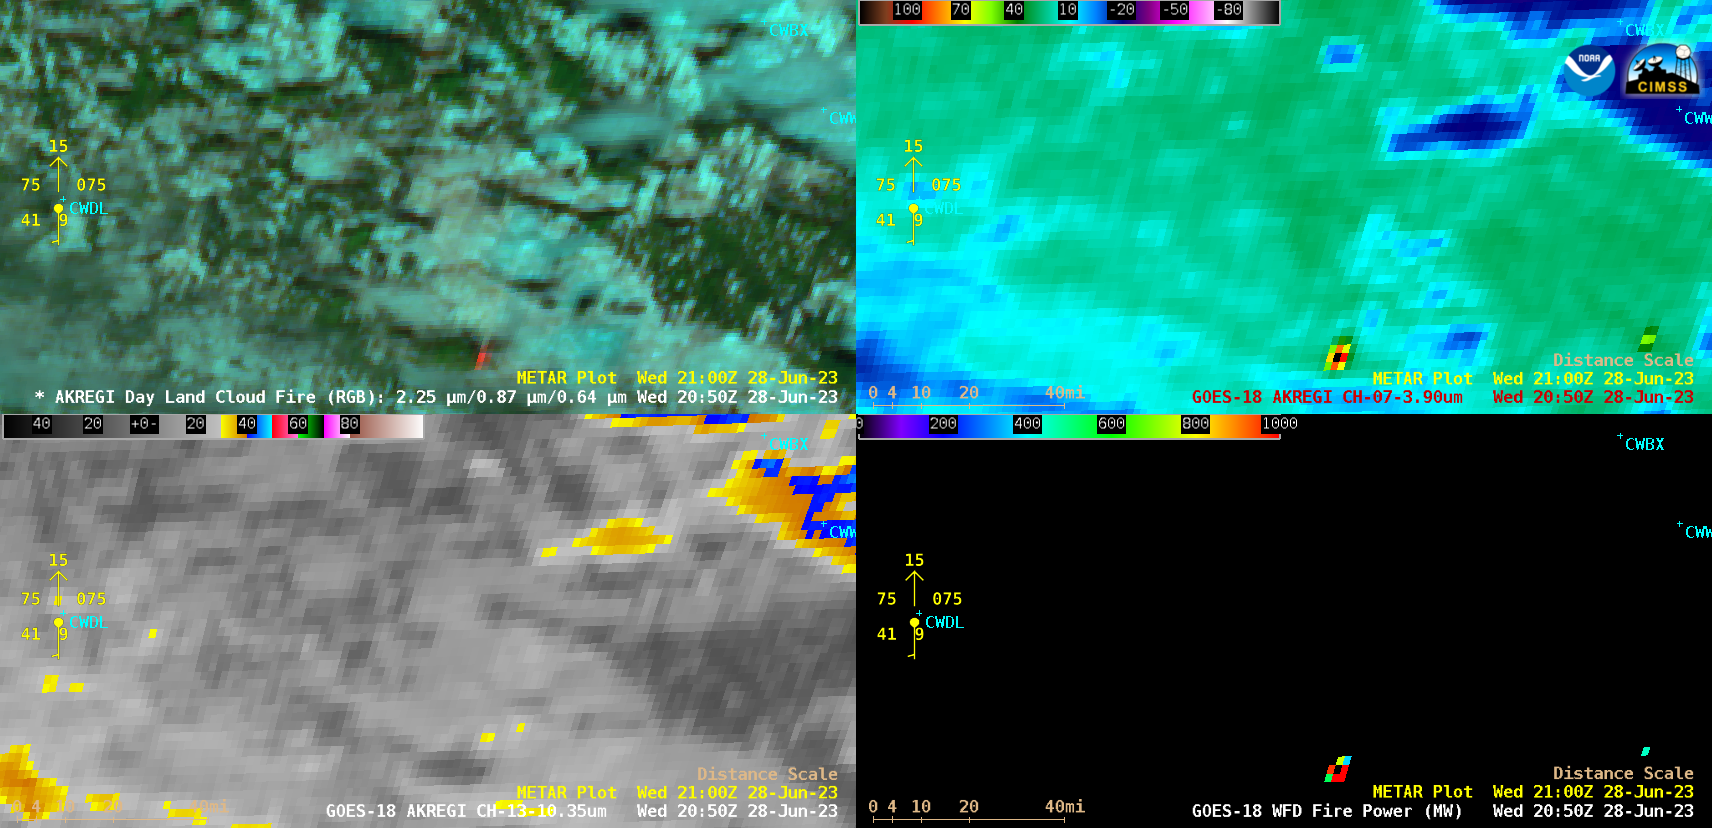
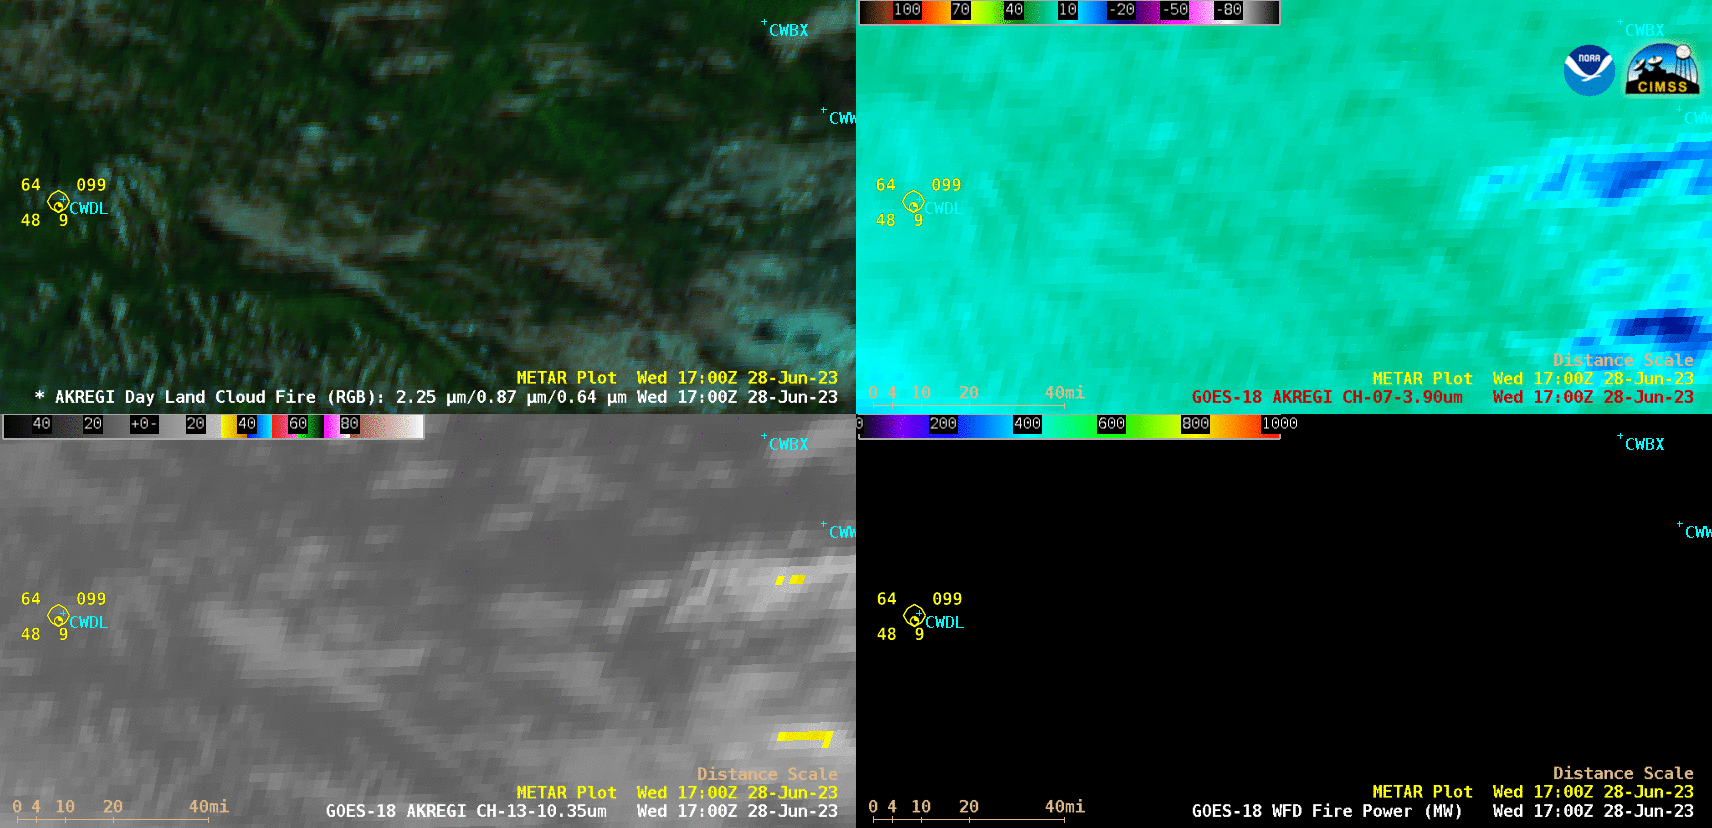
GOES-18 (GOES-West) Day Land Cloud Fire RGB, Shortwave Infrared (3.9 µm), “Clean” Infrared Window (10.3 µm) images along with the Fire Power derived product (a component of the GOES Fire Detection and Characterization Algorithm FDCA) (above) showed a wildfire southeast of Dease Lake (CWDL) in northern British Columbia that produced a pyrocumulonimbus (pyroCb) cloud late in the day... Read More
GOES-18 Day Land Cloud Fire RGB (top left), Shortwave Infrared (3.9 µm, top right), “Clean” Infrared Window (10.3 µm, bottom left) and Fire Power derived product (bottom right) [click to play animated GIF | MP4]
GOES-18 (GOES-West)Day Land Cloud Fire RGB, Shortwave Infrared (3.9 µm), “Clean” Infrared Window (10.3 µm) images along with the Fire Power derived product (a component of the GOES Fire Detection and Characterization Algorithm FDCA) (above) showed a wildfire southeast of Dease Lake (CWDL) in northern British Columbia that produced a pyrocumulonimbus (pyroCb) cloud late in the day on 28 June 2023.
The thermal signature of the wildfire exhibited 3.9 µm brightness temperatures as hot as 126.3ºC and Fire Power values as high as 2510 MW (both occurring at 2050 UTC). The pyroCB cloud exhibited cloud-top 10.3 µm infrared brightness temperatures as cold as -56.13ºC.
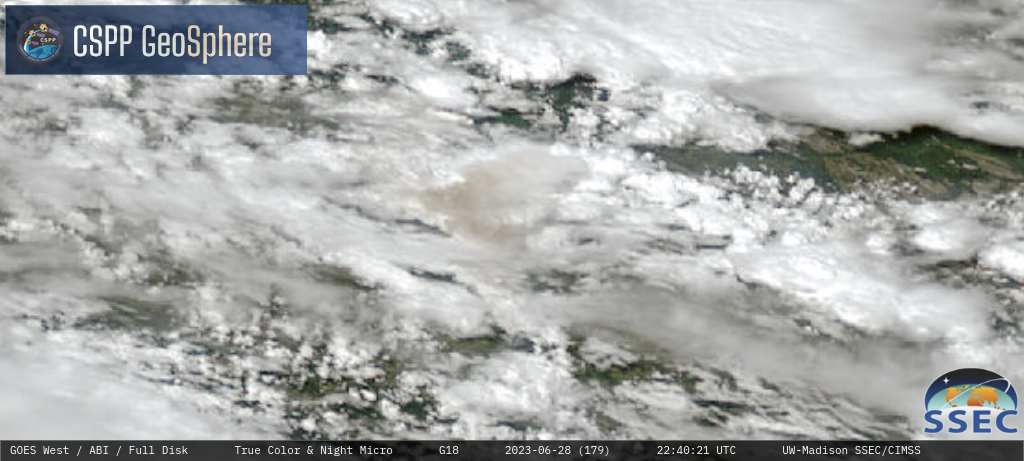
In GOES-18 True Color RGB images from the CSPP GeoSphere site (below), shades of tan to light brown helped to identify the smoke-laden anvil of the pyroCb as it drifted northward.
GOES-18 True Color RGB images [click to play MP4 animation]
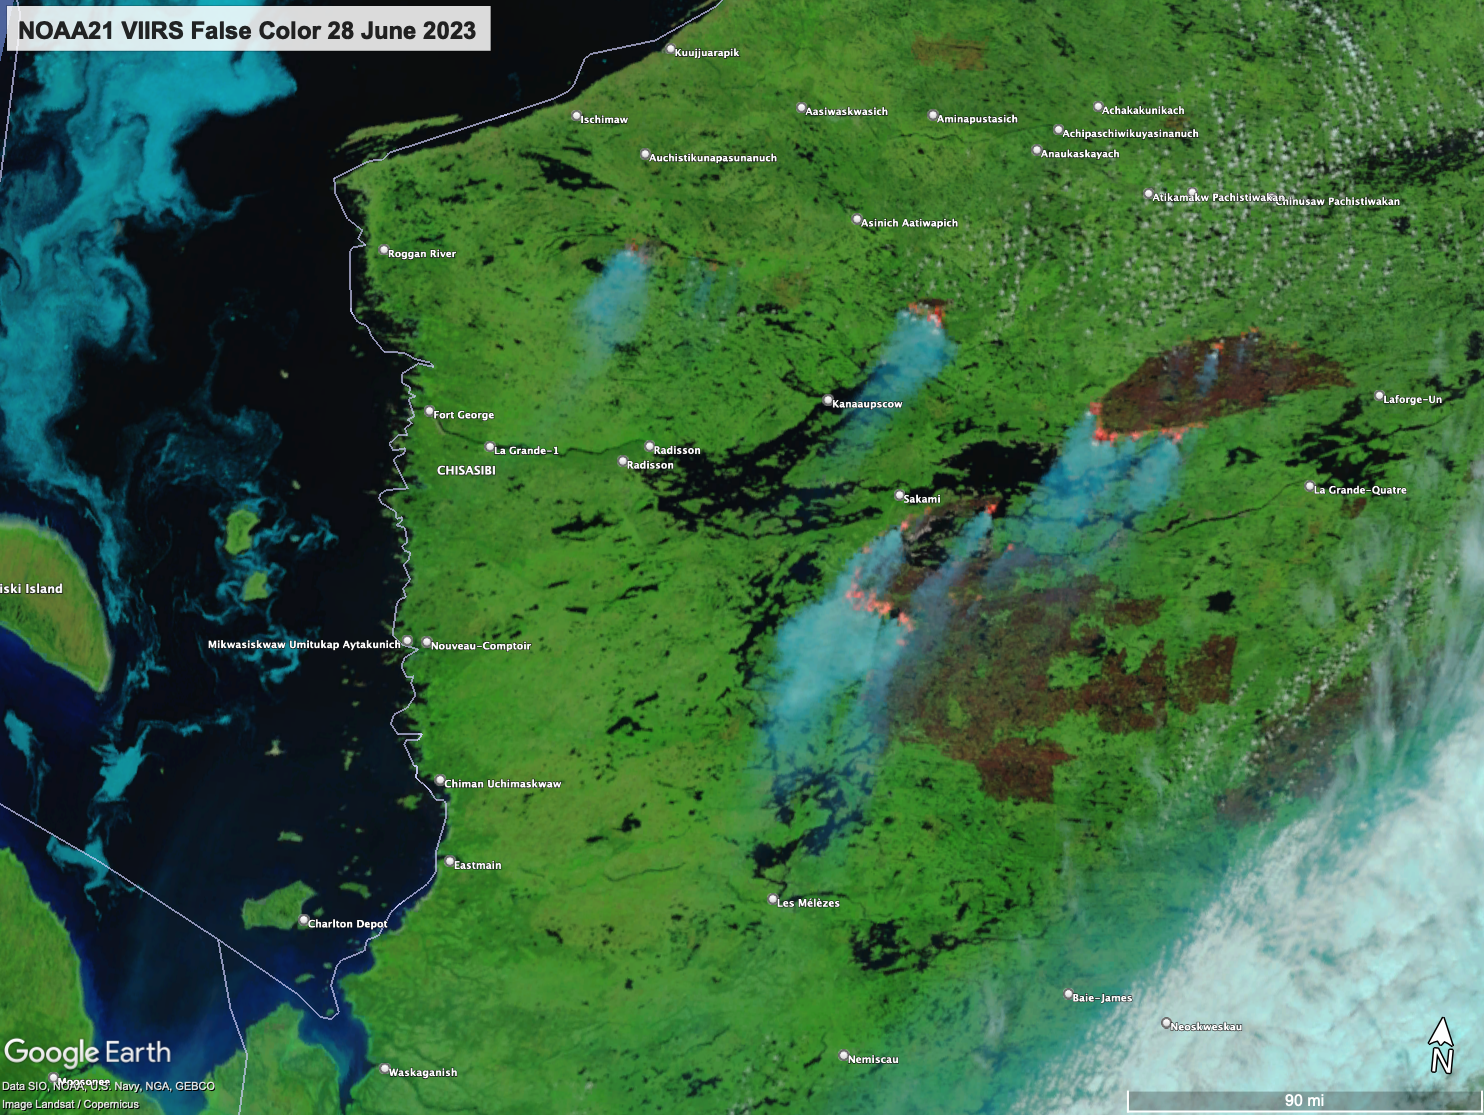
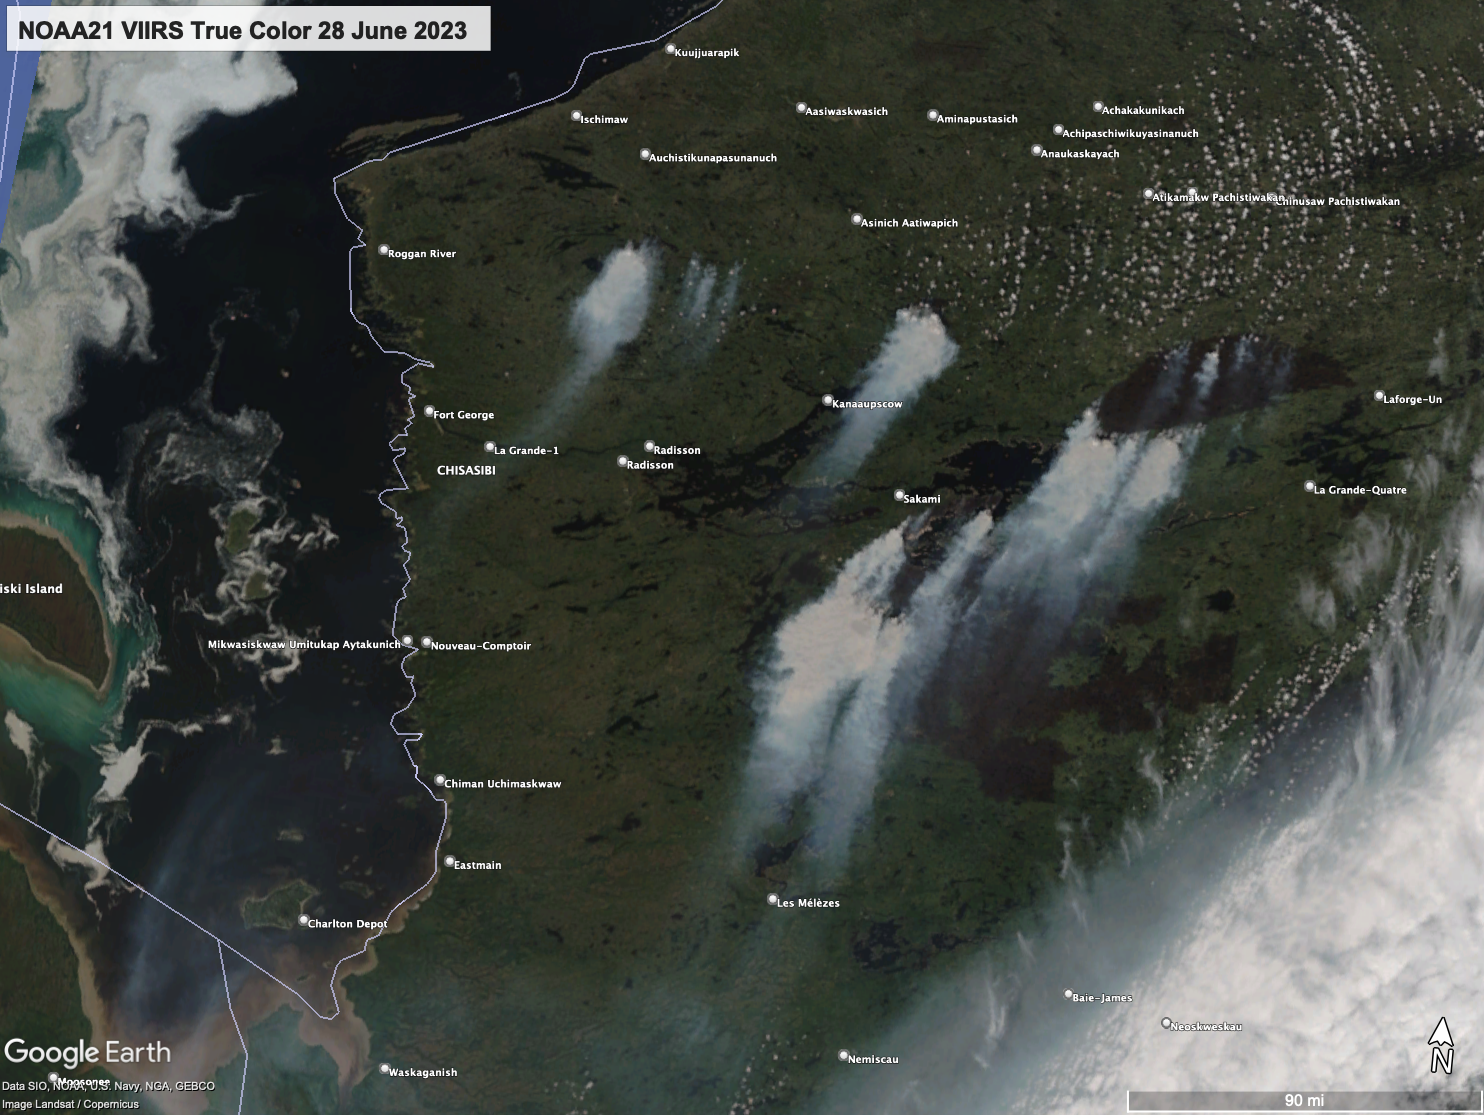
Given all the smoke over United States, one might ask: “Just how much acreage has burned over Canada?” NOAA-21 VIIRS False-color imagery from 28 June, toggled above with True-color imagery, reveal very large burn scars over Quebec to the east of James Bay. In the False-color imagery, the burnscars have a... Read More
NOAA-21 True- and False-color imagery over west-central Quebec, 28 June 2023
Given all the smoke over United States, one might ask: “Just how much acreage has burned over Canada?” NOAA-21 VIIRS False-color imagery from 28 June, toggled above with True-color imagery, reveal very large burn scars over Quebec to the east of James Bay. In the False-color imagery, the burnscars have a brownish hue such as the oval feature just west of Laforge-un at the eastern edge of the image. That scar also shows active burning along its southwestern edge, and its smoke plume extends southwestward to the burnscar that is southeast of Sakami. It is very difficult to discern the burn scars in the True-color imagery. The smoke plumes themselves are more apparent in True-color vs False-color.
VIIRS ‘False Color’ imagery uses bands M11, I2 and I1 for the red/green/blue components of the RGB. (link) ‘True Color’ imagery uses M5/M4/M3 and the I1 band can be used to sharpen the imagery.
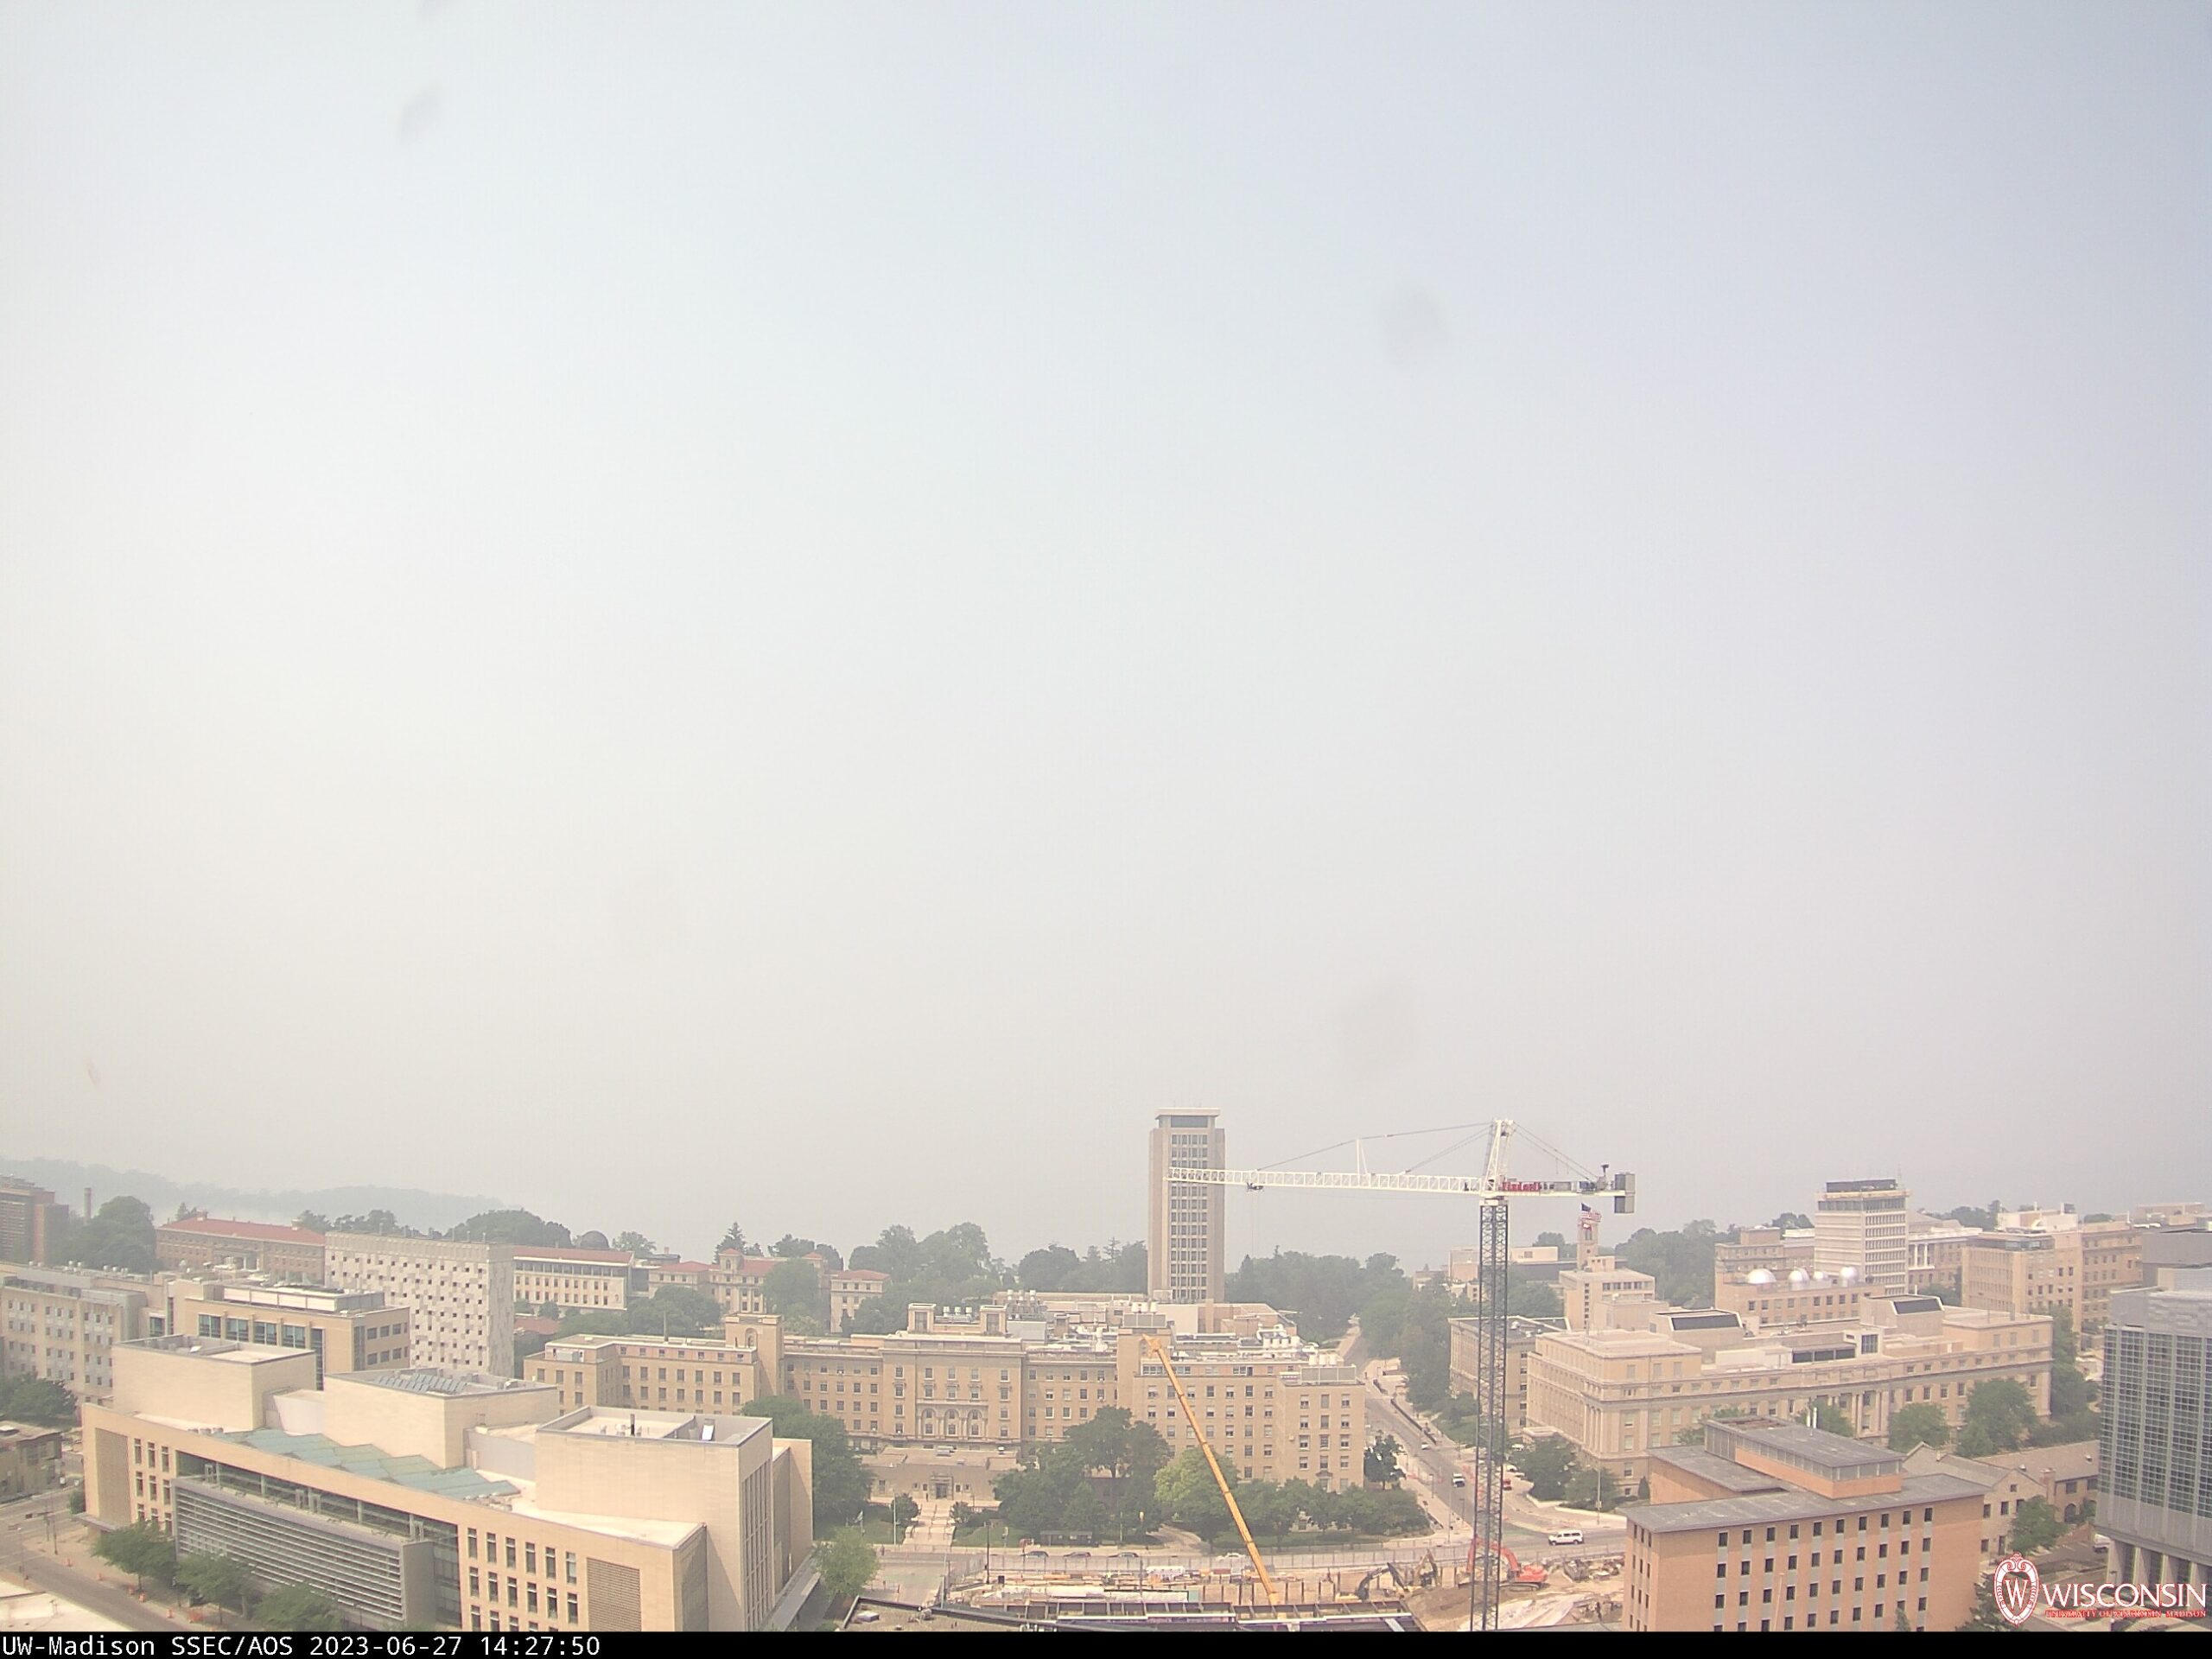
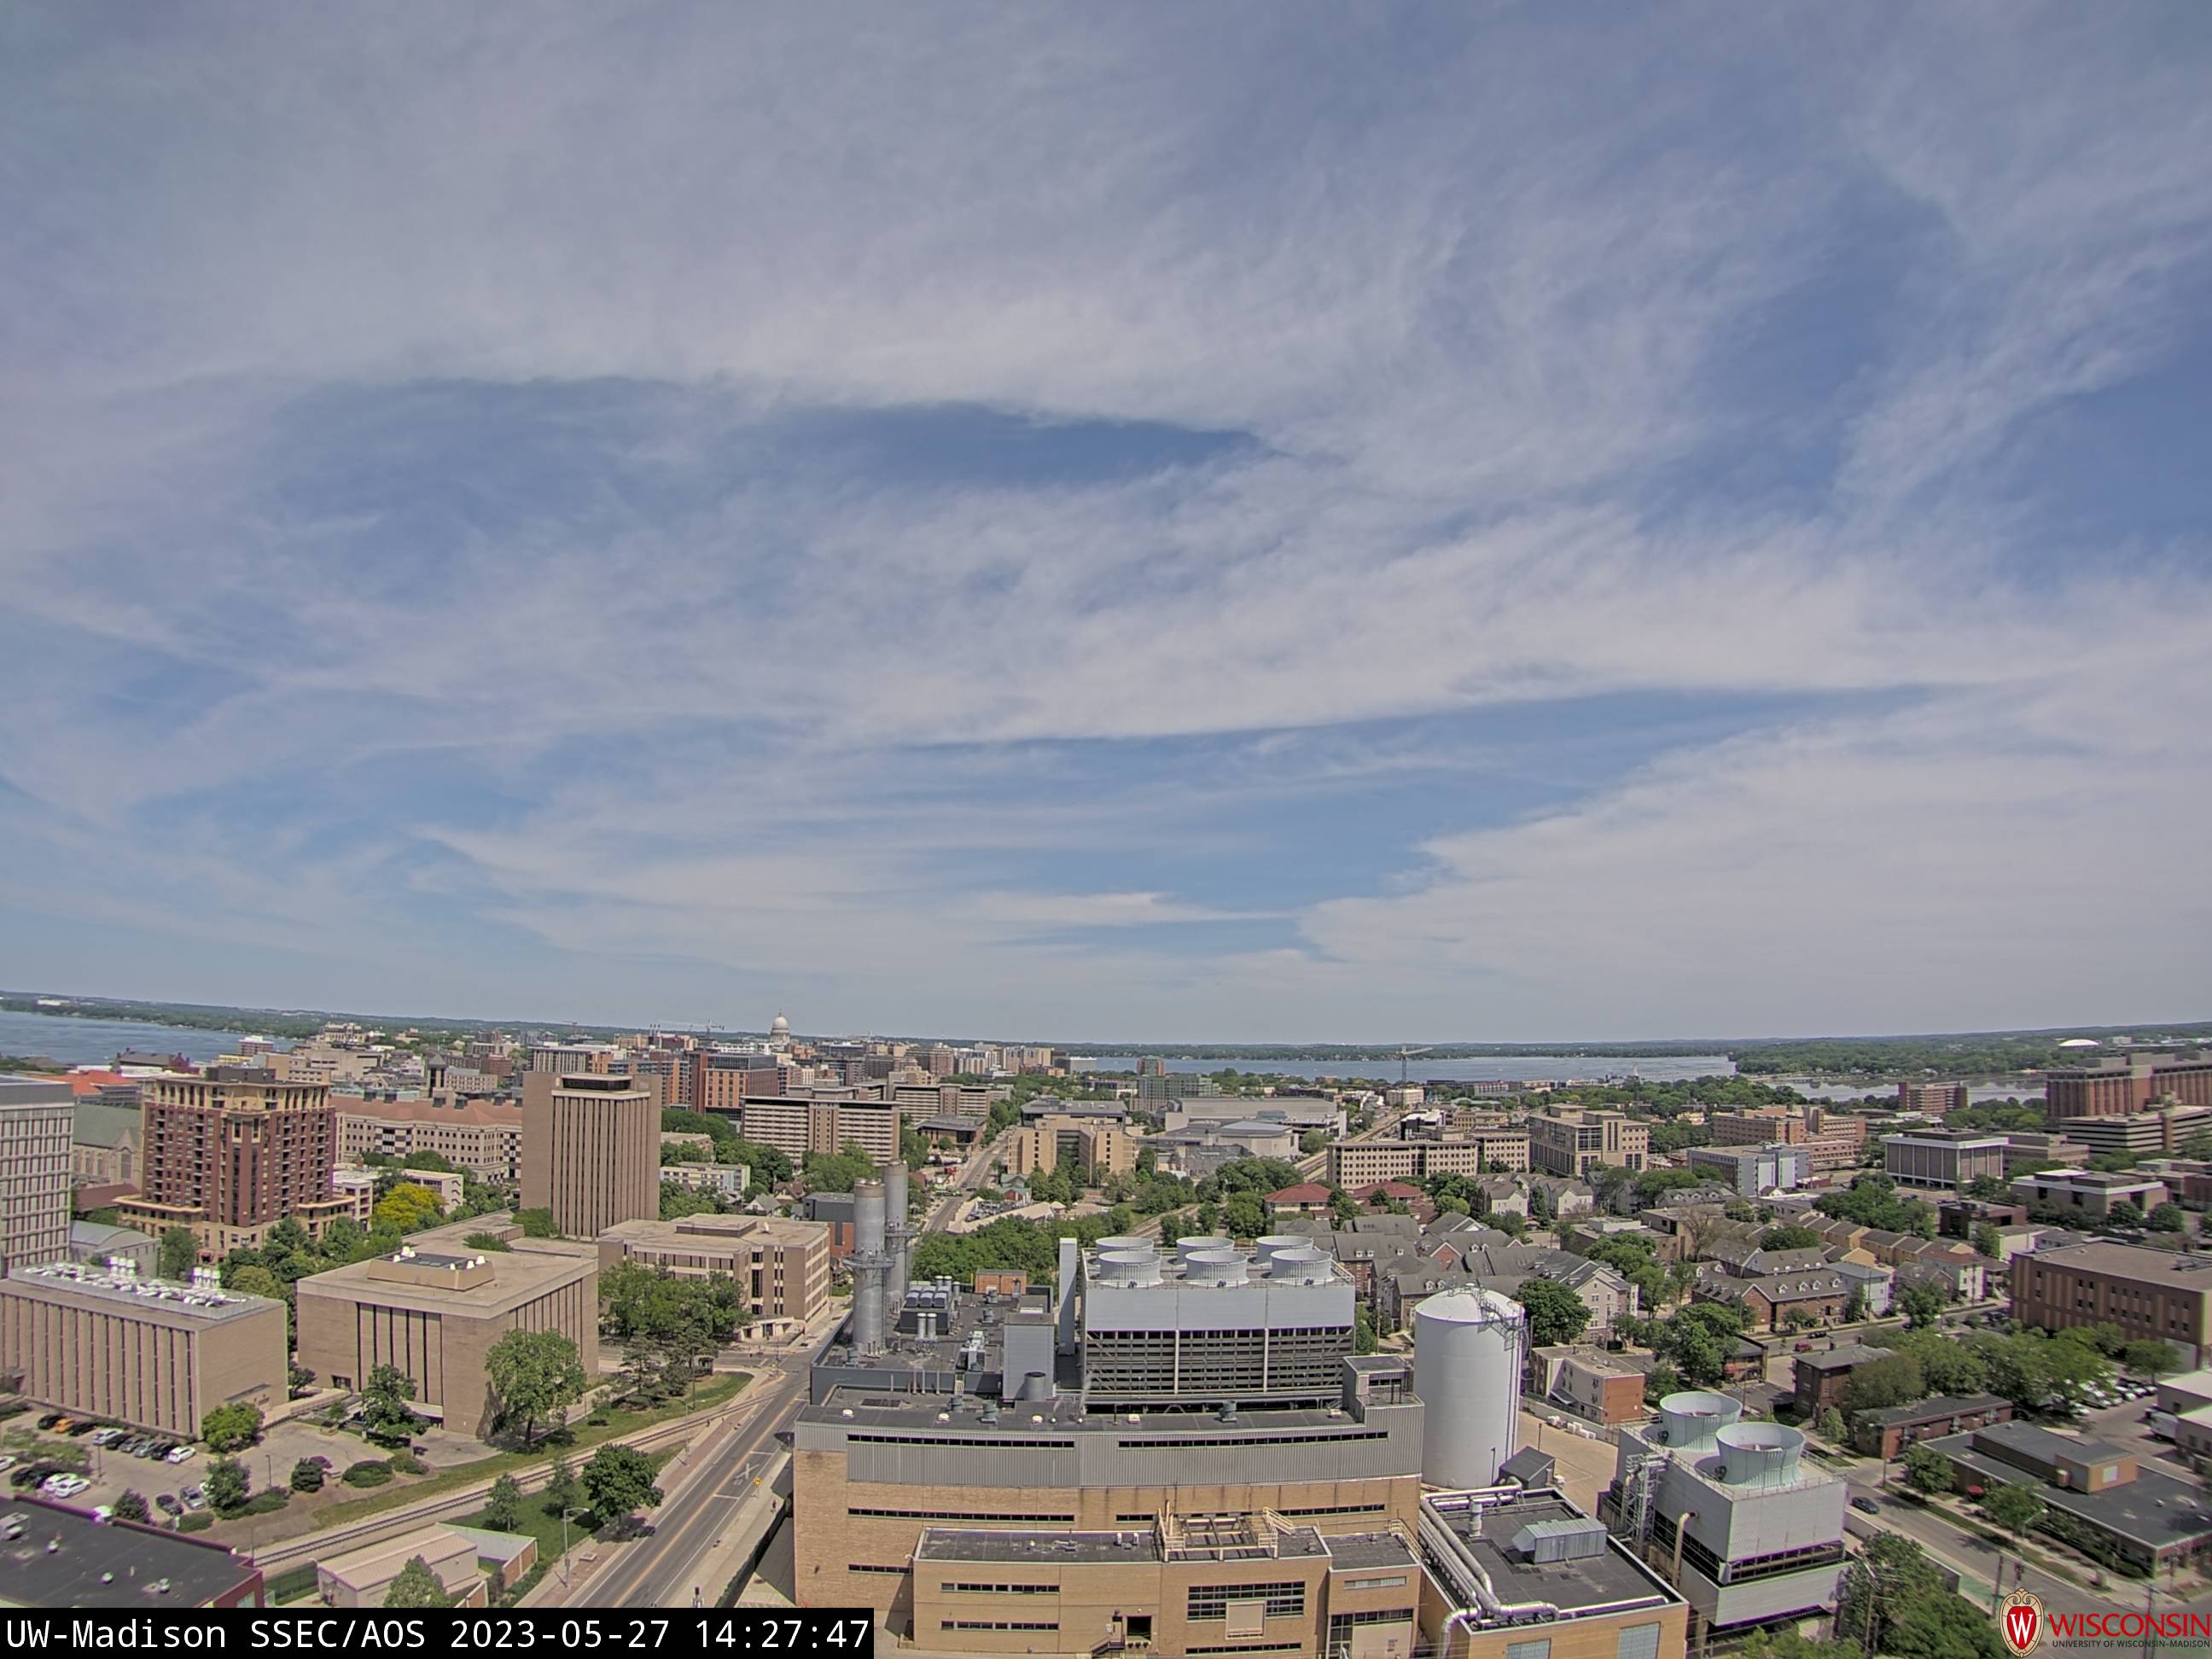
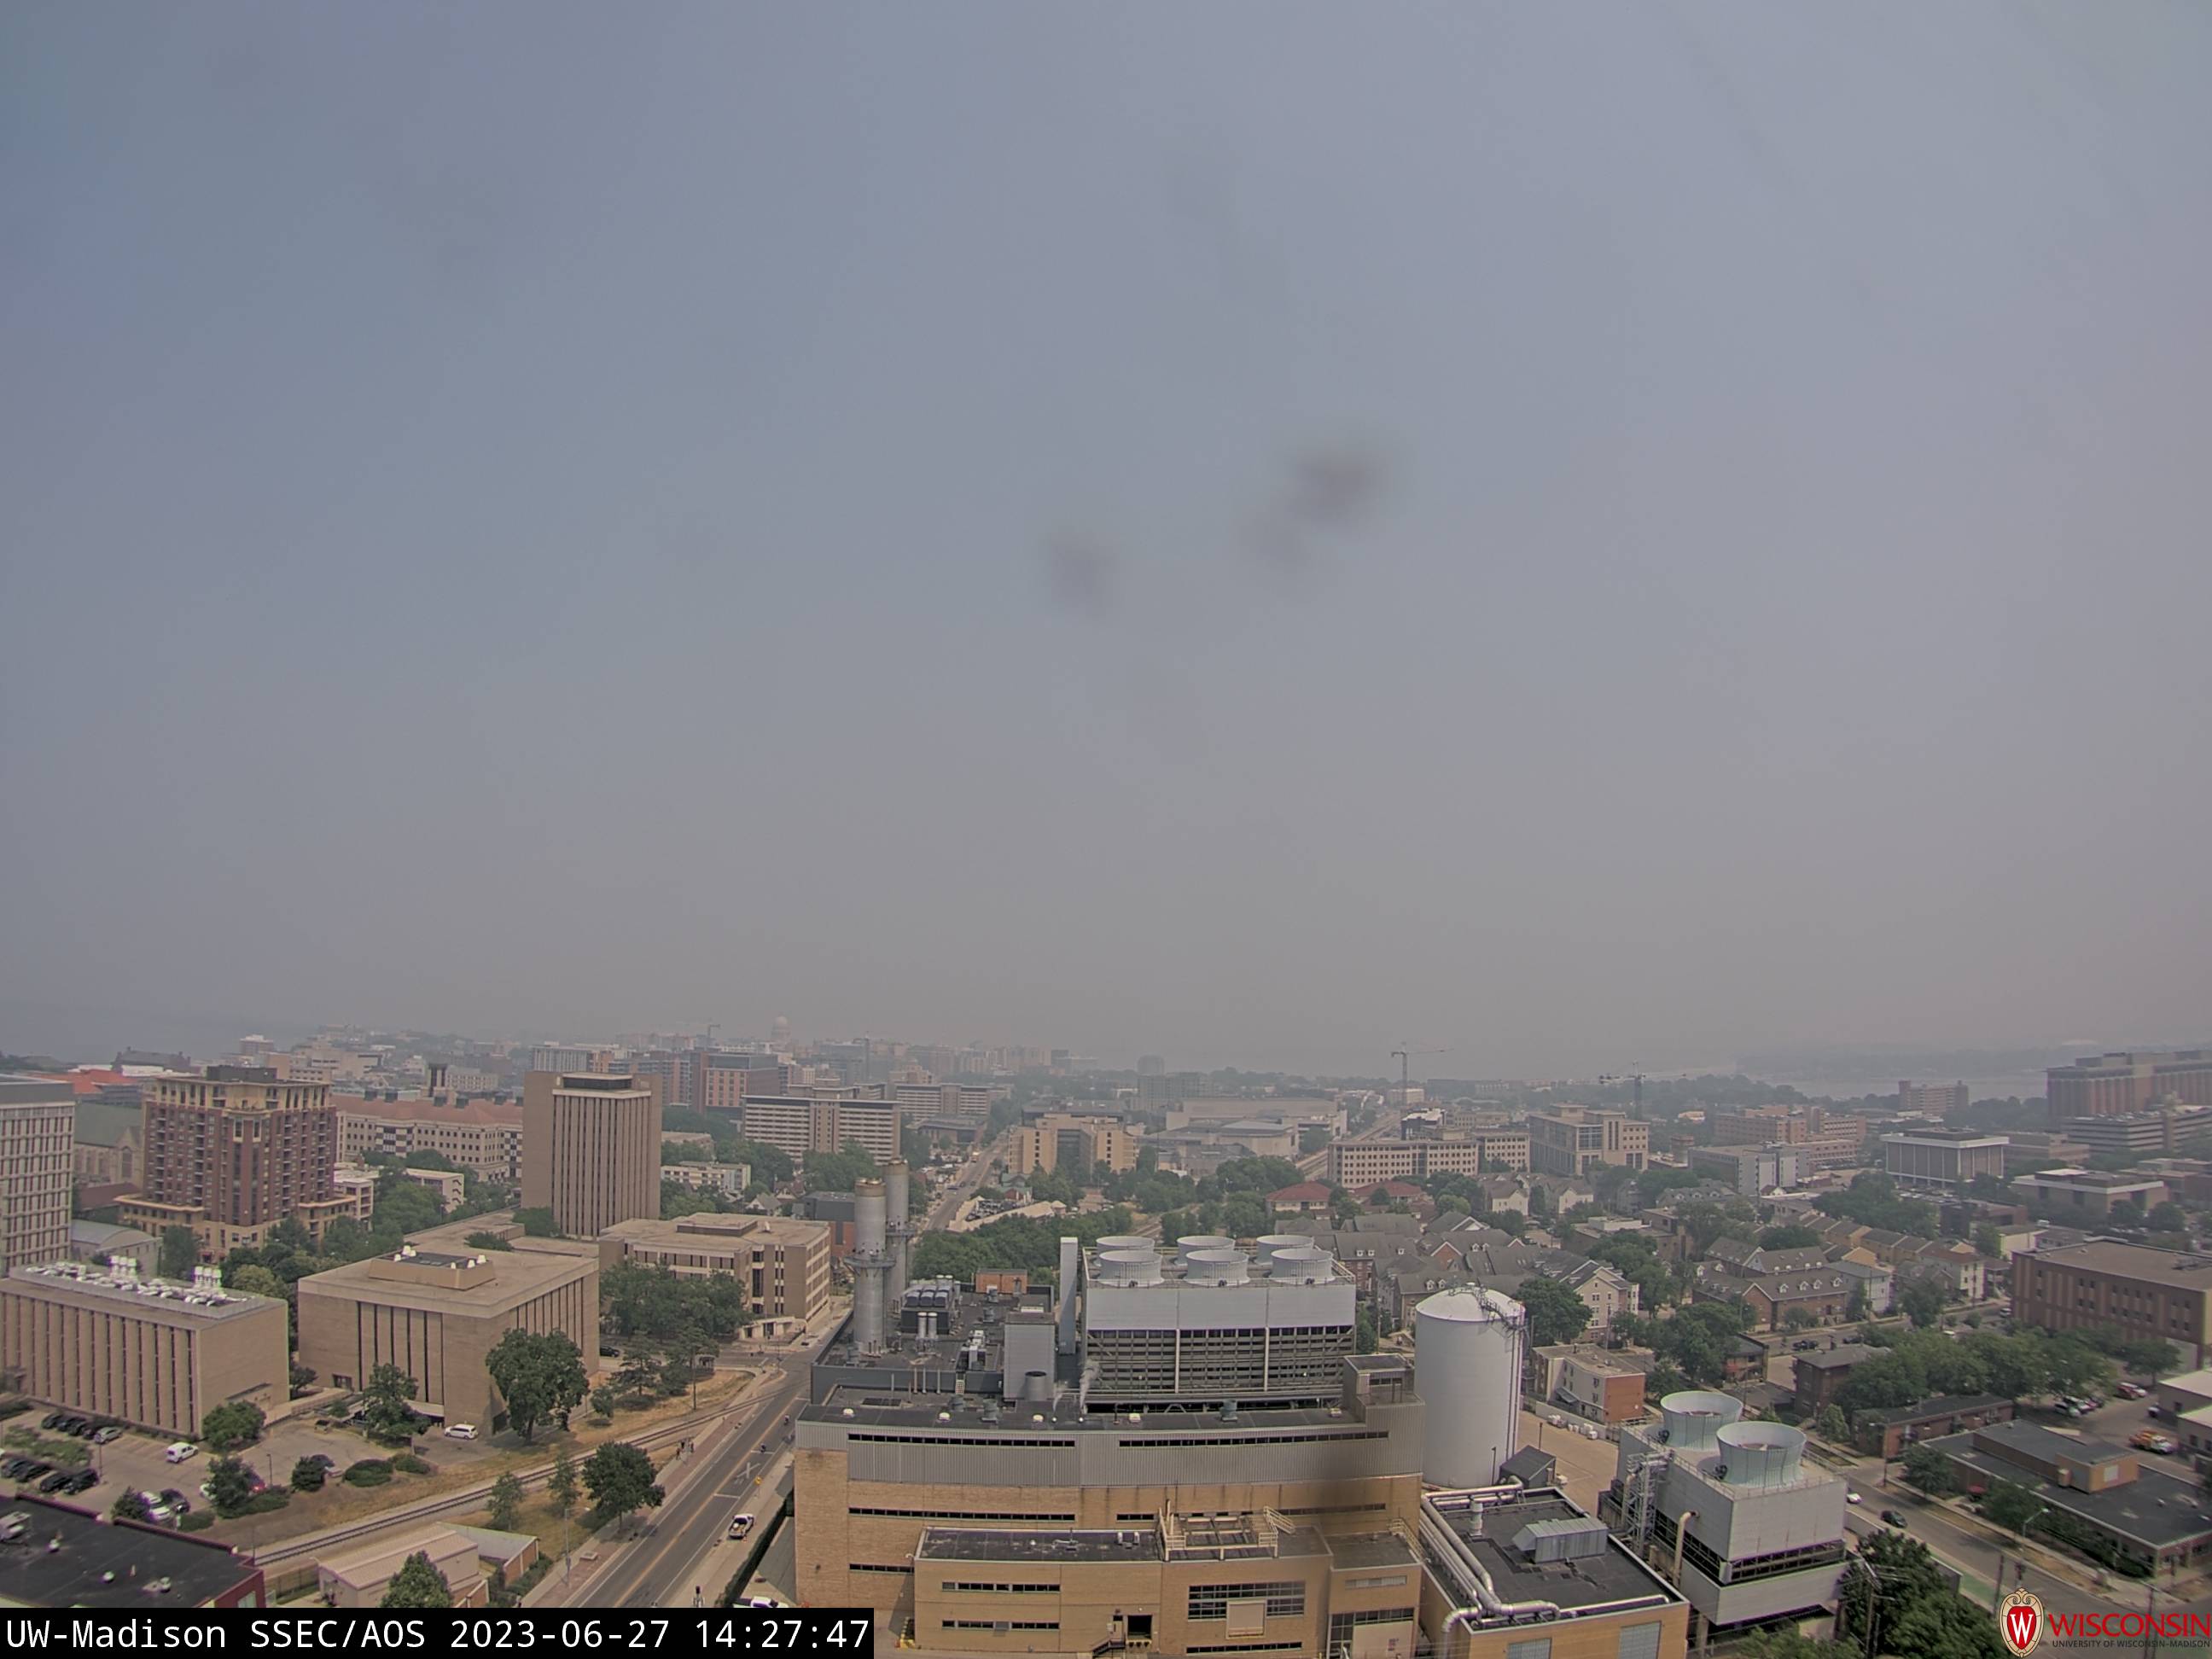
The slider above (imagery courtesy Tim Wagner, CIMSS, derived from the rooftop cameras on the AOSS Building in Madison WI) compares the relatively clean air of 27 May with the very poor air of 27 June. Smoke from forest fires, mostly in Canada, has overspread the upper midwest. The motion of that smoke on 27 June is plain to see in the animation... Read More
The slider above (imagery courtesy Tim Wagner, CIMSS, derived from the rooftop cameras on the AOSS Building in Madison WI) compares the relatively clean air of 27 May with the very poor air of 27 June. Smoke from forest fires, mostly in Canada, has overspread the upper midwest. The motion of that smoke on 27 June is plain to see in the animation of true color imagery, below, from the CSPP Geosphere site. Smoke is especially thick over northeastern WI, and the smoke as a whole is moving southward.
GOES-16 True-Color imagery (every 15 minutes), from 1236 – 2121 UTC on 27 June 2023
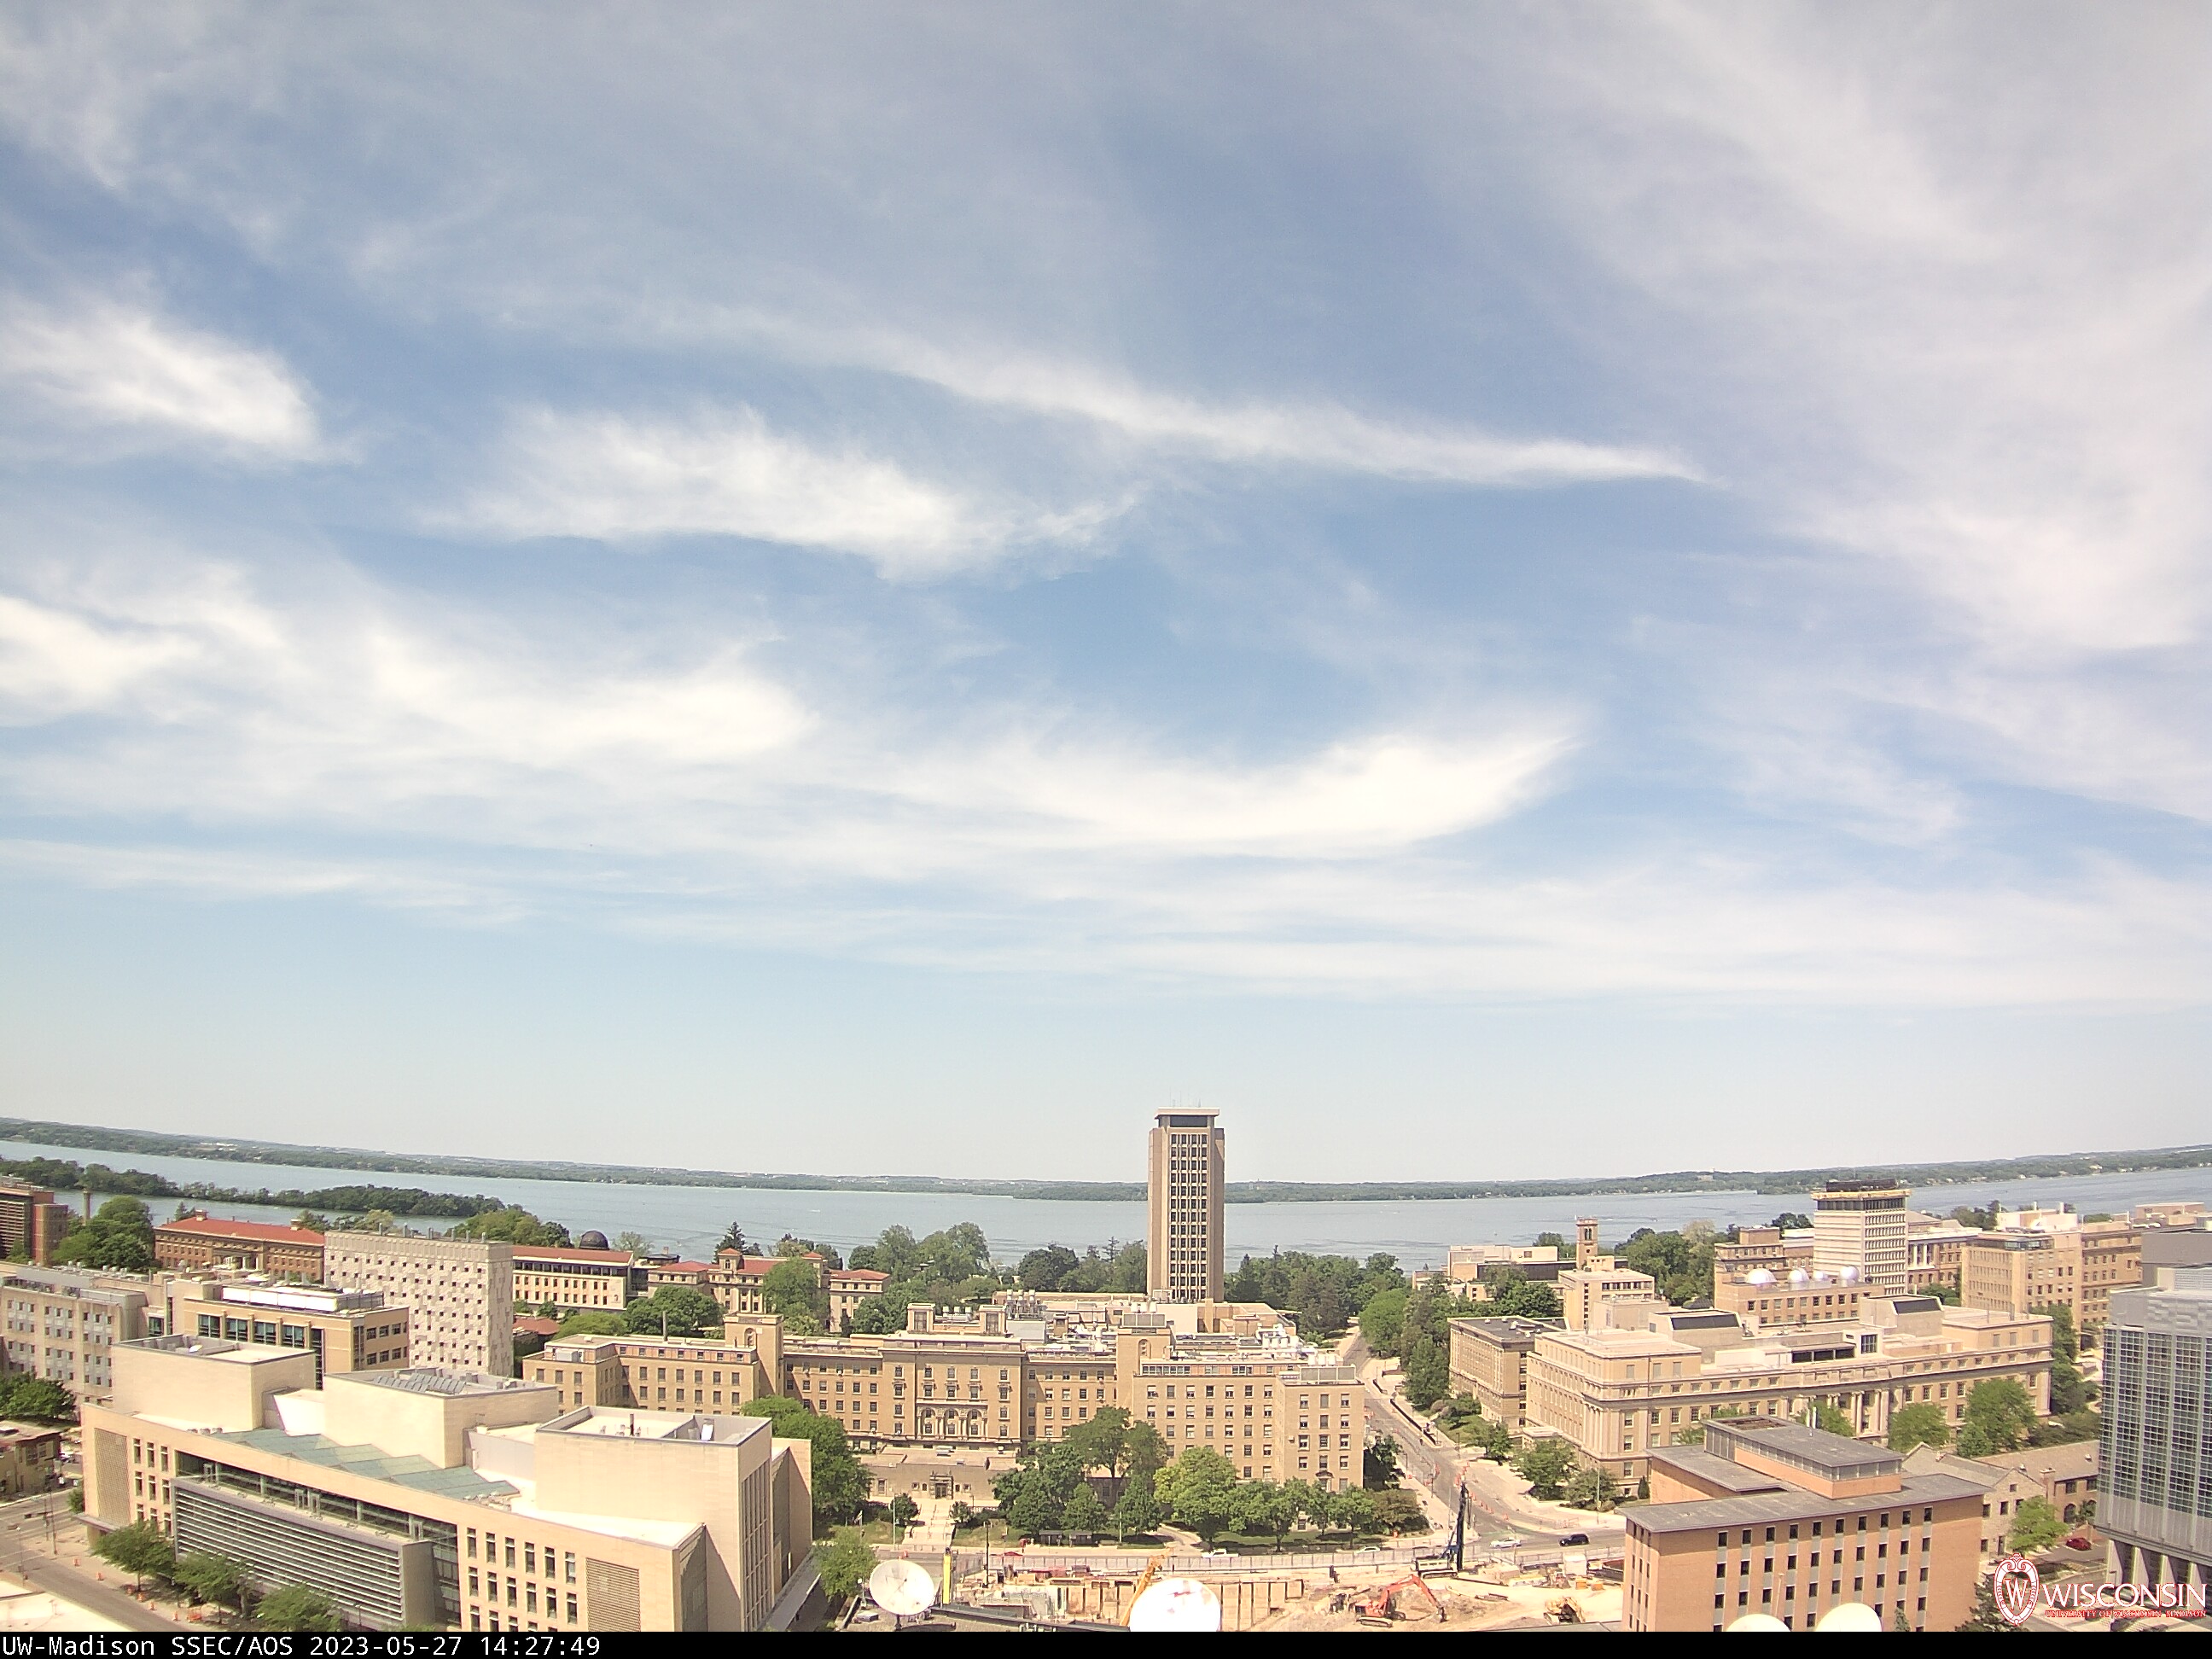
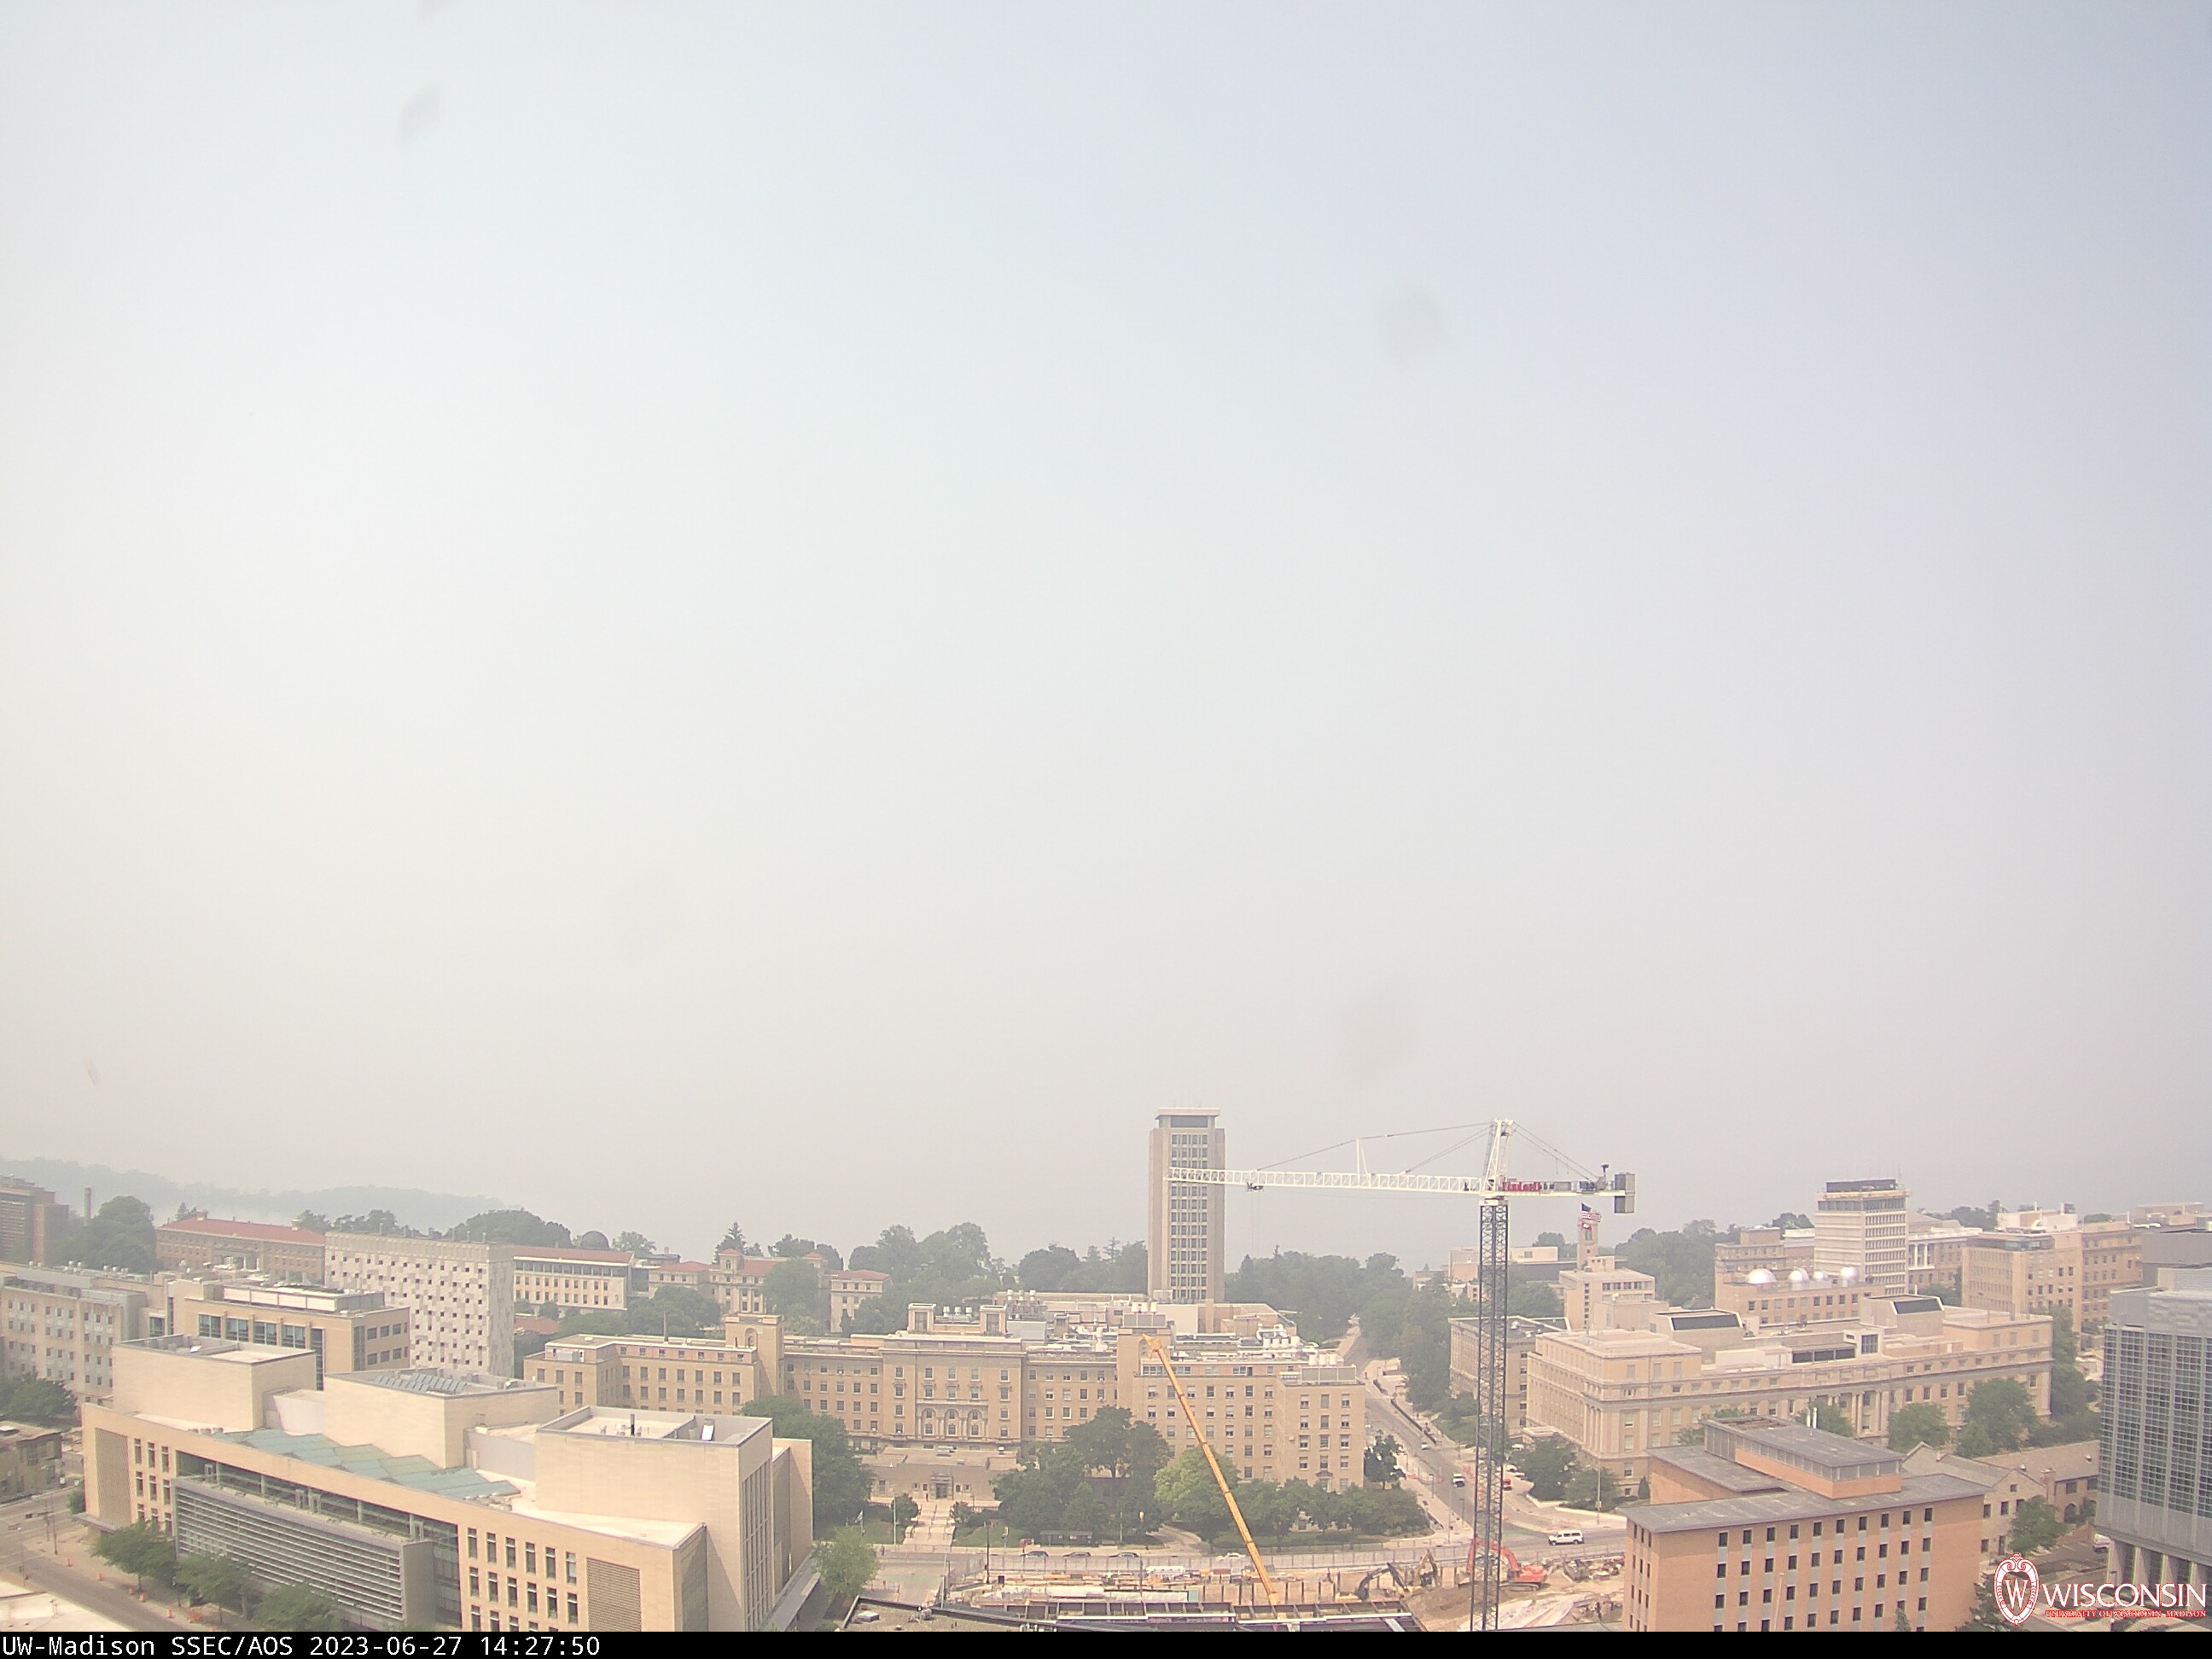
There are also roof-top cameras pointing north. That comparison of 27 May and 27 June images is shown below.
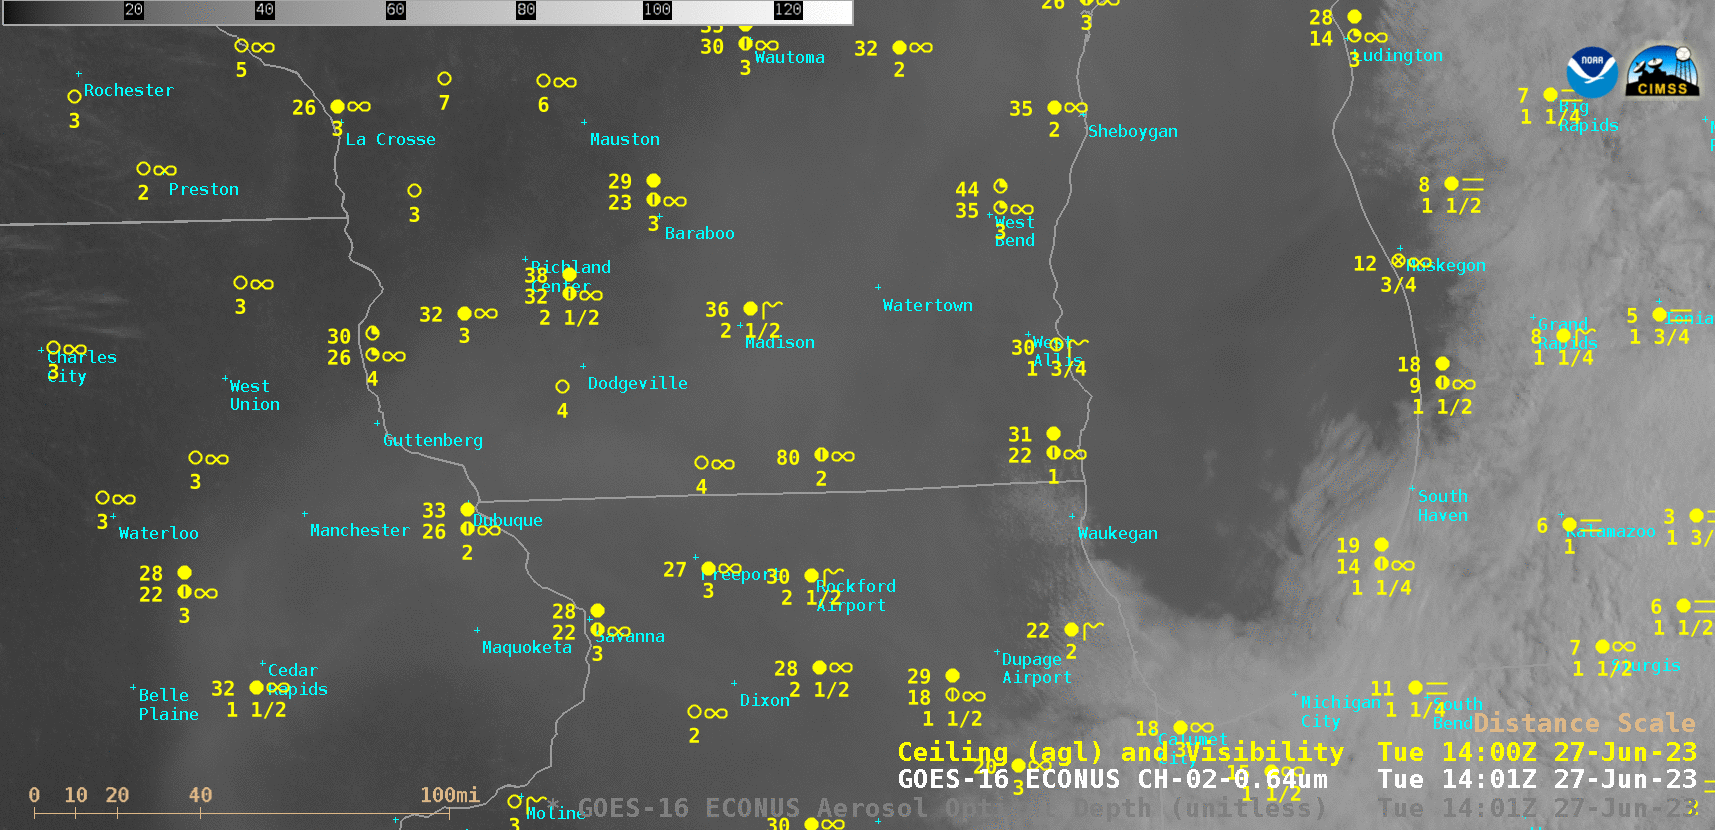
GOES-16 “Red” Visible (0.64 µm) and Aerosol Optical Depth derived product images, with Ceiling/Visibility reports plotted in yellow (courtesy Scott Bachmeier, CIMSS) [click to play animated GIF| MP4]
In a sequence of GOES-16 (GOES-East) “Red” Visible (0.64 µm) and Aerosol Optical Depth (AOD) derived product images (above), the hazy appearance of the wildfire smoke was very pronounced in the otherwise cloud-free sky across eastern/southern Wisconsin, southern Lake Michigan, eastern Iowa and northern Illinois — and AOD values of 1.0 and higher (darker red) covered much of the region. In fact, AOD values near Milwaukee (KMKE) were close to 4.0 (below). Surface visibility at Kenosha (located in far southeastern Wisconsin) was as low as 3/4 mile.
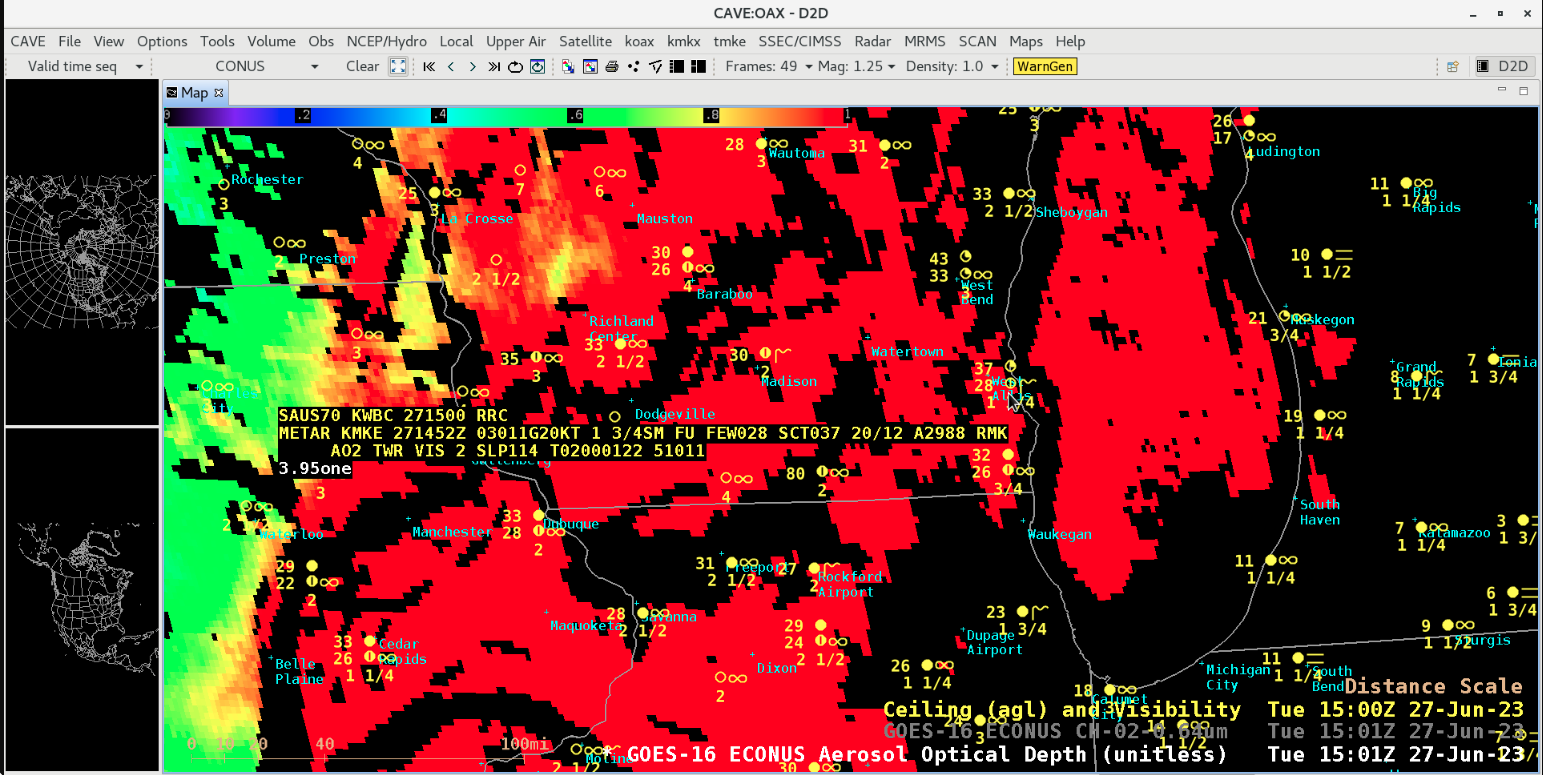
GOES-16 Aerosol Optical Depth derived product at 1501 UTC, showing the cursor-sampled AOD value of 3.95 along with the nearby METAR report at Milwaukee KMKE [click to enlarge]
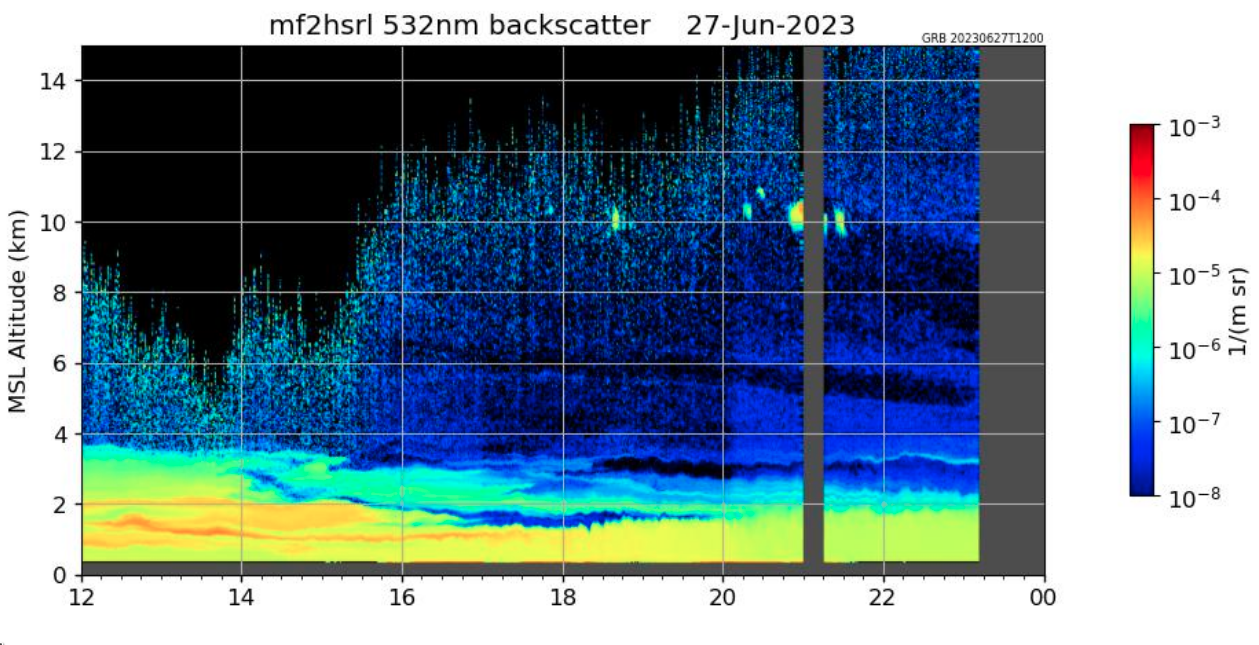
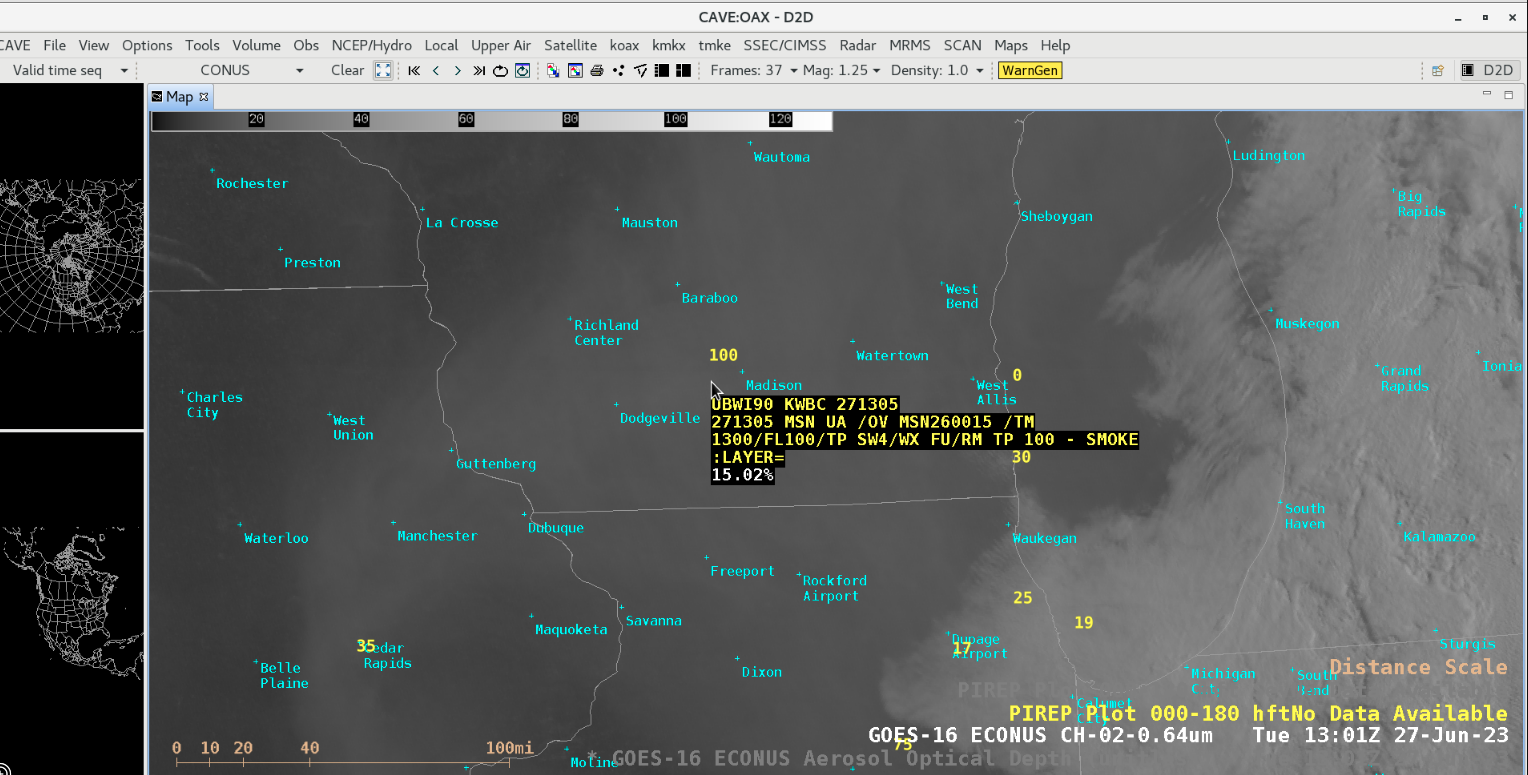
Ground-based lidar in Madison, Wisconsin revealed significant backscatter (due to the dense smoke) from the surface to an altitude of 2-3 km during much of the daytime hours (below). AOD values in the vicinity of Madison were generally in the 1.5-1.8 range during much of the day — and the surface visibility at Madison’s airport was as low as 1-1/4 miles at 19 UTC.
Surface-based lidar backscatter at Madison, Wisconsin [click to enlarge]
A Pilot Report 15 miles west of Madison MSN at 1300 UTC (below) indicated that the top of the smoke layer was at 10,000 feet (3.0 km).
GOES-16 “Red” Visible (0.64 µm) image at 1301 UTC, showing a cursor-sampled Pilot Report near Madison MSN [click to enlarge]
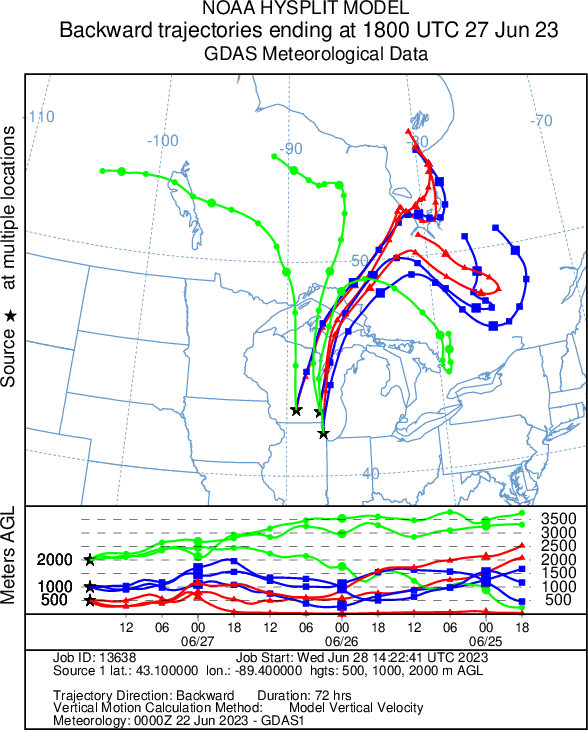
HYSPLIT model 72-hour back trajectories (below) indicated that the source region for much of the smoke within the boundary layer at Madison WI, Milwaukee WI and Chicago IL — particularly at altitudes of 500 m and 1 km — was Quebec, where wildfire activity had been high since early June.
HYSPLIT mode 72-hour back trajectories, ending at Madison WI, Milwaukee WI and Chicago IL at 1800 UTC on 27 June
Chicago had the worst air quality in the world Tuesday as wildfire smoke from Quebec, Canada, seeps into the Midwest. https://t.co/fYkAOuvtkB
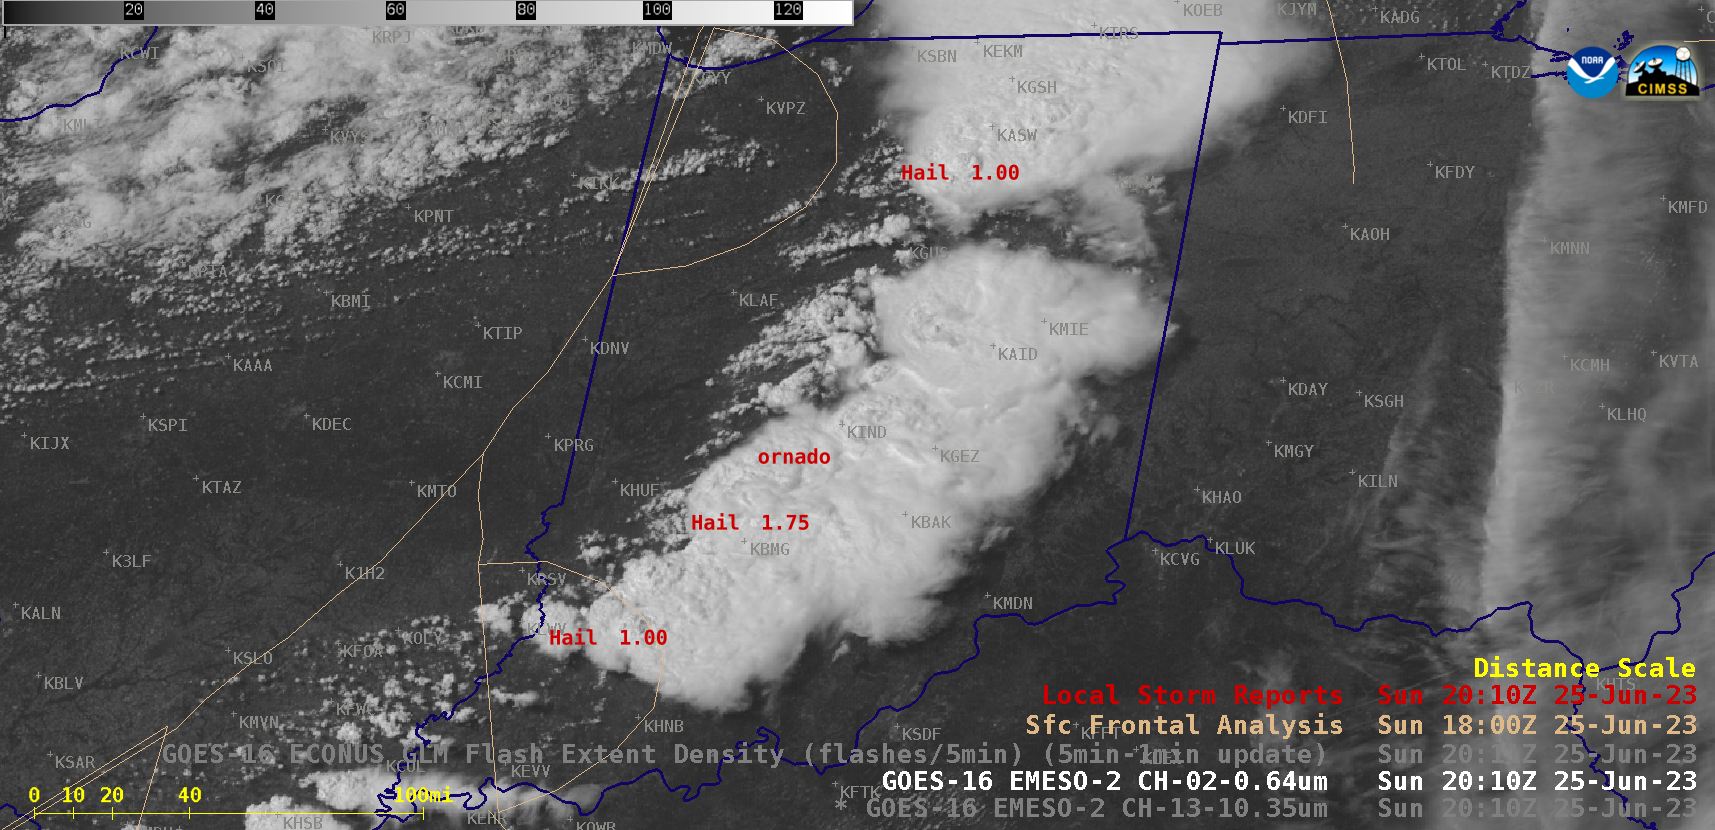
1-minute Mesoscale Domain Sector GOES-16 (GOES-East) “Red” Visible (0.64 µm) and “Clean” Infrared Window (10.3 µm) images (above) include time-matched plots of Local Storm Reports — which showed thunderstorms that produced several tornadoes, hail to 4.00 inches in diameter and wind gusts to 70 mph (SPC Storm Reports) along with some heavy rainfall and flooding across much of Indiana (and parts of adjacent... Read More
GOES-16 “Red” Visible (0.64 µm) and “Clean” Infrared Window (10.3 µm) images, with Local Storm Reports plotted in red/cyan [click to play animated GIF| MP4]
1-minute Mesoscale Domain Sector GOES-16 (GOES-East) “Red” Visible (0.64 µm) and “Clean” Infrared Window (10.3 µm) images (above) include time-matched plots of Local Storm Reports — which showed thunderstorms that produced several tornadoes, hail to 4.00 inches in diameter and wind gusts to 70 mph (SPC Storm Reports) along with some heavy rainfall and flooding across much of Indiana (and parts of adjacent states) on 25 June 2023.
1-minute GOES-16 Visible and Infrared images that included an overlay of GLMFlash Extent Density(below) displayed notable lightning activity with these thunderstorms.
GOES-16 “Red” Visible (0.64 µm) and “Clean” Infrared Window (10.3 µm) images, with an overlay of GLM Flash Extent Density [click to play animated GIF| MP4]
GOES-16 Lifted Index (LI) and Convective Available Potential Energy (CAPE) derived products (below) showed a destabilizing air mass within the pre-convective environment ahead of the approaching frontal boundary — the most unstable LI values were -8 to -9ºC, with CAPE values in the 1500-1800 J/kg range.
GOES-16 “Red” Visible (0.64 µm) images, with overlays of CAPE / Lifted Index derived products and Local Storm Reports plotted in red [click to play animated GIF| MP4]


