30-second imagery of mountain waves over the Mid-Atlantic states
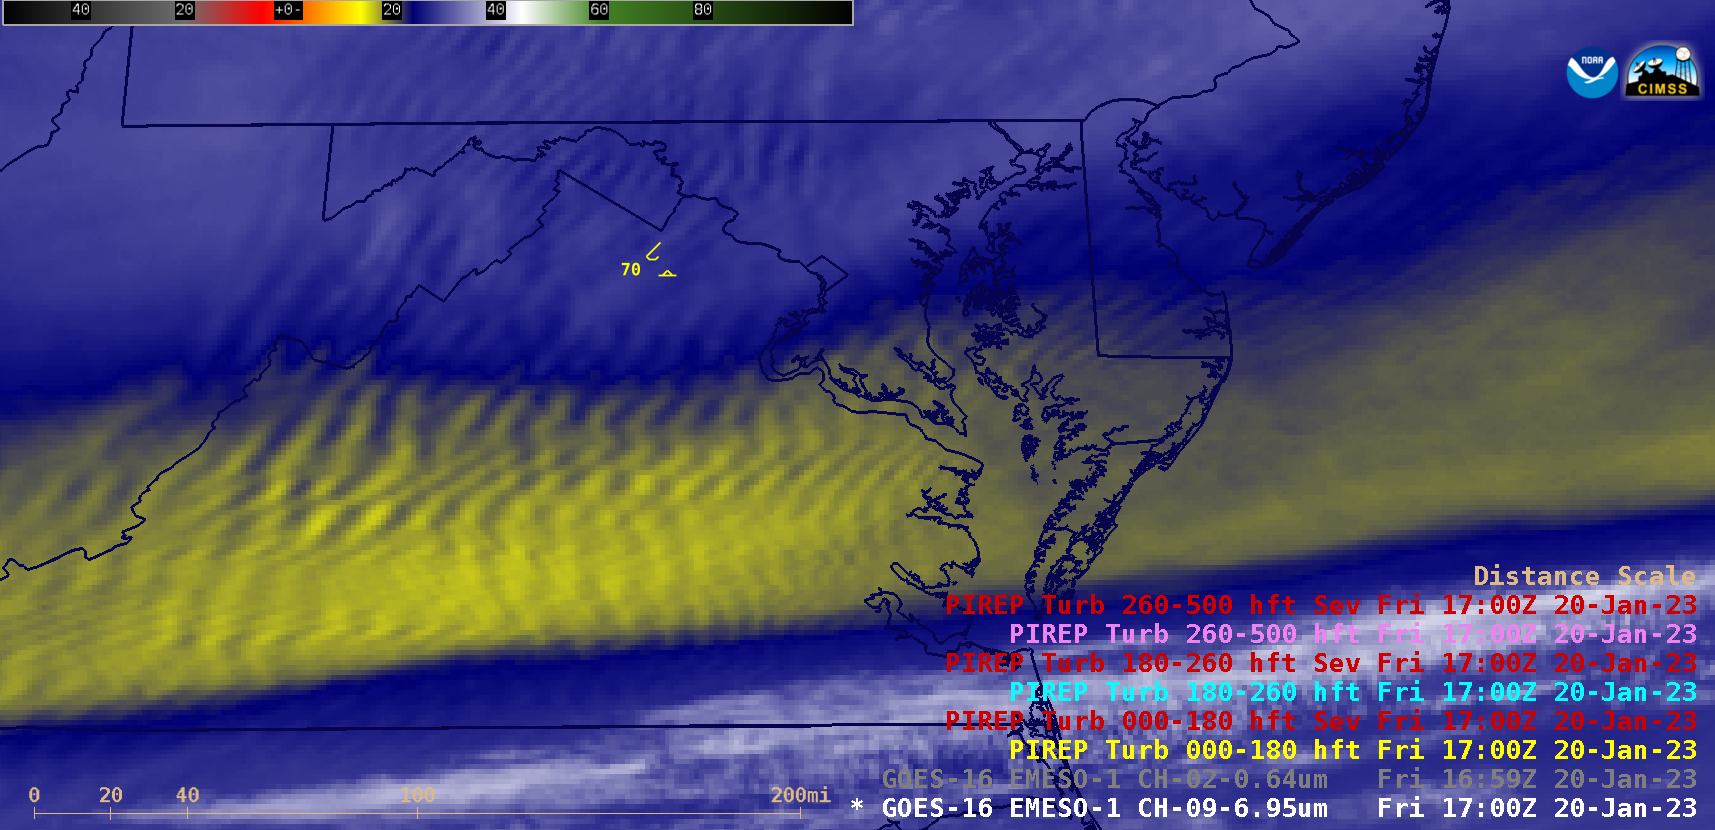
GOES-16 Mid-level Water Vapor (6.9 µm) images, with pilot report (PIREP) plots of turbulence [click to play MP4 | animated GIF]
The 1200 UTC Water Vapor image with plots of rawinsonde sites (below) indicated that Sterling, Virginia KLWX (which replaced the Washington-Dulles site KIAD) was located within the region of drier air where mountain waves were prevalent at that time.
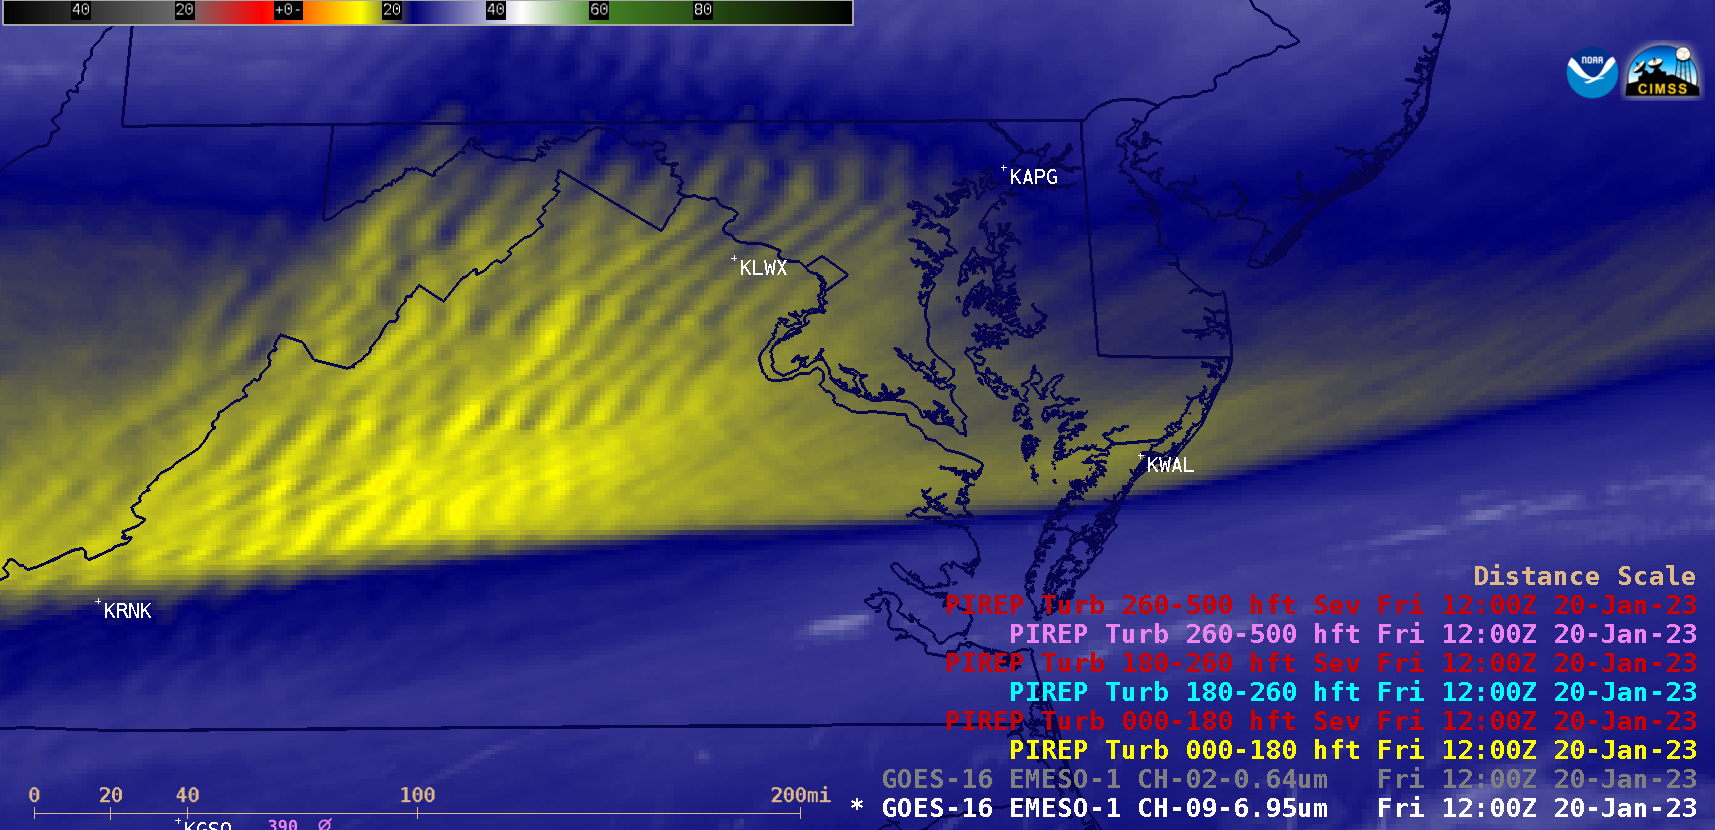
GOES-16 Mid-level Water Vapor (6.9 µm) image at 1200 UTC, showing the locations of rawinsonde sites [click to enlarge]
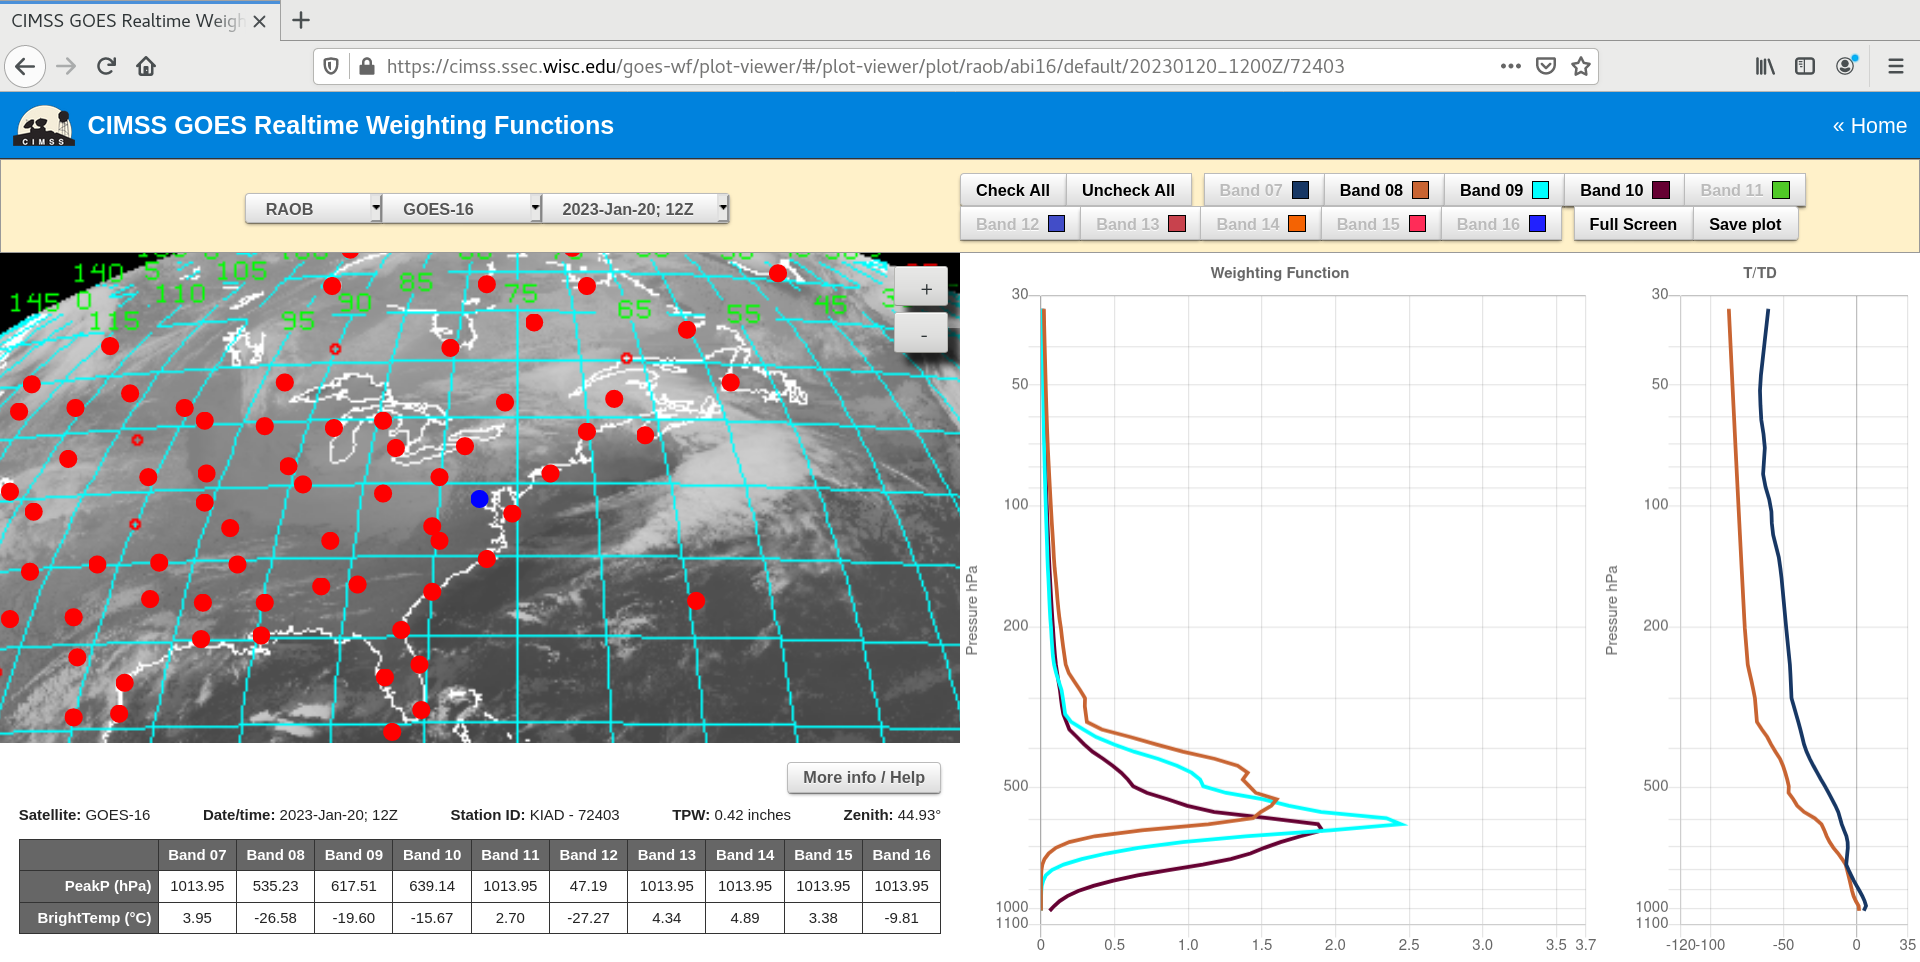
Plots of GOES-16 Water Vapor spectral band (08, 09 and 10) weighting functions, calculated using 1200 UTC rawinsonde data from Sterling, Virginia (KIAD) [click to enlarge]
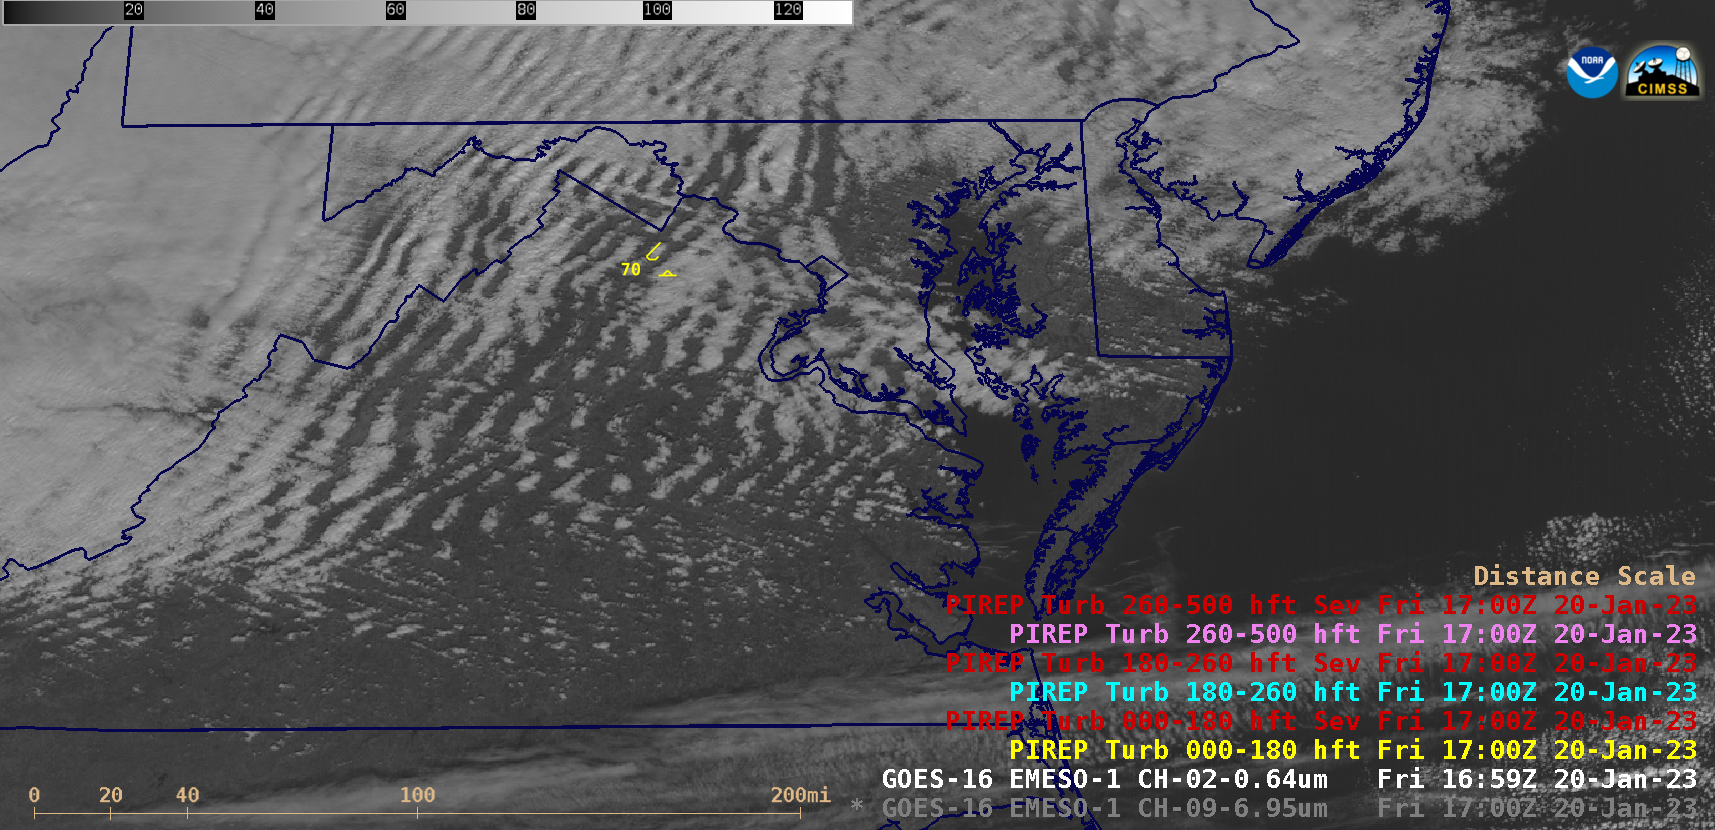
GOES-16 “Red” Visible (0.64 µm) images, with pilot report (PIREP) plots of turbulence [click to play MP4 | animated GIF]