SAR data views of the North Wall of the Gulf Stream

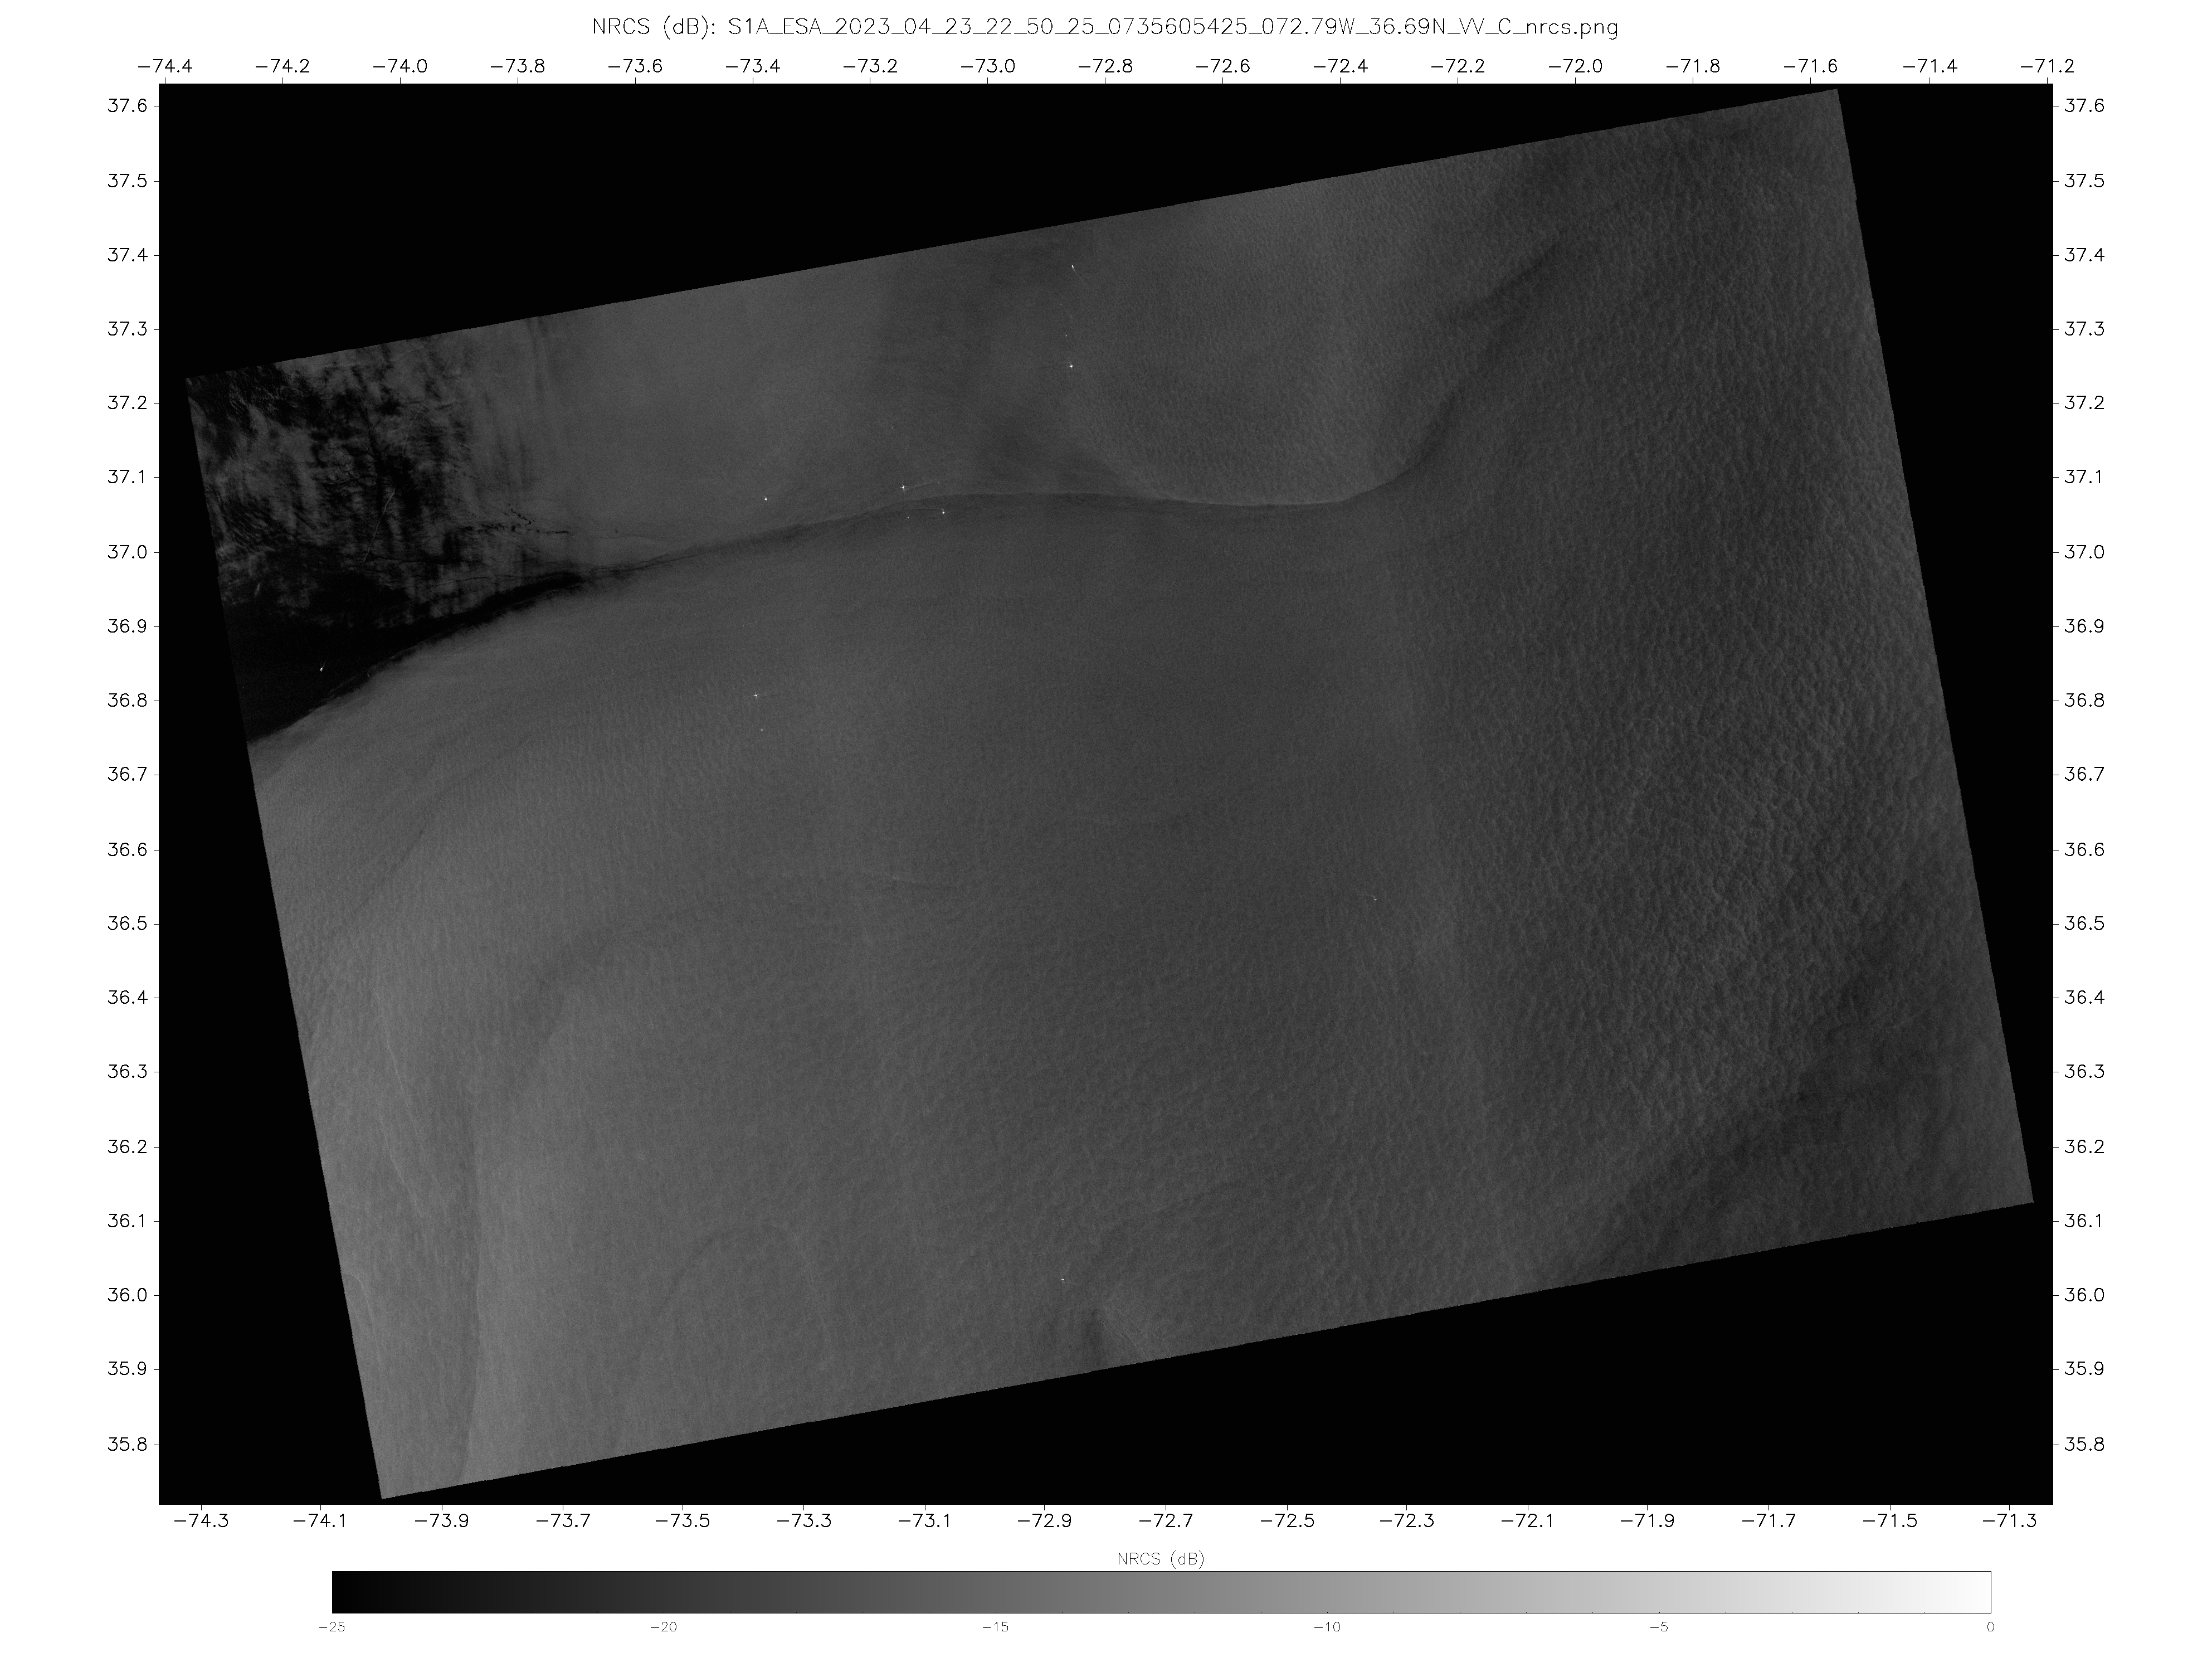
Sentinel-1A’s overpass just east of North Carolina right after sunset on 23 April 2023, above, shows a sharp delineation in wind speeds, with wind speeds at the western edge of the SAR winds dropping from around 8-9 knots (cyan enhancement) to 2-3 knots (magenta enhancement). The animation below includes the SAR footprints north and south of the footprint shown above — taken within 1 second of each other. There are multiple features in the SAR data that have underlying signals in the SST field. The warmth of the sea surface here is affecting the wind strength; stability changes will change the amount of vertical mixing after all. The North Wall is also apparent in the Normalized Radar Cross Section (NRCS) data (from this site).
The toggle below shows the SAR data overlain on top of GOES-16 Shortwave Infrared (Band 7, 3.9 µm) imagery. A cleaner view of the temperature gradients is apparent. The SST Level 2 product shown above is computed only in regions that are confidently cloud-free.

This European Space Agency SAR Data viewer will give you hours of SAR data viewing pleasure (in addition to this NOAA/STAR link!)