Cold air in the wake of a strong cold frontal boundary and dynamics associated with an intense shortwave trough aloft contributed to an outbreak of lake-effect snow and very strong winds over the Upper Peninsula (UP) of Michigan on 27 November 2007. AWIPS images of the GOES-12 6.5 µm “water vapor” channel... Read More
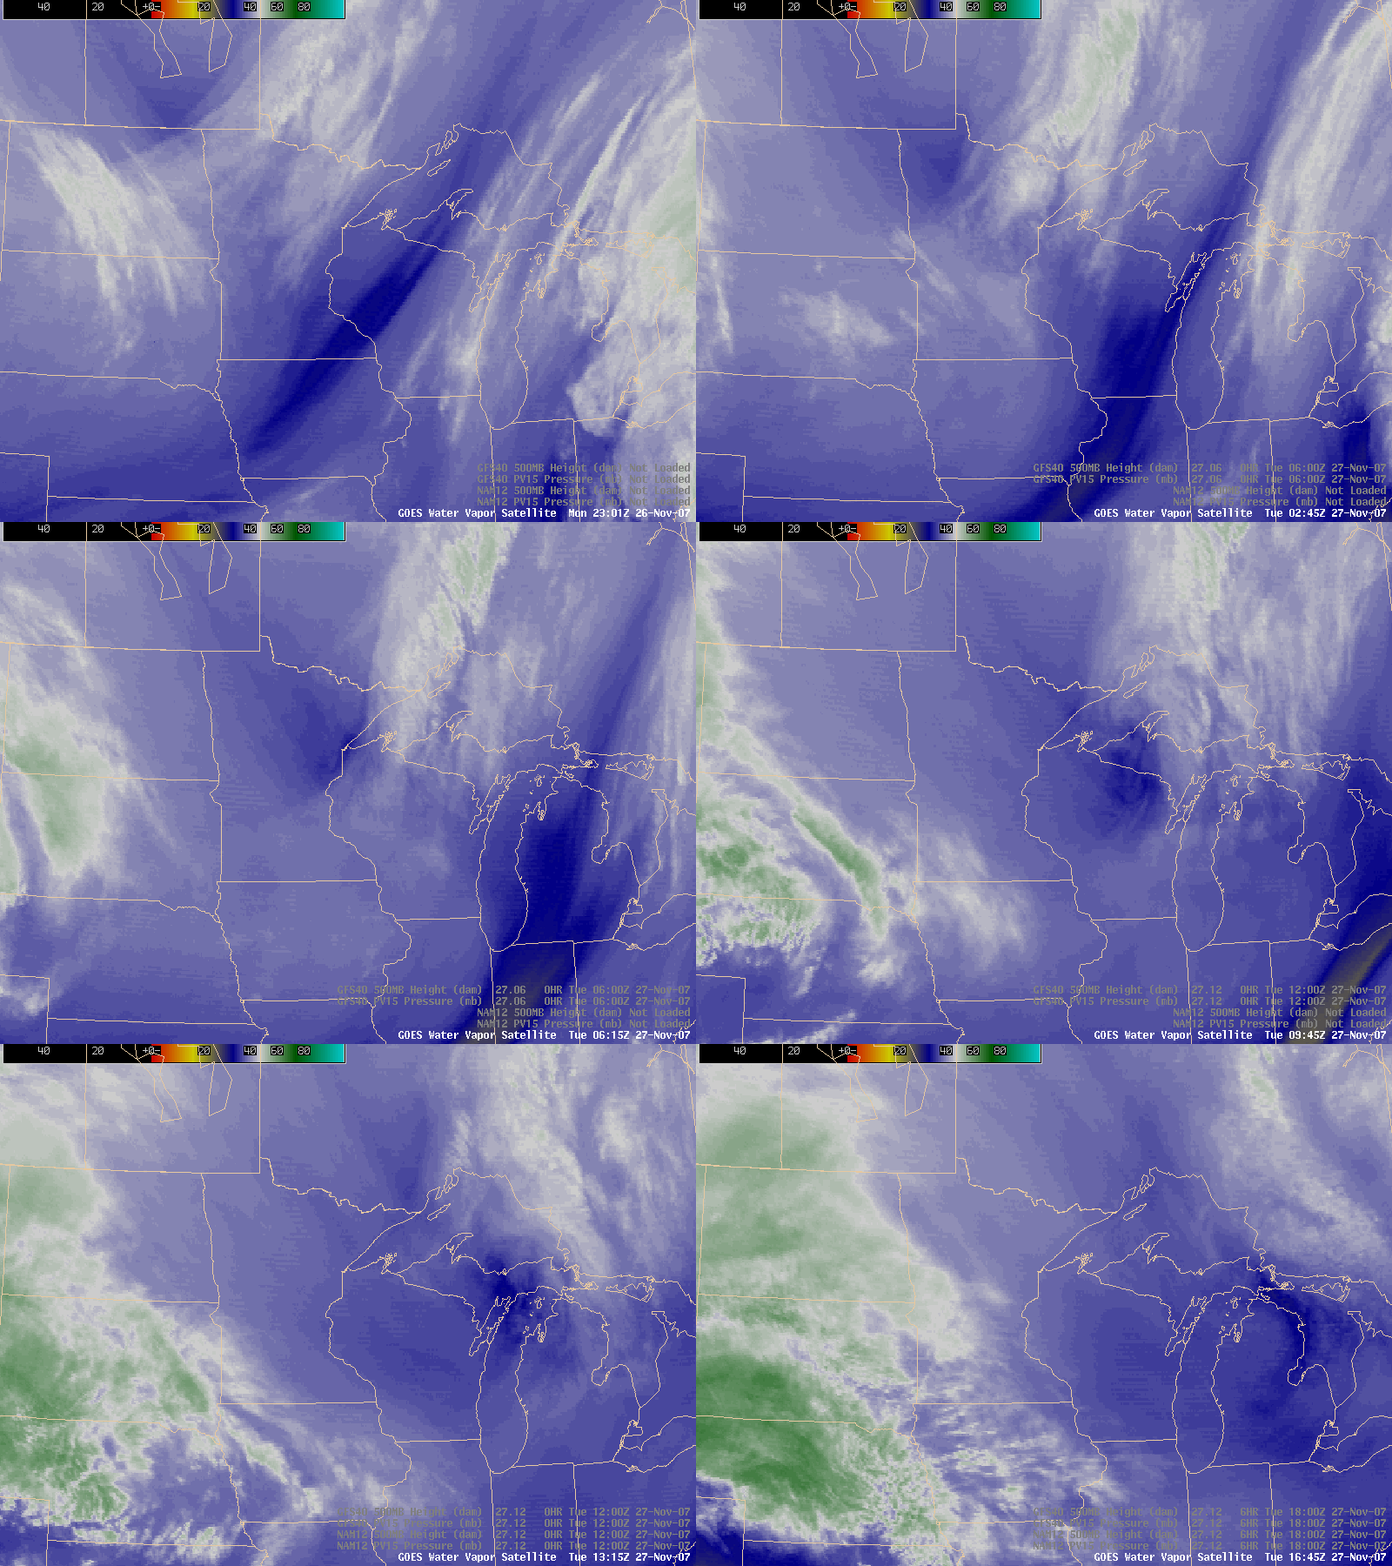
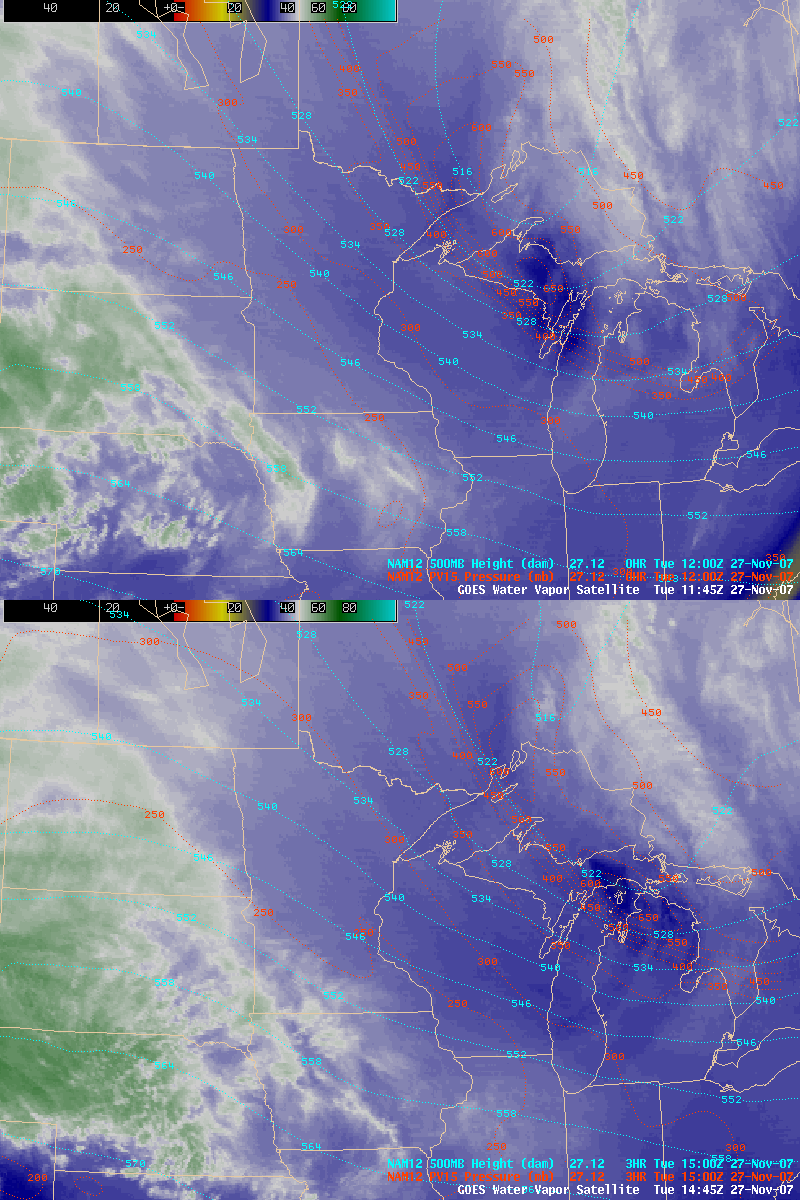
Cold air in the wake of a strong cold frontal boundary and dynamics associated with an intense shortwave trough aloft contributed to an outbreak of lake-effect snow and very strong winds over the Upper Peninsula (UP) of Michigan on 27 November 2007. AWIPS images of the GOES-12 6.5 µm “water vapor” channel (above) revealed a dynamic dry signature (darker blue enhancement) associated with a potential vorticity anomaly that was moving southeastward across northern Minnesota and the UP of Michigan. The dynamic tropopause — taken to be the pressure of the 1.5 Potential Vorticity Unit surface (below) — appeared to be as low as about 675 hPa in the vicinity of the dry water vapor image feature.
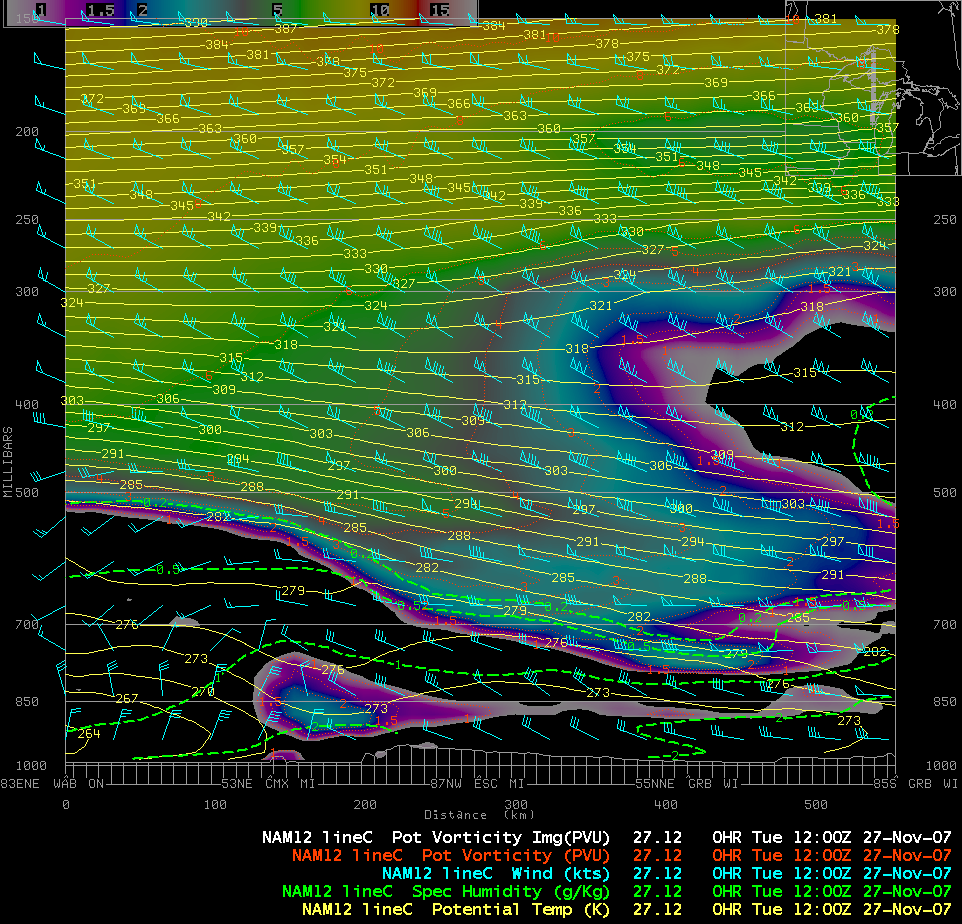
A north-to-south cross section using NAM12 model fields through the PV anomaly feature at 12 UTC (below) showed a well-defined tropopause fold over the UP of Michigan, with the dynamic tropopause actually extending downward to below the 700 hPa level.
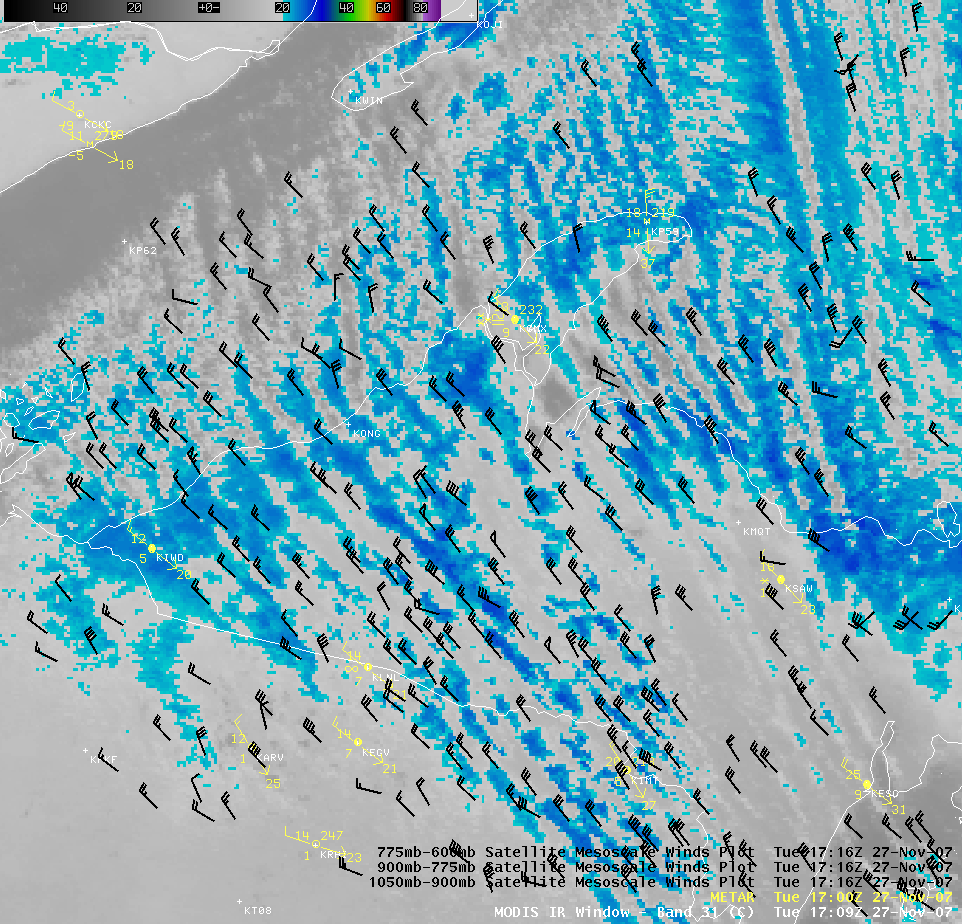
Surface wind speeds exceeded hurricane force over portions of the UP during the morning hours, with a gust to 71 mph at Copper Harbor at 6:50 AM (12:50 UTC) and a gust to 74 mph at Stannard Rock Lighthouse (on the Keweenaw Peninsula) at 9:00 AM (15:00 UTC). GOES mesoscale winds overlaid on the MODIS 11.0 µm “IR window channel” image at 17:09 UTC (below) indicated cloud-tracked wind speeds as high as 54 knots (62 mph) over the UP.
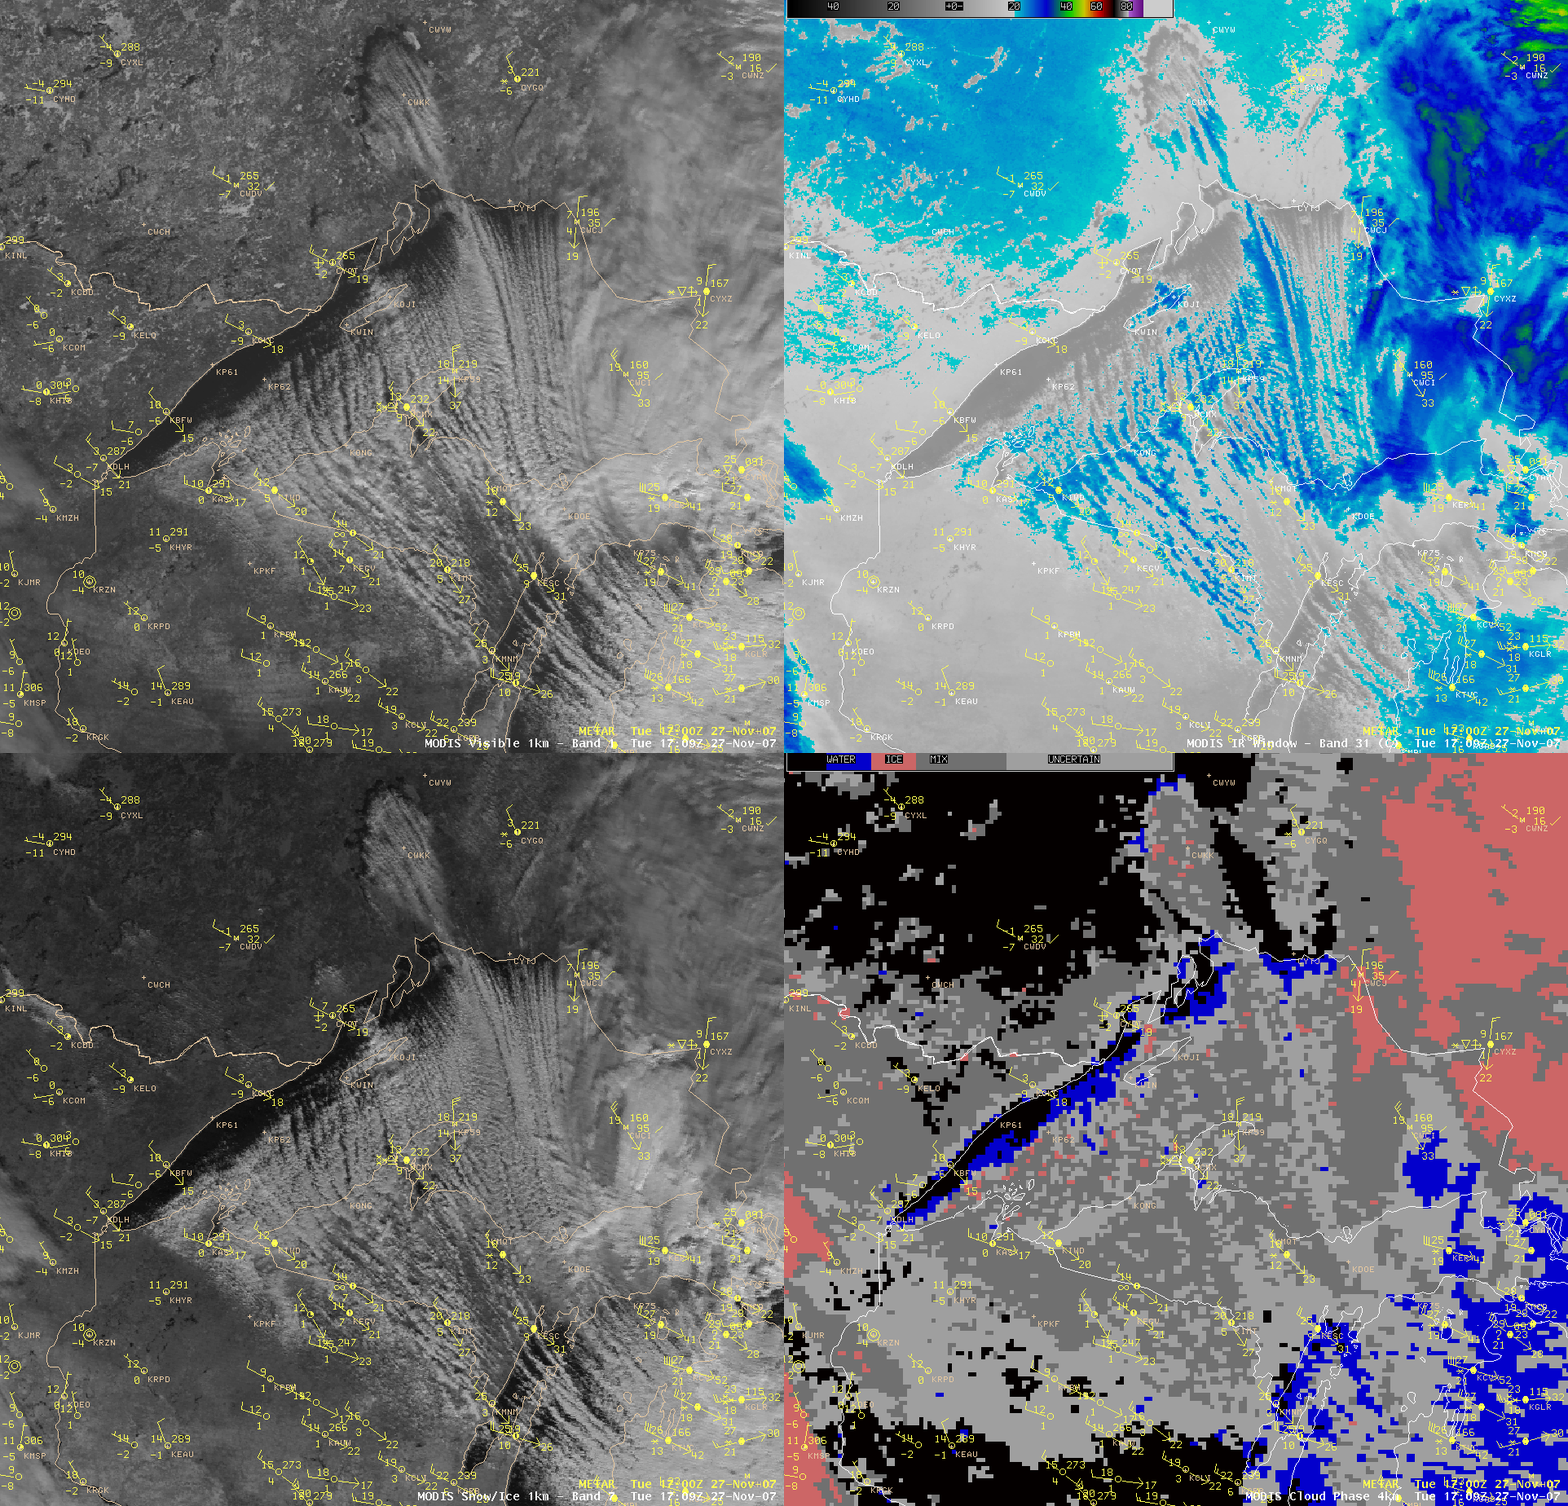
Looking at a comparison of a few MODIS images and products at 17:09 UTC (below), we can see that the visible channel showed the widespread lake-effect snow (LES) bands covering much of Lake Superior, extending southward across the UP and even over extreme northern Wisconsin and northern Lake Michigan; the IR window channel brightness temperatures along many of the LES bands were colder than -20ºC (light blue enhancement), suggesting that cloud particle glaciation may have begun; however, the LES bands exhibited a generally “bright” appearance on the near-IR “Snow/Ice” channel, leading one to suspect that the bands might still composed primarily of supercooled water droplets; finally, the Cloud Phase product indicated that the majority of the LES cloud features were likely of the “Mixed Phase” category (darker gray enhancement), so although LES band glaciation may not have been complete, many of the bands probably contained a good amount of ice crystals (which would be necessary for snow to fall at the surface).
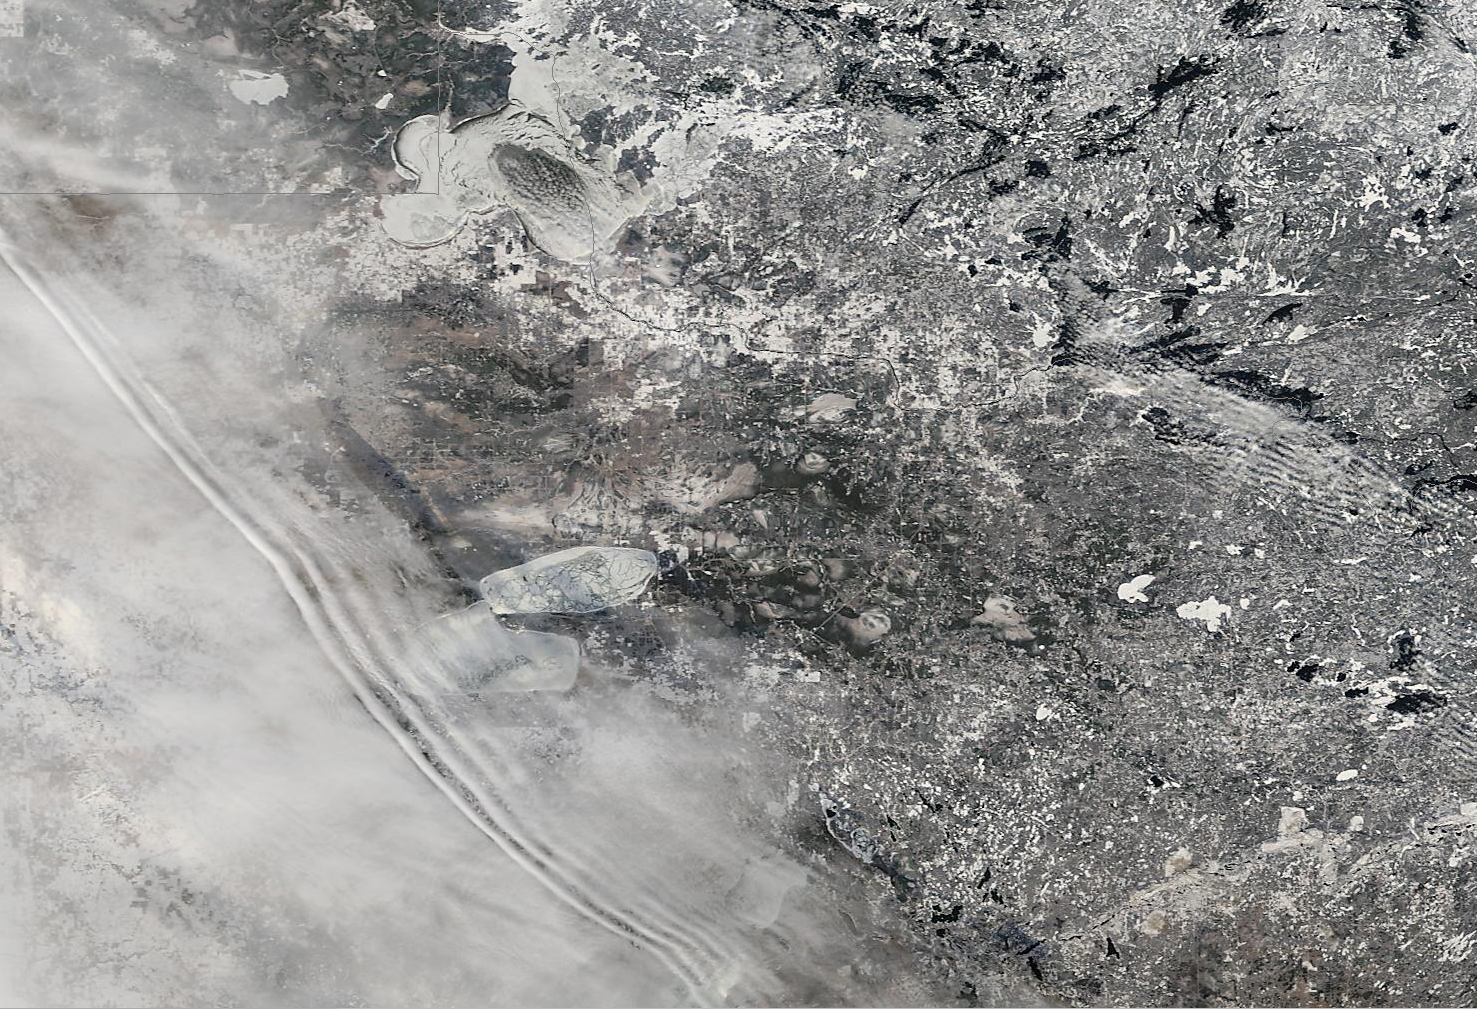
Finally, let’s take a closer look at the MODIS true color imagery over the surrounding region — some very interesting features are evident once we zoom in and take advantage of the 250-meter resolution of MODIS data using the SSEC MODIS Today website. A close-up view over northern Minnesota (below) reveals a long, narrow gravity wave feature along the leading edge of a thin cloud deck; also note that ice formation in Upper Red Lake (just northeast of the cloud edge and gravity wave structure) is well underway — not surprising, given that the air temperatures in that area were below 0º F (-18º C).
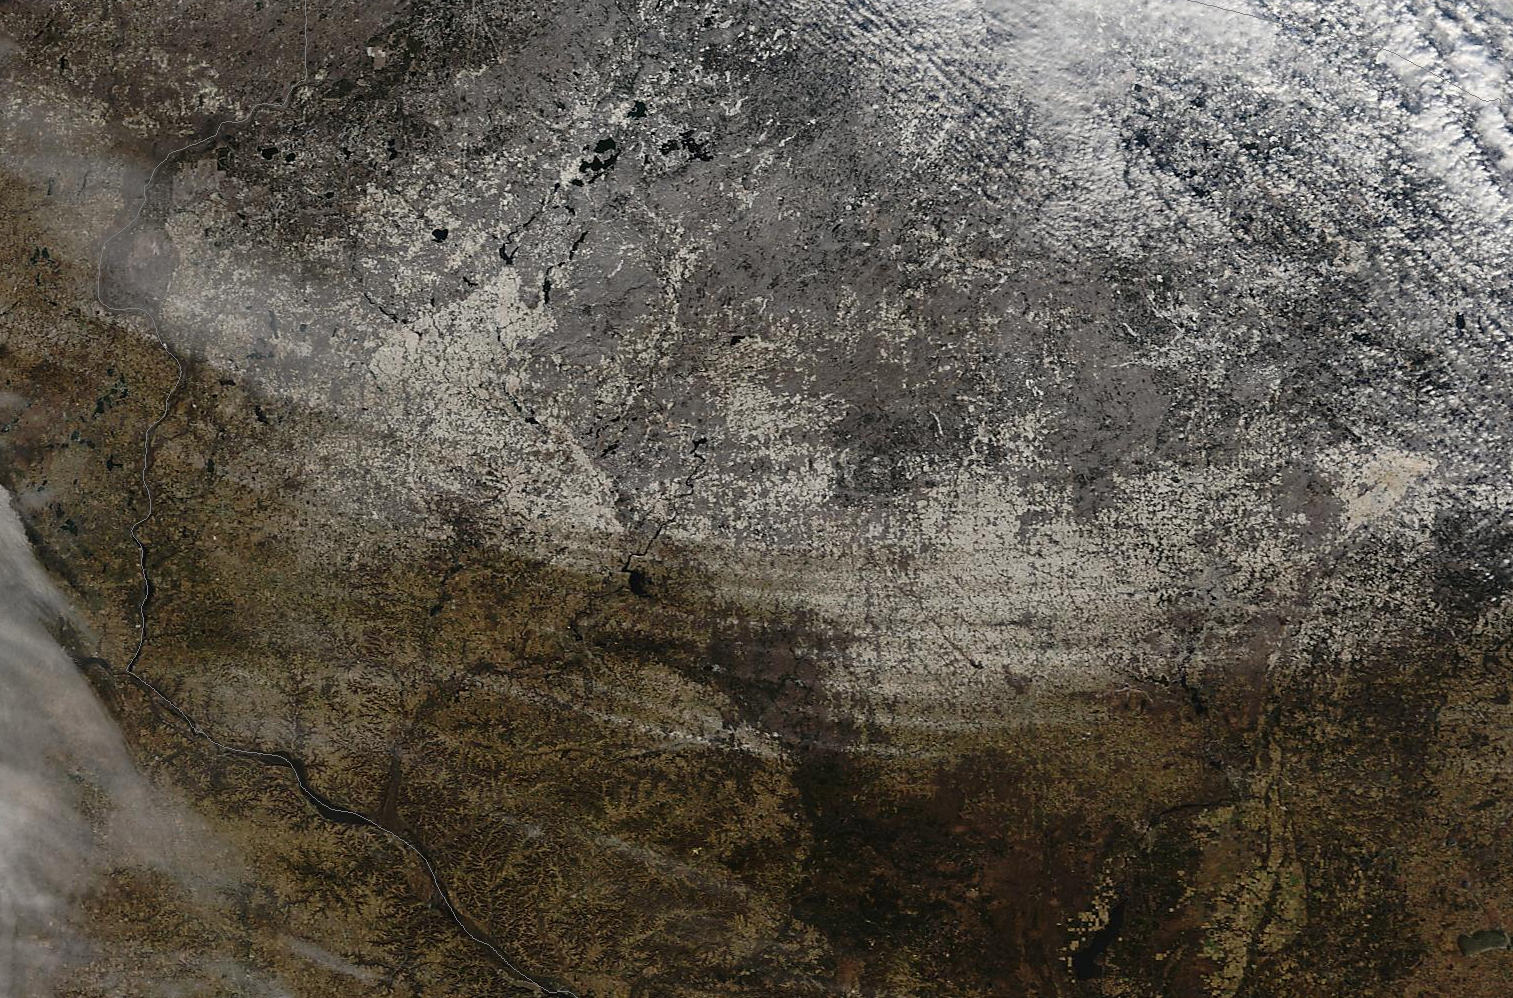
Farther to the southeast, a close-up view centered over central Wisconsin (below) shows the mesoscale “banded” nature of the snow on the ground over that area (especially along the southern periphery of the snow cover). The snow depth in these “streaks” was probably only about 1 inch or less (judging from the cooperative observer snow depth reports that were only a Trace across that particular region), but the snow streaks really stood out against the surrounding areas of bare ground. Such mesoscale “snow steaks” are not uncommon to see on satellite imagery following “light” snowfall events — these satellite signatures help to underscore the difficulty in forecasting snowfall accumulation amounts over any given location.
View only this post
Read Less