This website works best with a newer web browser such as Chrome, Firefox, Safari or Microsoft
Edge. Internet Explorer is not supported by this website.
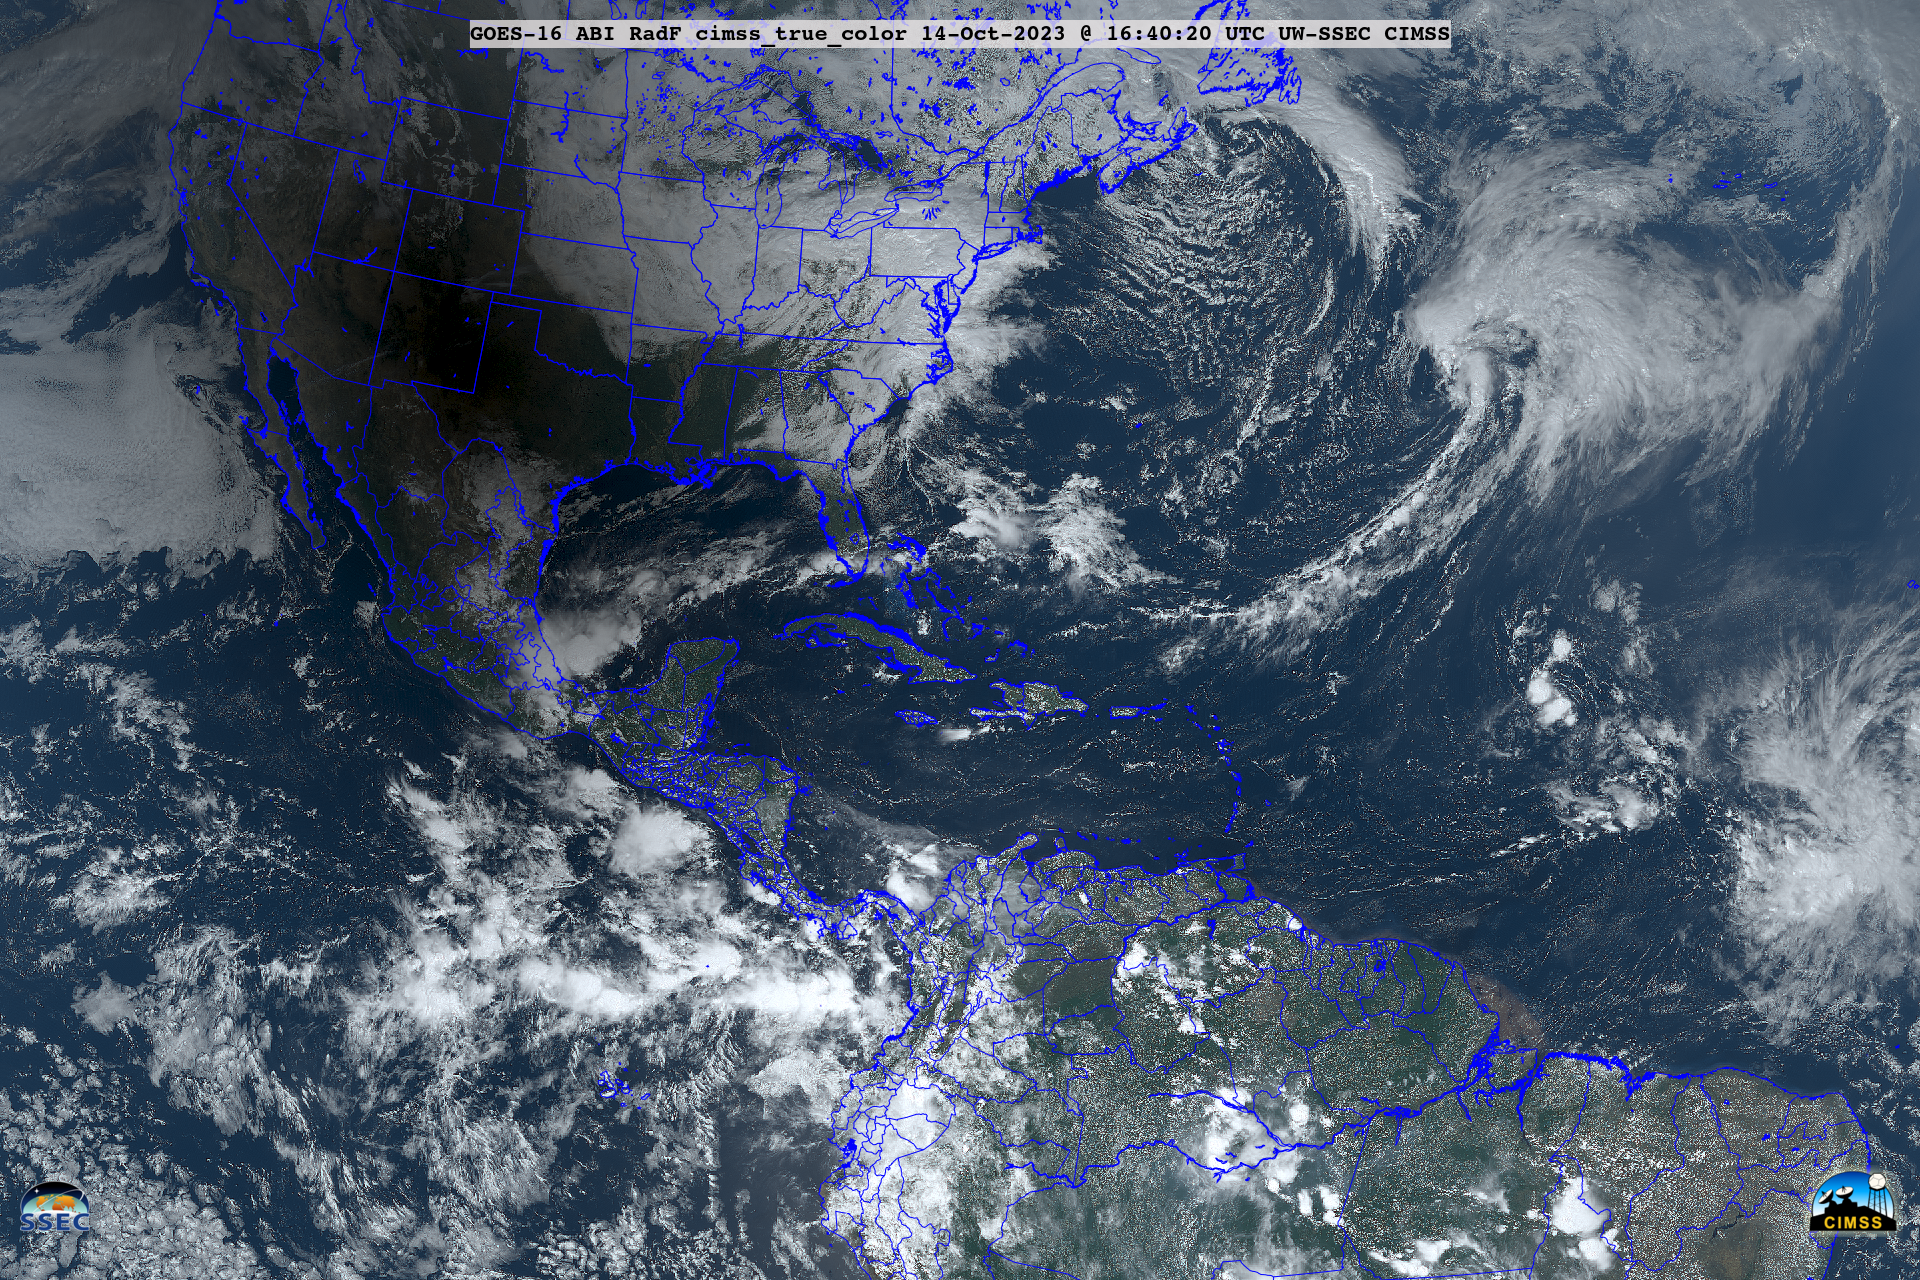
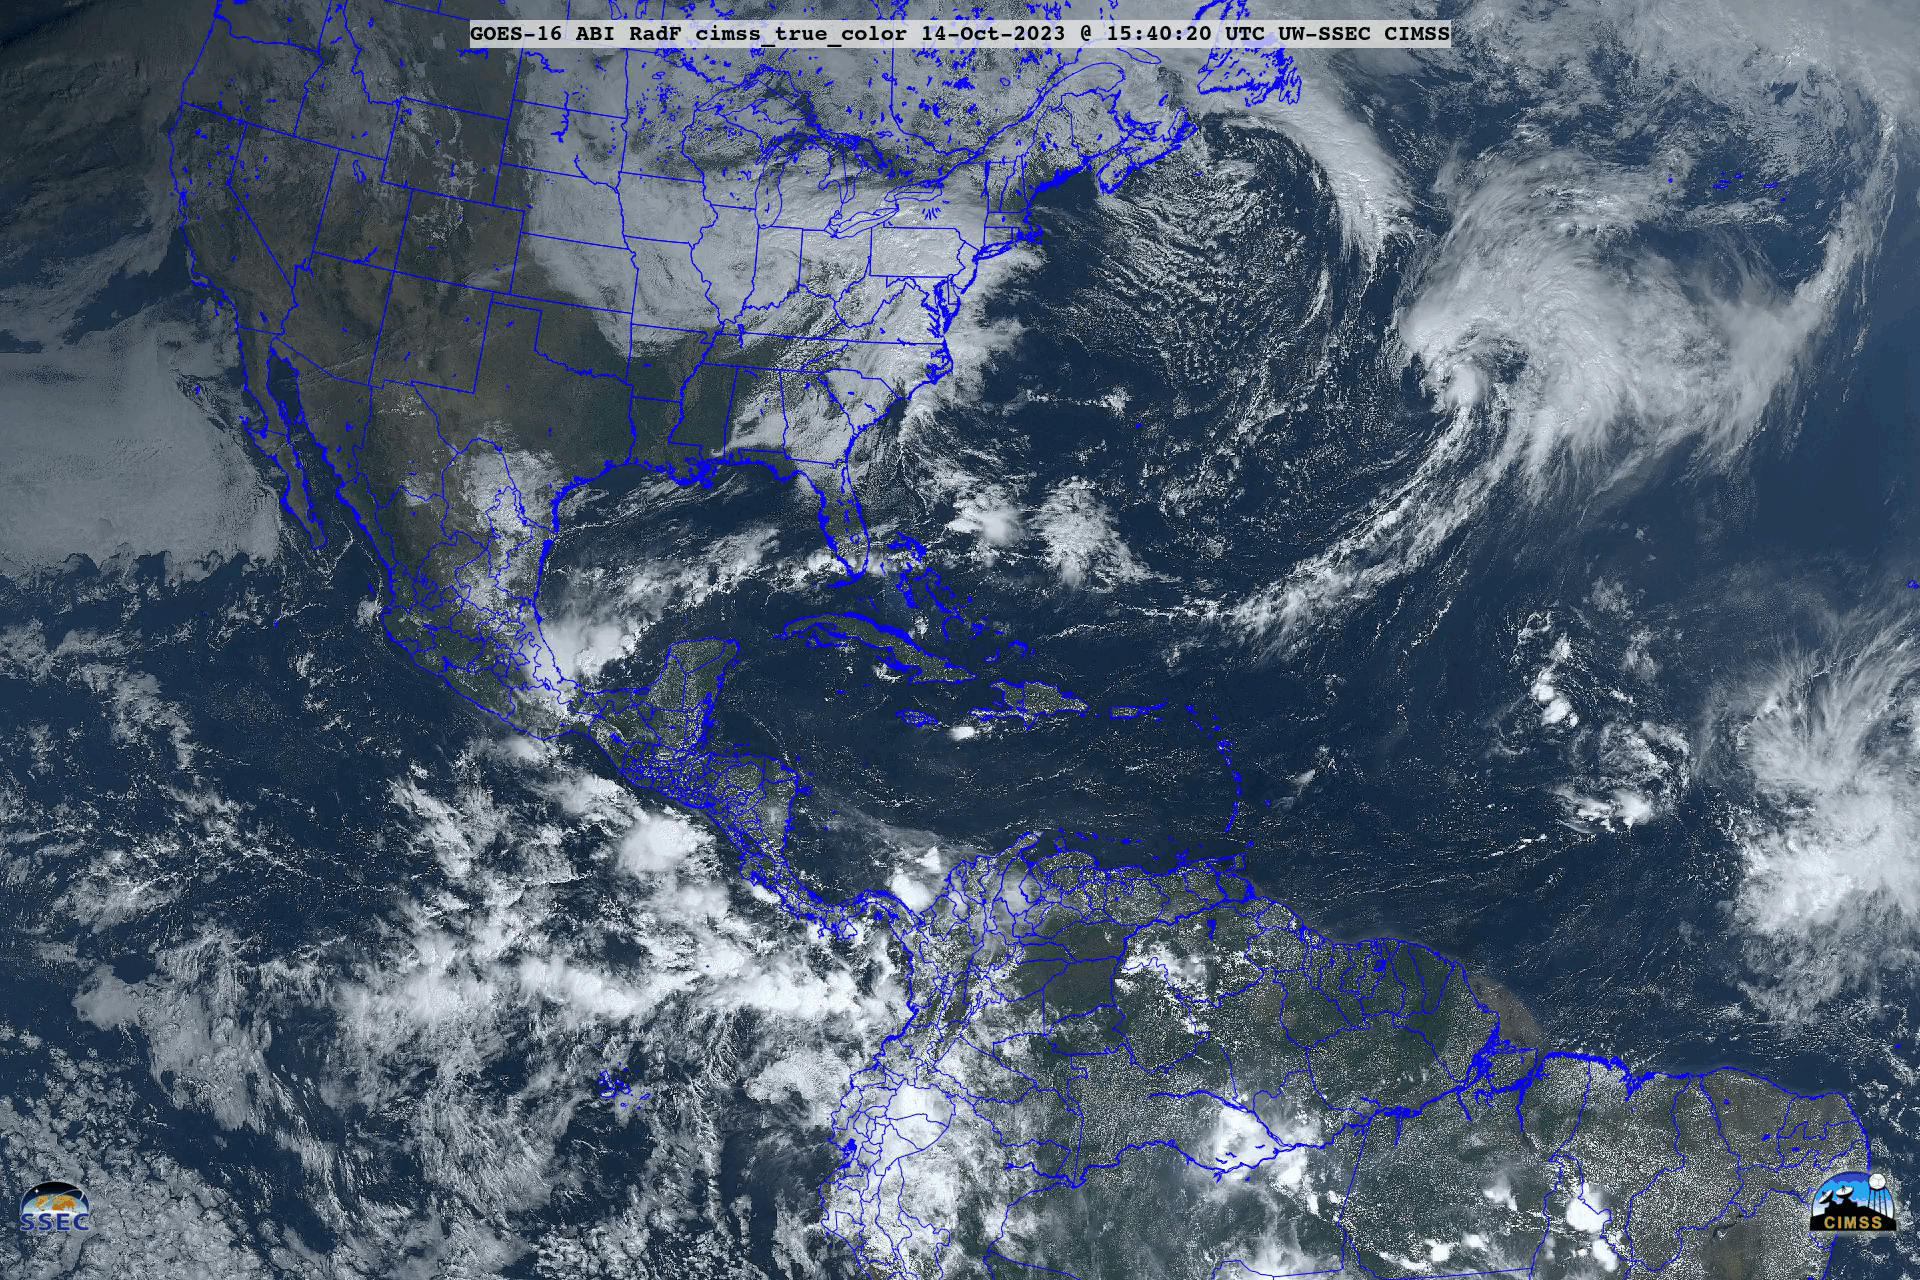
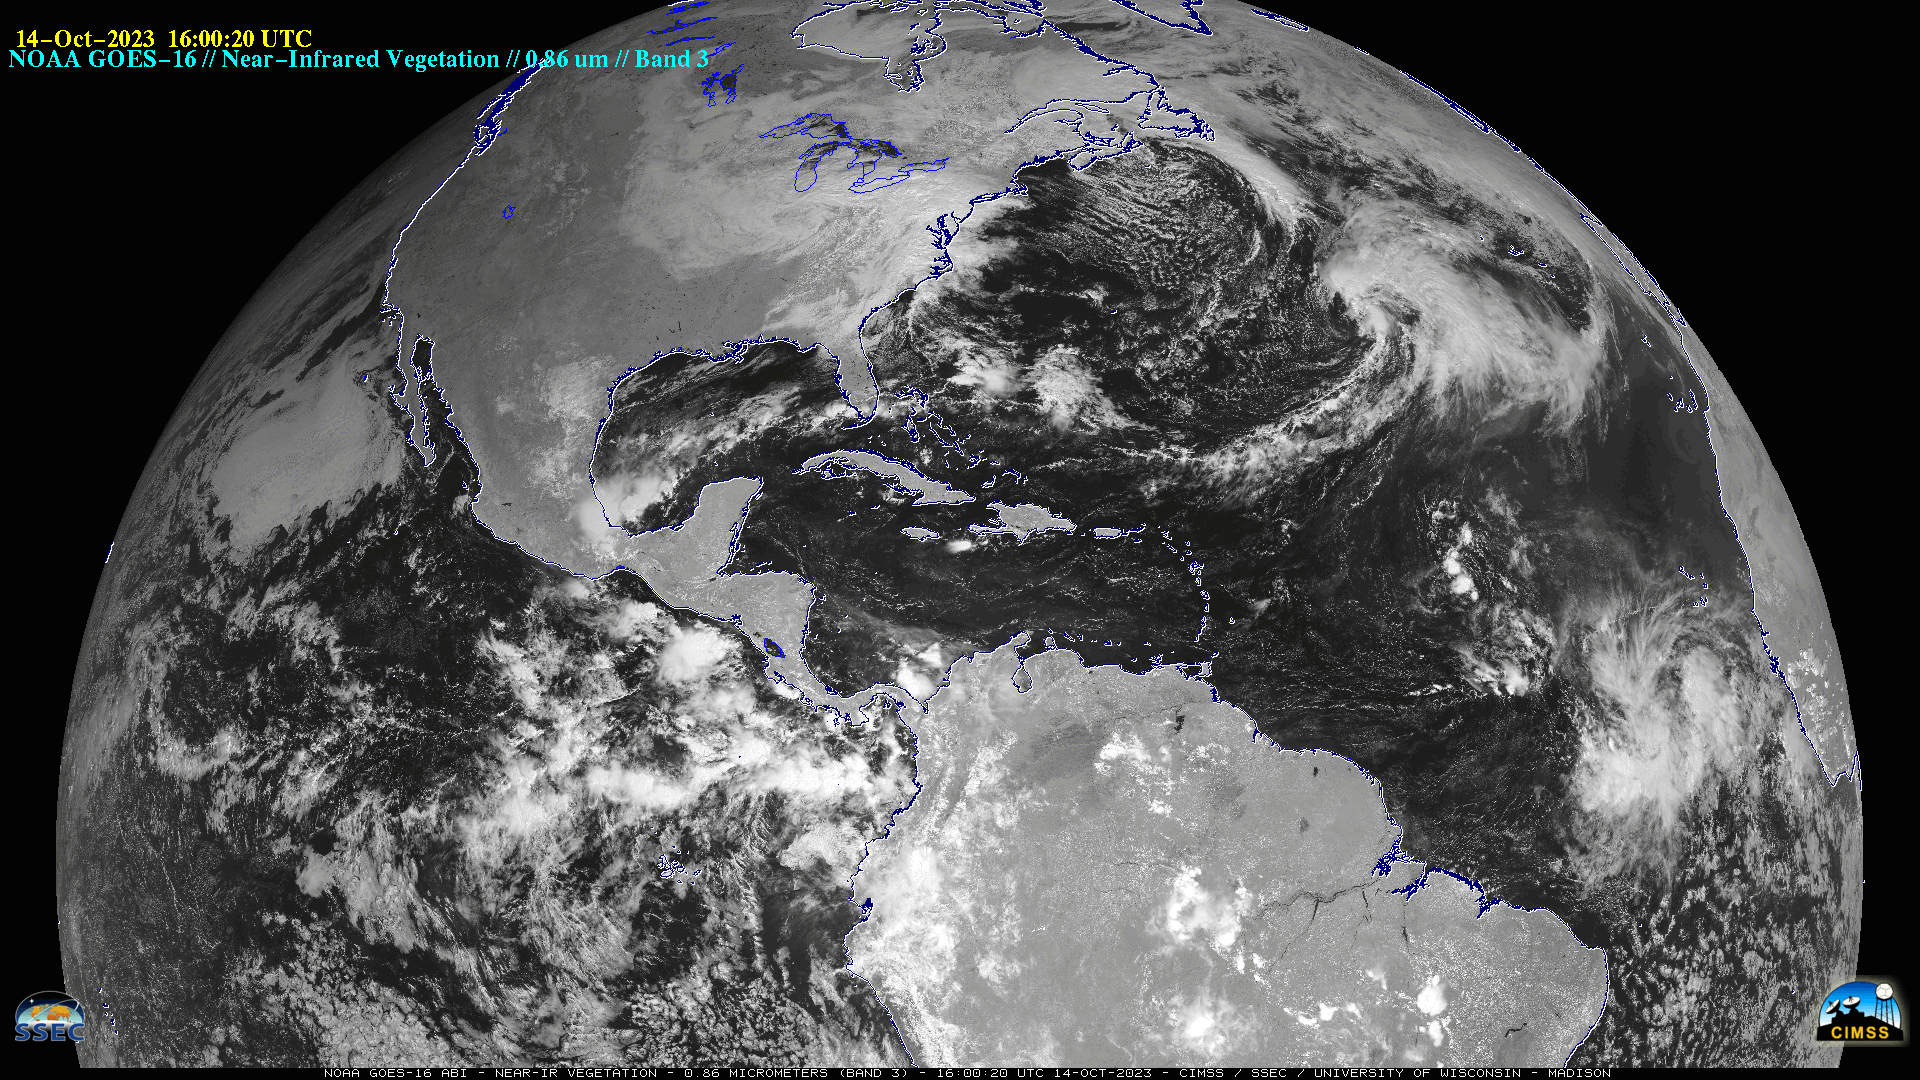
10-minute Full Disk GOES-16 (GOES-East) CIMSS Natural True Color RGB images created using Geo2Grid (above) showed the 2023 Annular Solar Eclipse shadow as it progressed southeastward from the Pacific Northwest to Brazil on 14 October 2023.GOES-16 Near-Infrared “Vegetation” (0.86 µm) images — in the native projection of the GOES-16 satellite (below) — provided another view of the eclipse... Read More
GOES-16 CIMSS Natural True Color RGB images [click to play animated GIF | MP4]
GOES-16 Near-Infrared “Vegetation” (0.86 µm) images — in the native projection of the GOES-16 satellite (below) — provided another view of the eclipse shadow path.
GOES-16 Near-Infrared “Vegetation” (0.86 µm) images [click to play animated GIF | MP4]
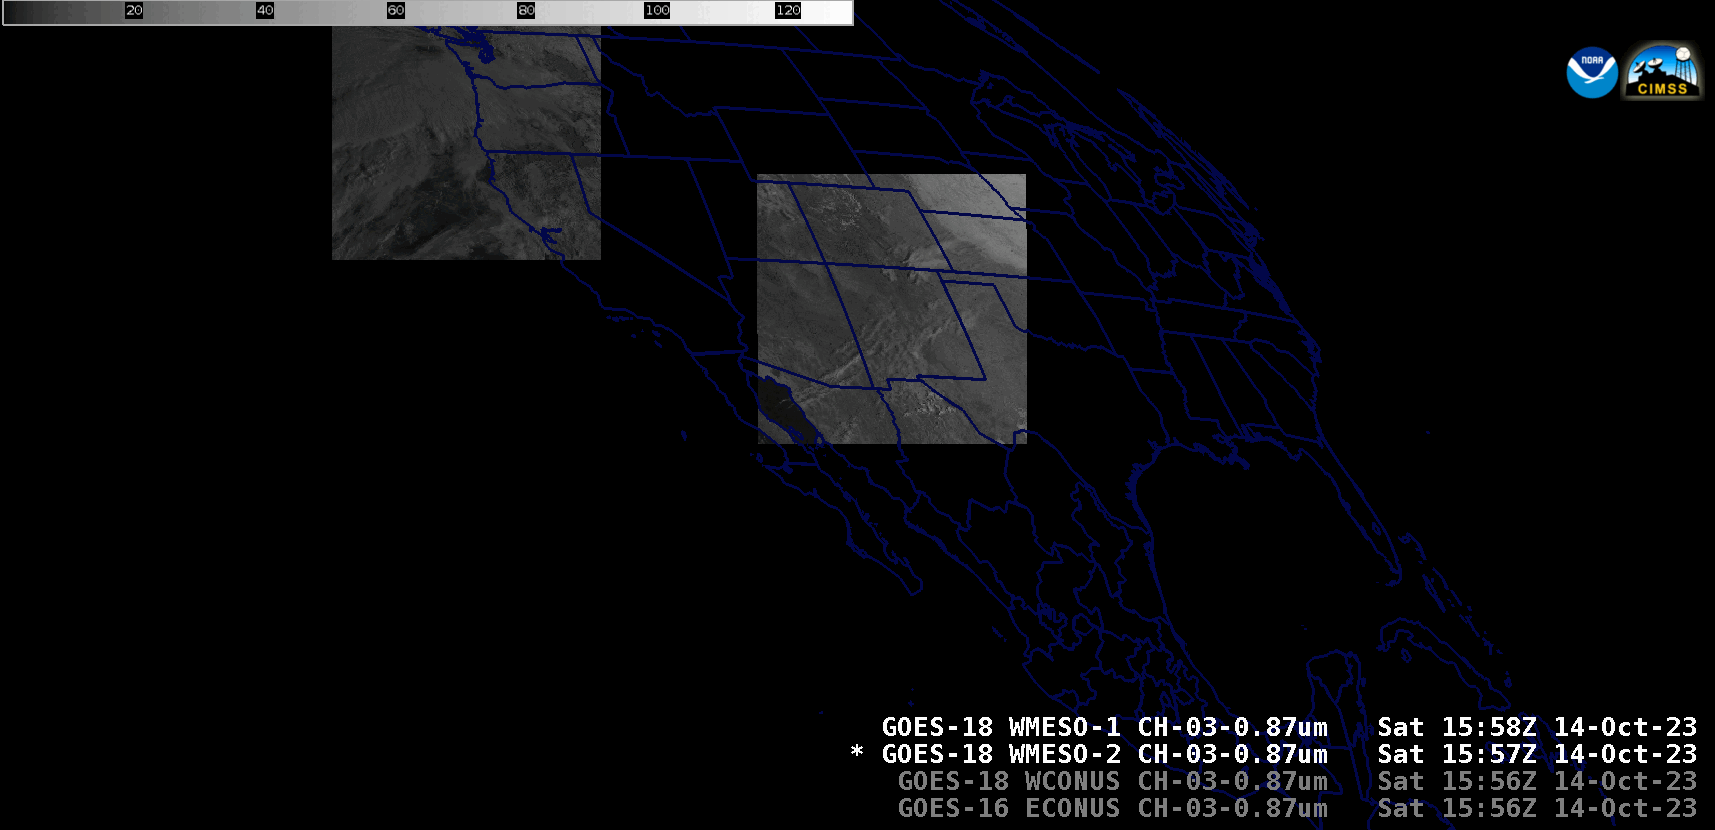
A staggered set of three Mesoscale Domain Sectors from GOES-18 (GOES-West) provided 1-minute imagery of the eclipse shadow progression (below).
1-minute GOES-18 Mesoscale Domain Sector images, displayed individually and superimposed upon 5-minute GOES-18/GOES-16 CONUS Sector images [click to play animated GIF | MP4]
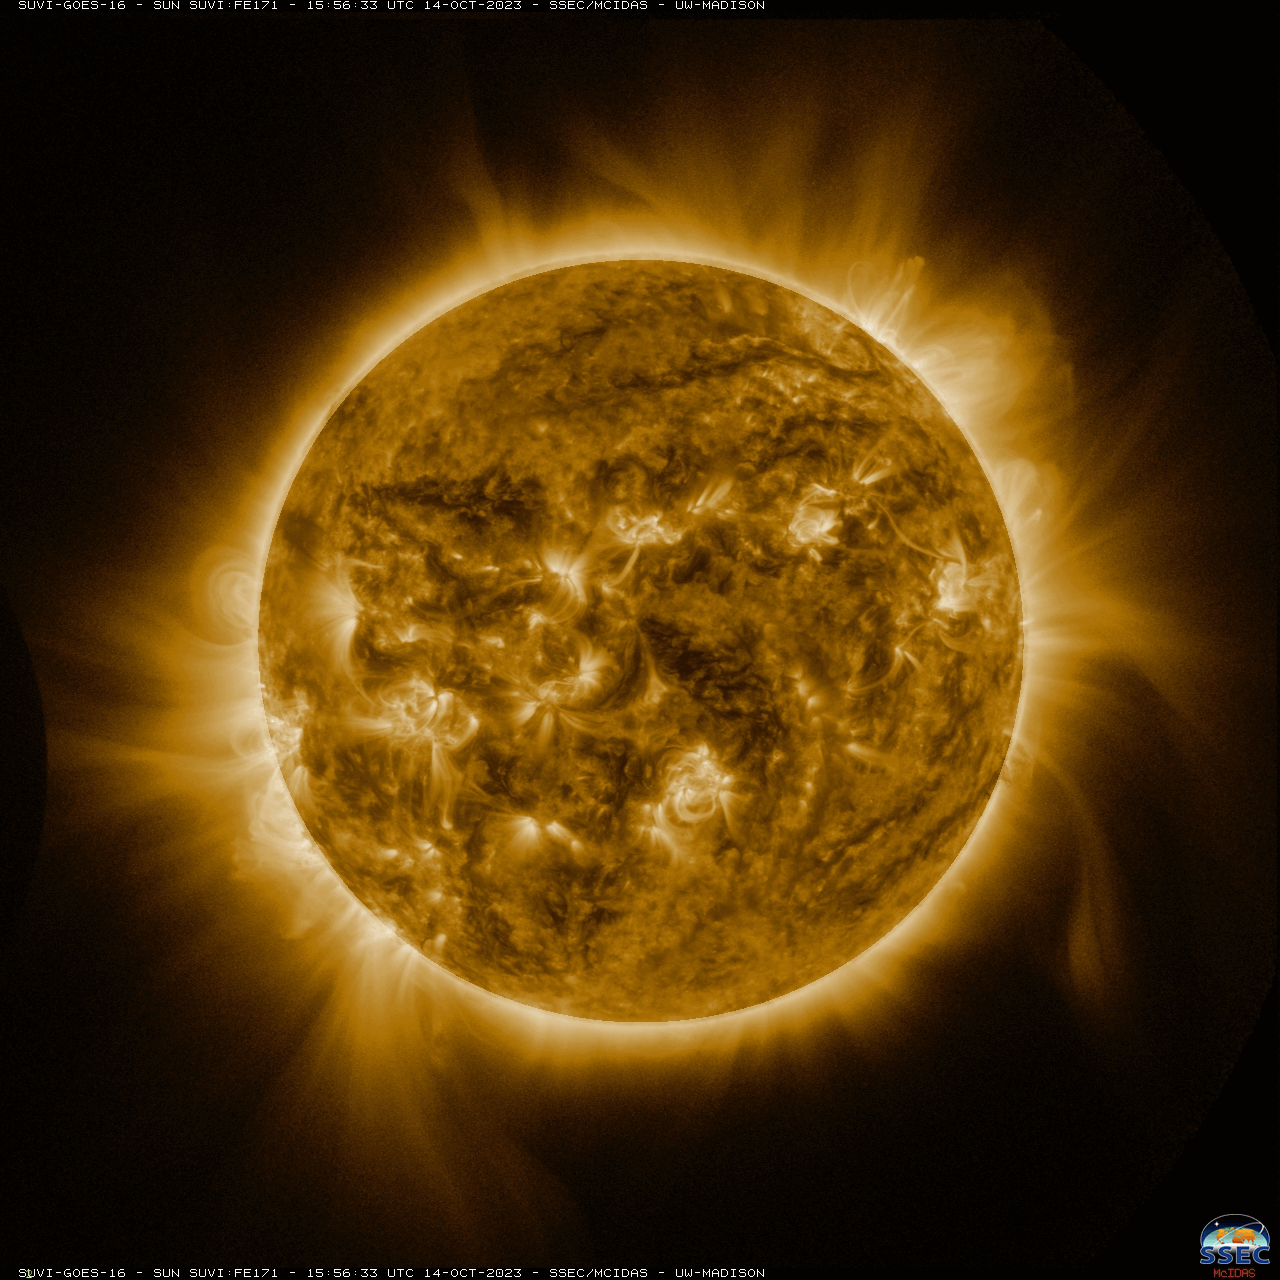
GOES-16 SUVI Fe171 images from the SSEC Geostationary Satellite Imagery site (below) showed the Moon’s silhouette as it passed in front of the Sun during the eclipse period.
GOES-16 SUVI Fe171 (171 Å) images [click to play animated GIF]
Tropical Storm Sean has developed in the mid-Atlantic and is moving northwest, but is predicted to dissipate by Sunday, 2023-10-15. RealEarth provides an opportunity to look back at the last 48 hours of Sean developing. A video from RealEarth shows GOES-16 true color and Band 13 (10.3 microns, “clean” infrared... Read More
Tropical Storm Sean has developed in the mid-Atlantic and is moving northwest, but is predicted to dissipate by Sunday, 2023-10-15. RealEarth provides an opportunity to look back at the last 48 hours of Sean developing. A video from RealEarth shows GOES-16 true color and Band 13 (10.3 microns, “clean” infrared band) from 2023-10-11 at 1525Z to 2023-10-13 at 1525Z. While signs of convection are apparent on 2023-10-12, the storm structure appears dissipated by the daylight hours of 2023-10-13 when viewing at these wavelengths.
Tropical Storm Sean is located in the Atlantic, about halfway between the outer Caribbean and West Africa. Viewers can recreate this animation using RealEarth.
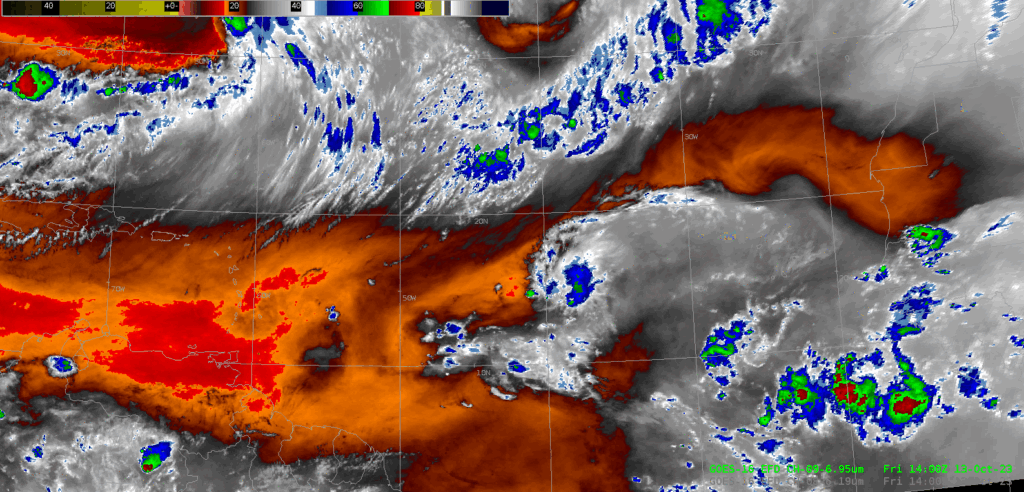
Investigating the finer details of Sean on 2023-10-13, Band 9 (6.95 microns, mid-level water vapor) is examined. A storm structure is hardly noticeable. What stands out in the Atlantic even more in the Band 9 animation is an unnamed disturbance to the East of Sean. (These are the red areas in the Band 9 animation.) The National Hurricane Center predicts this system of having a 10% chance of forming a cyclone in the next 48 hours.
Viewing Sean using GOES-16 Band 9. This animation was created in AWIPS.
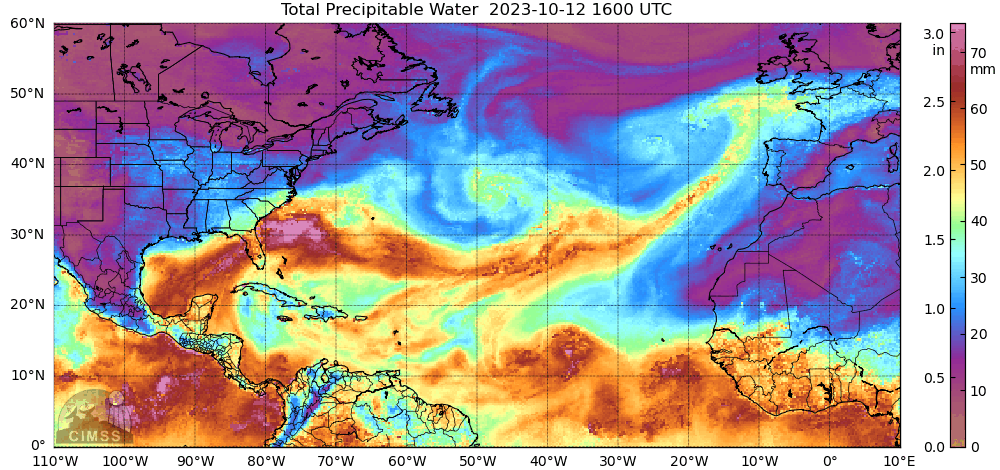
The MIMIC Total Precipitable Water product, below, provides a look back at the last 24 hours of their TPW field. When examining TPW, a more cyclonic structure appears. The TPW field seems to show some actual rotation in Sean, which is harder to notice in the GOES animations.
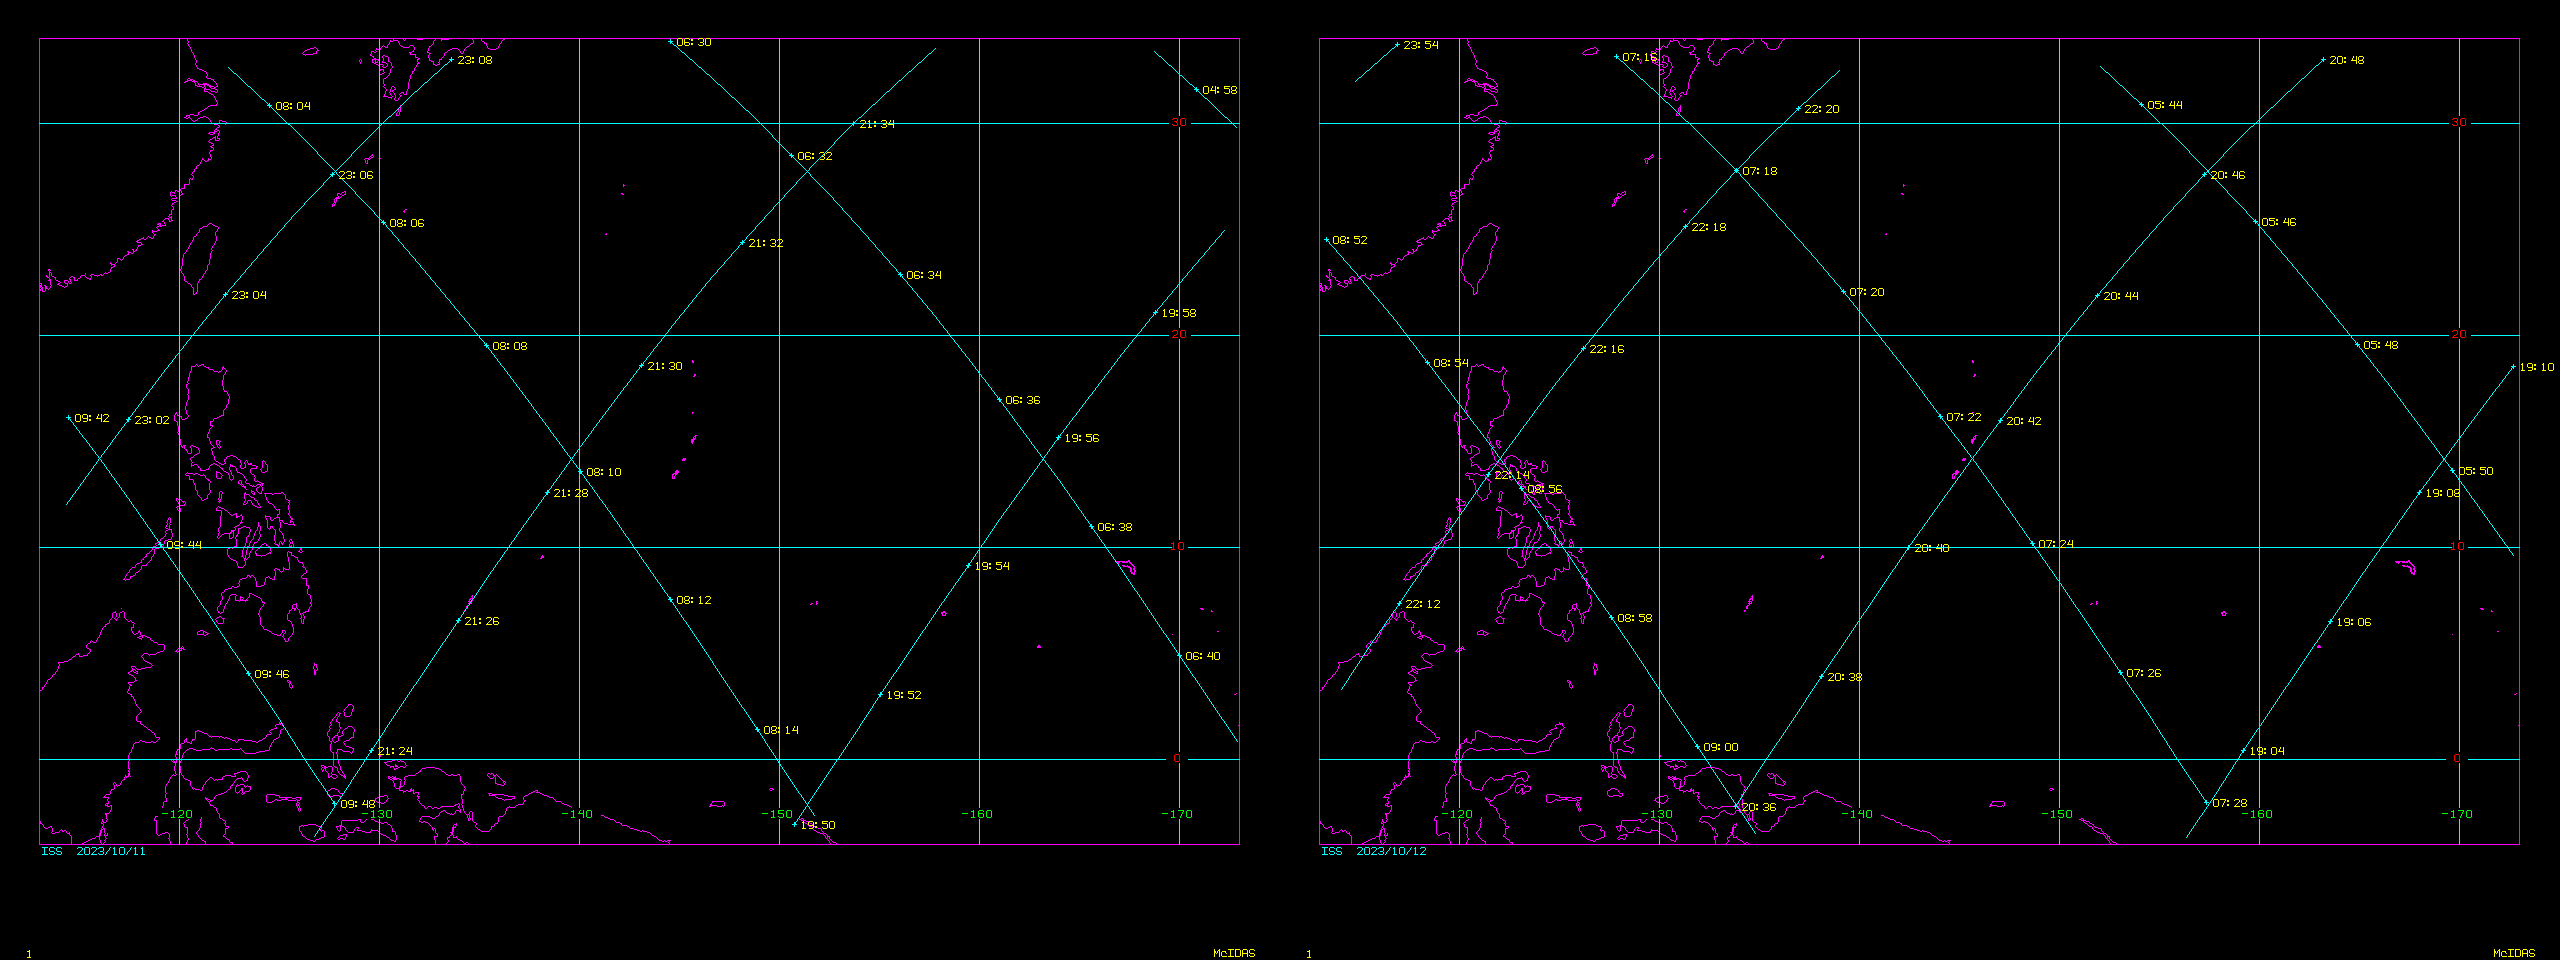
The Lightning Imaging Sensor (LIS) has been flying on the International Space Station since 2017 to extend LIS observations that began with the Tropical Rainfall Measurement Mission (TRMM). This provides for nearly global observations optical detection of lightning. On 11 October and 12 October, two passes of the LIS, shown below, observed Typhoon Bolaven: the ascending pass from 2124 to 2134 UTC on... Read More
The Lightning Imaging Sensor (LIS) has been flying on the International Space Station since 2017 to extend LIS observations that began with the Tropical Rainfall Measurement Mission (TRMM). This provides for nearly global observations optical detection of lightning. On 11 October and 12 October, two passes of the LIS, shown below, observed Typhoon Bolaven: the ascending pass from 2124 to 2134 UTC on 11 October, and the descending pass from 0716 to 0728 UTC on 12 October. What kind of lightning was observed and where was it observed in relation to the Typhoon?
LIS Orbit plots on 11 October (left) and 12 October (right) 2023 (Click to enlarge)
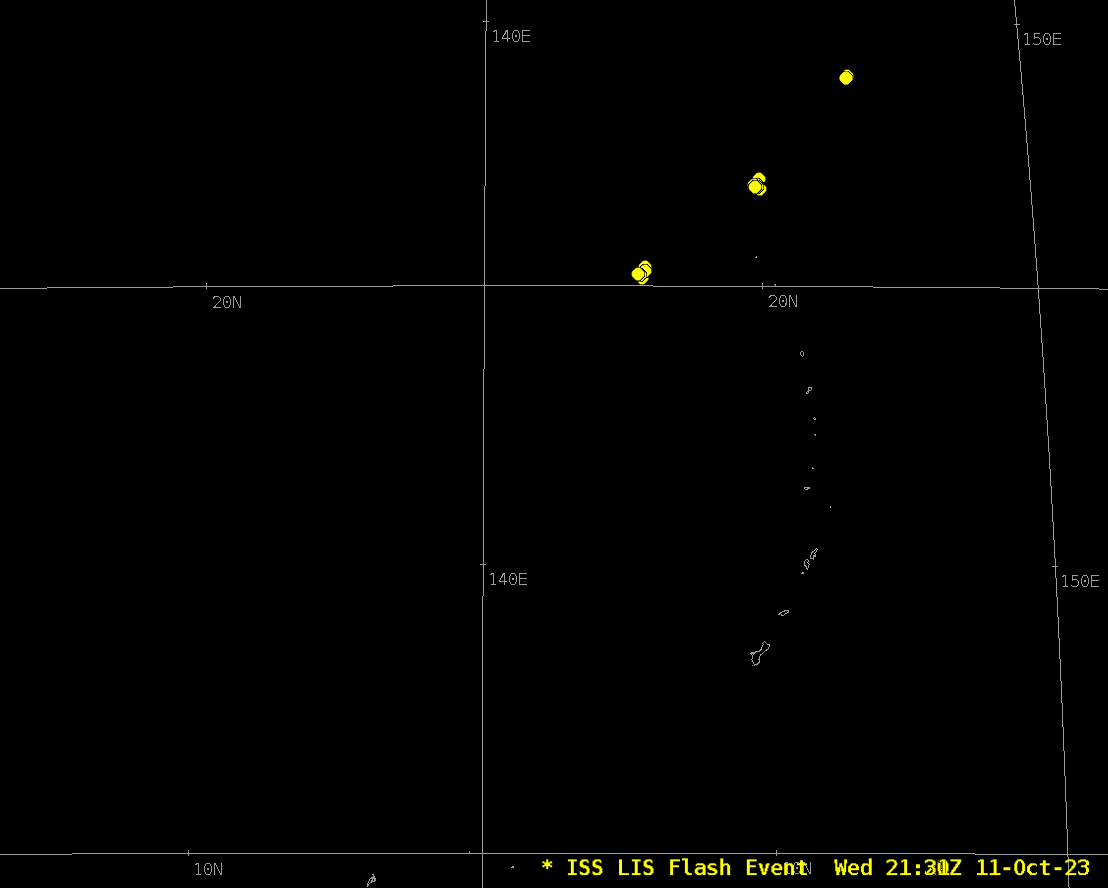
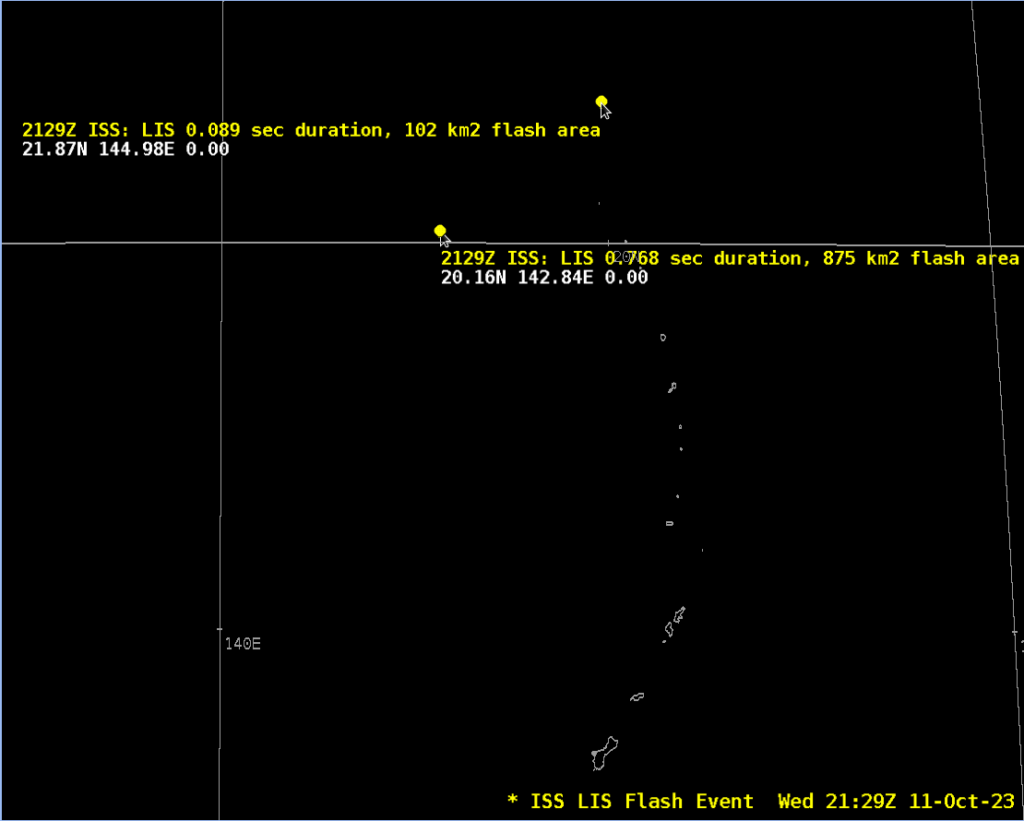
The observations at ca. 2130 UTC on 11 October 2023 are overlain on the AWIPS plot below. Three separate groups are apparent, and we’ll focus on the two more southerly clusters that include 23 separate flash observations.
22 Individual LIS Flash events, 2129-2130 UTC on 11 October 2023 (Click to enlarge)
The southwesternmost cluster has 6 flashes in a region between 20.15o-20.33oN and 142.76o-142.91oE. The northeastern cluster has 17 flashes near 21.87oN 144.98oE. Where are these flashes relative to the storm?
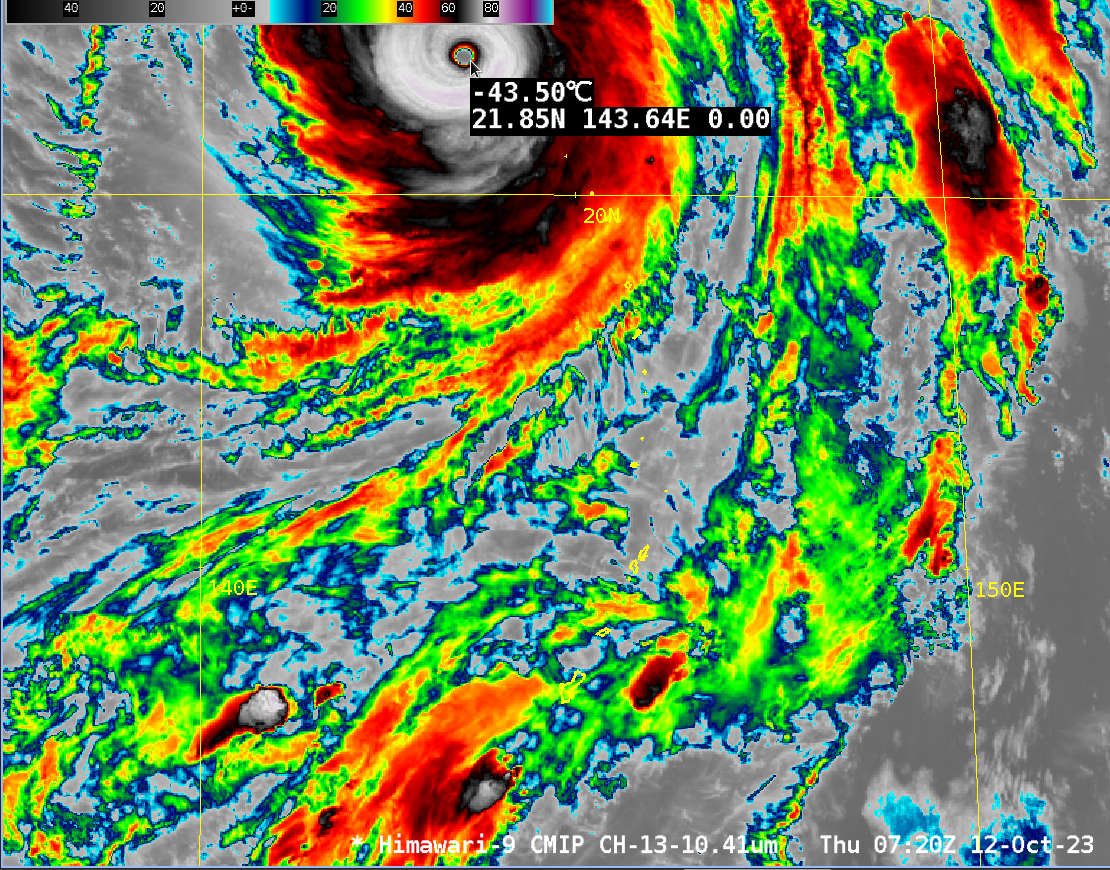
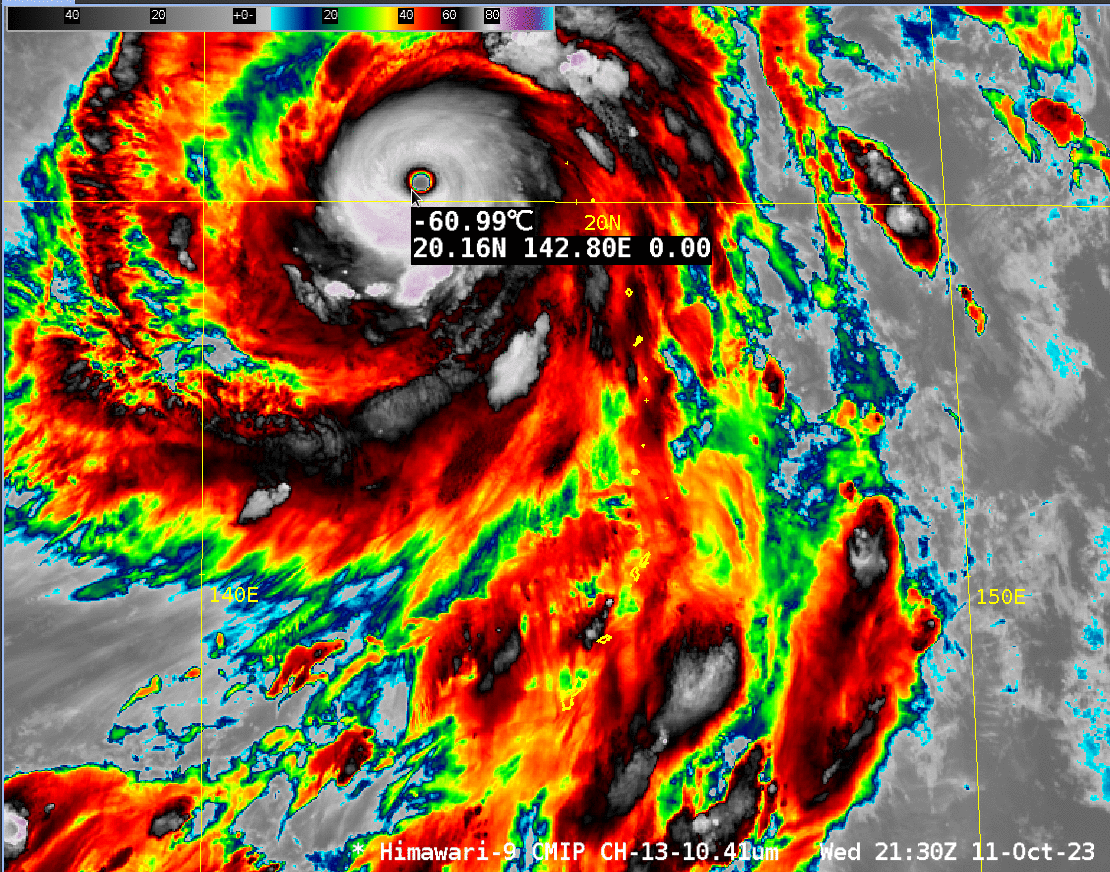
As indicated below, the lightning detected by LIS with this system is in the southwestern eyewall of the storm, and within a vigorous outer band. (For a recent study on the relationship between lightning and storm intensity, click here; an earlier study is here)
Himawari-9 Clean Window infrared (Band 13, 10.4 µm) imagery at 2130 UTC on 11 October 2023. Arrows point to regions where LIS observed lightning
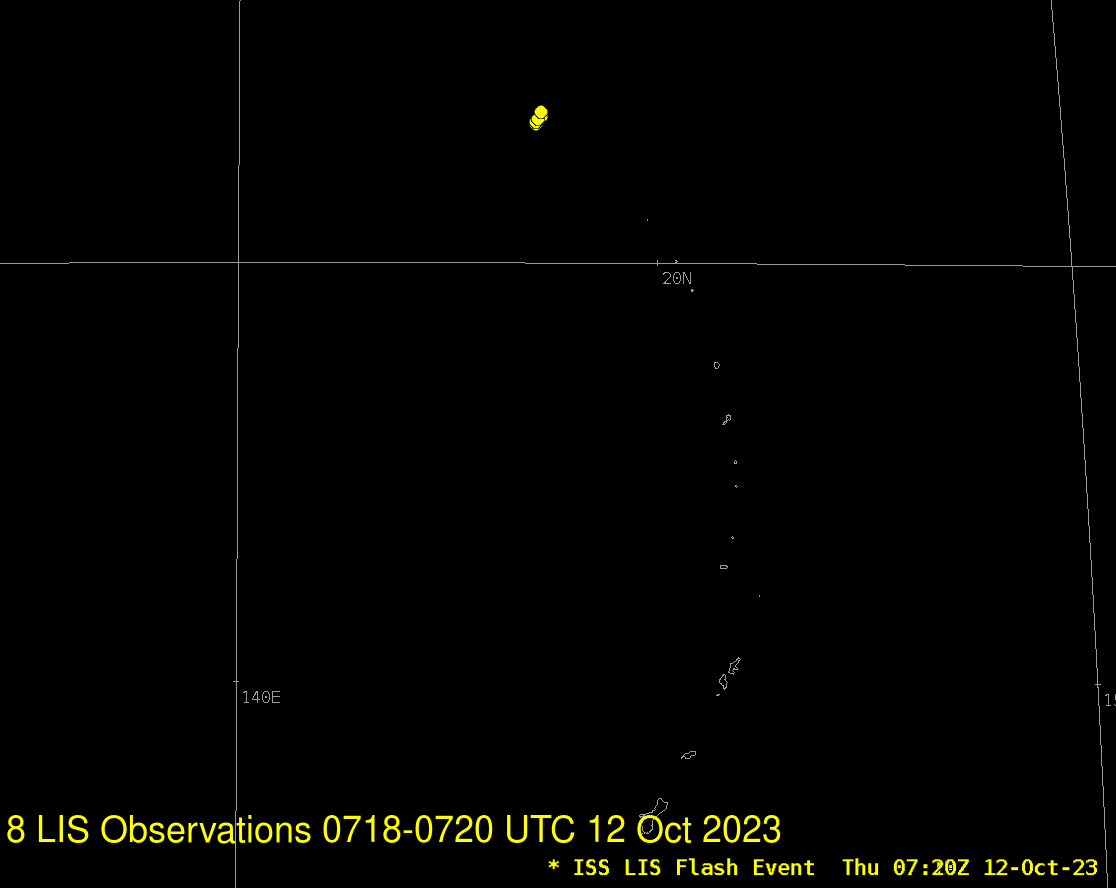
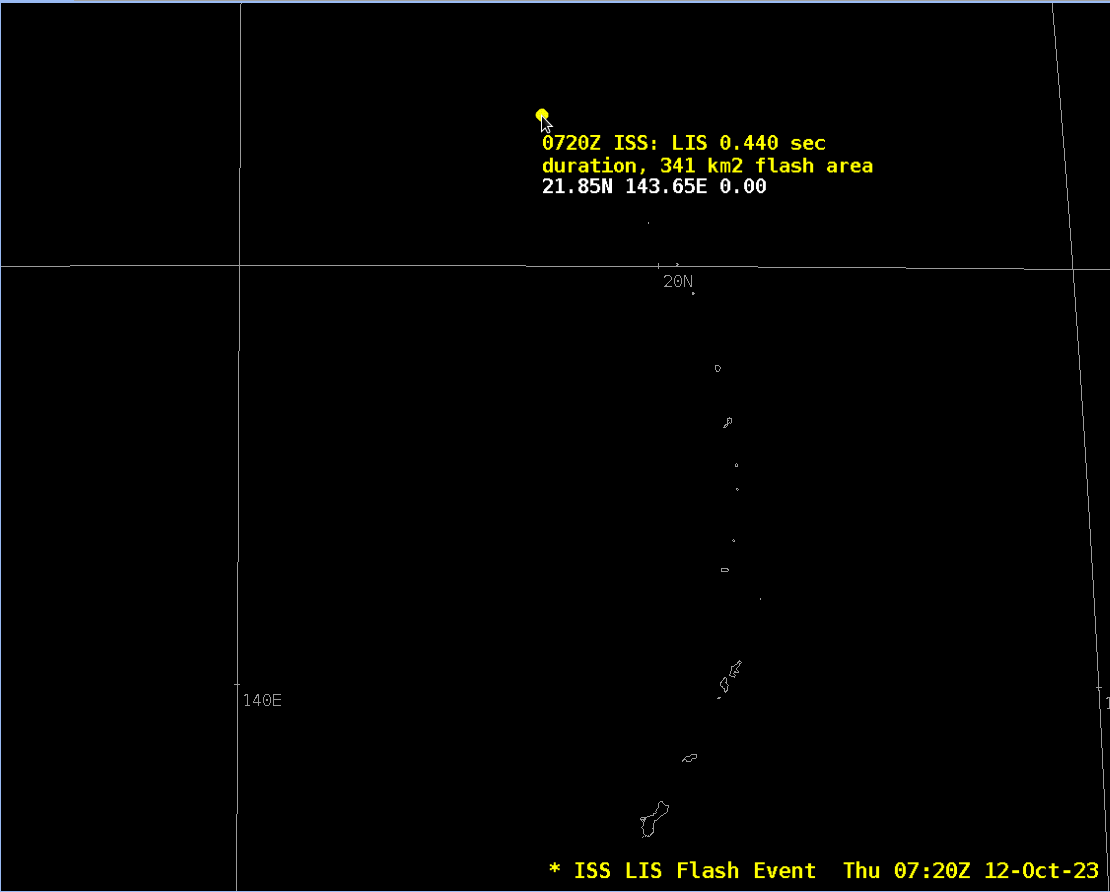
LIS Observations 0718-0720 UTC on 12 October 2023 (Click to enlarge)
Where were the lightning observations in relation to the Typhoon? As at 2130 UTC on 11 October, lightning activity was detected right in the eyewall of the storm, as indicated below.
Himawari-9 Clean Window infrared (Band 13, 10.4 µm) imagery at 0720 UTC on 12 October 2023. Arrows point to where LIS observed lightning
In both cases, LIS observed lightning within the eyewall of Bolaven. Such observations are consistent with the system’s strength.
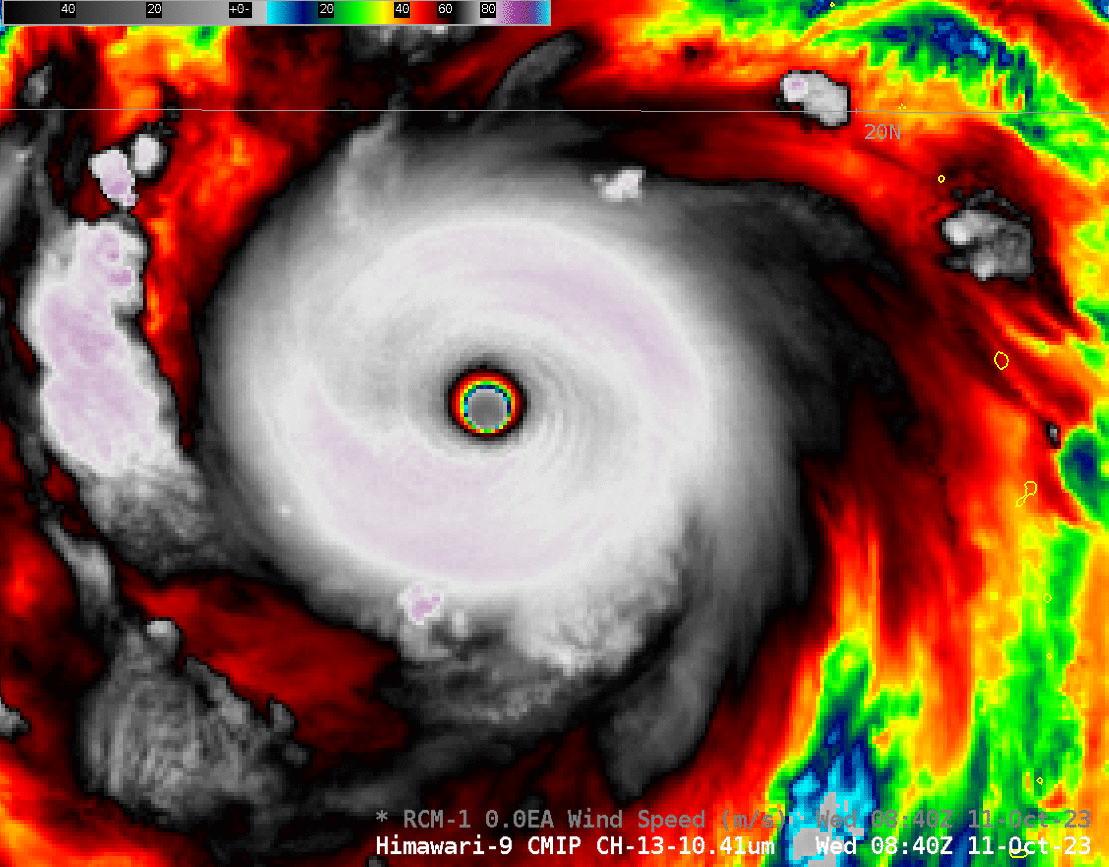
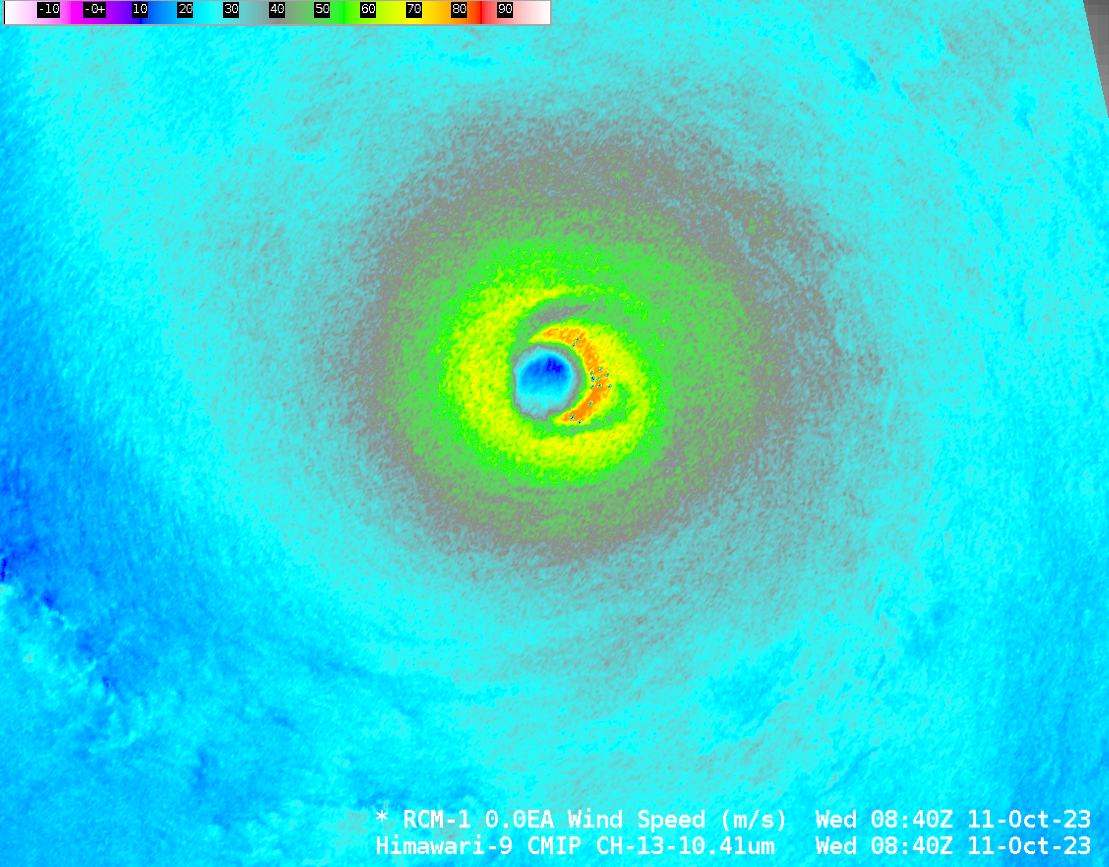
The RCM-1 (Radarsat Constellation Mission 1) satellite overflew STY Bolaven at 0840 UTC on 11 October. The Himawari-9 infrared (10.4 µm) presentation of the storm is excellent with a symmetric storm, distinct eye, and vigorous outer band convection. SAR winds show the strongest convection in the eastern half of the... Read More
The RCM-1 (Radarsat Constellation Mission 1) satellite overflew STY Bolaven at 0840 UTC on 11 October. The Himawari-9 infrared (10.4 µm) presentation of the storm is excellent with a symmetric storm, distinct eye, and vigorous outer band convection. SAR winds show the strongest convection in the eastern half of the eyewall, where winds of 80 m/s (> 150 knots) are measured. (This website contains views of Bolaven from multiple SAR overpasses) The structure of the SAR winds (here‘s a zoomed-in view) shows a band of weaker winds outside the strongest winds on the east side of the storm. Is an eyewall replacement cycle occurring?
Himawari-9 Clean Window (Band 13, 10.4 µm) imagery, RCM-1 SAR Wind analyses, 0840 UTC on 11 October 2023 (Click to enlarge)
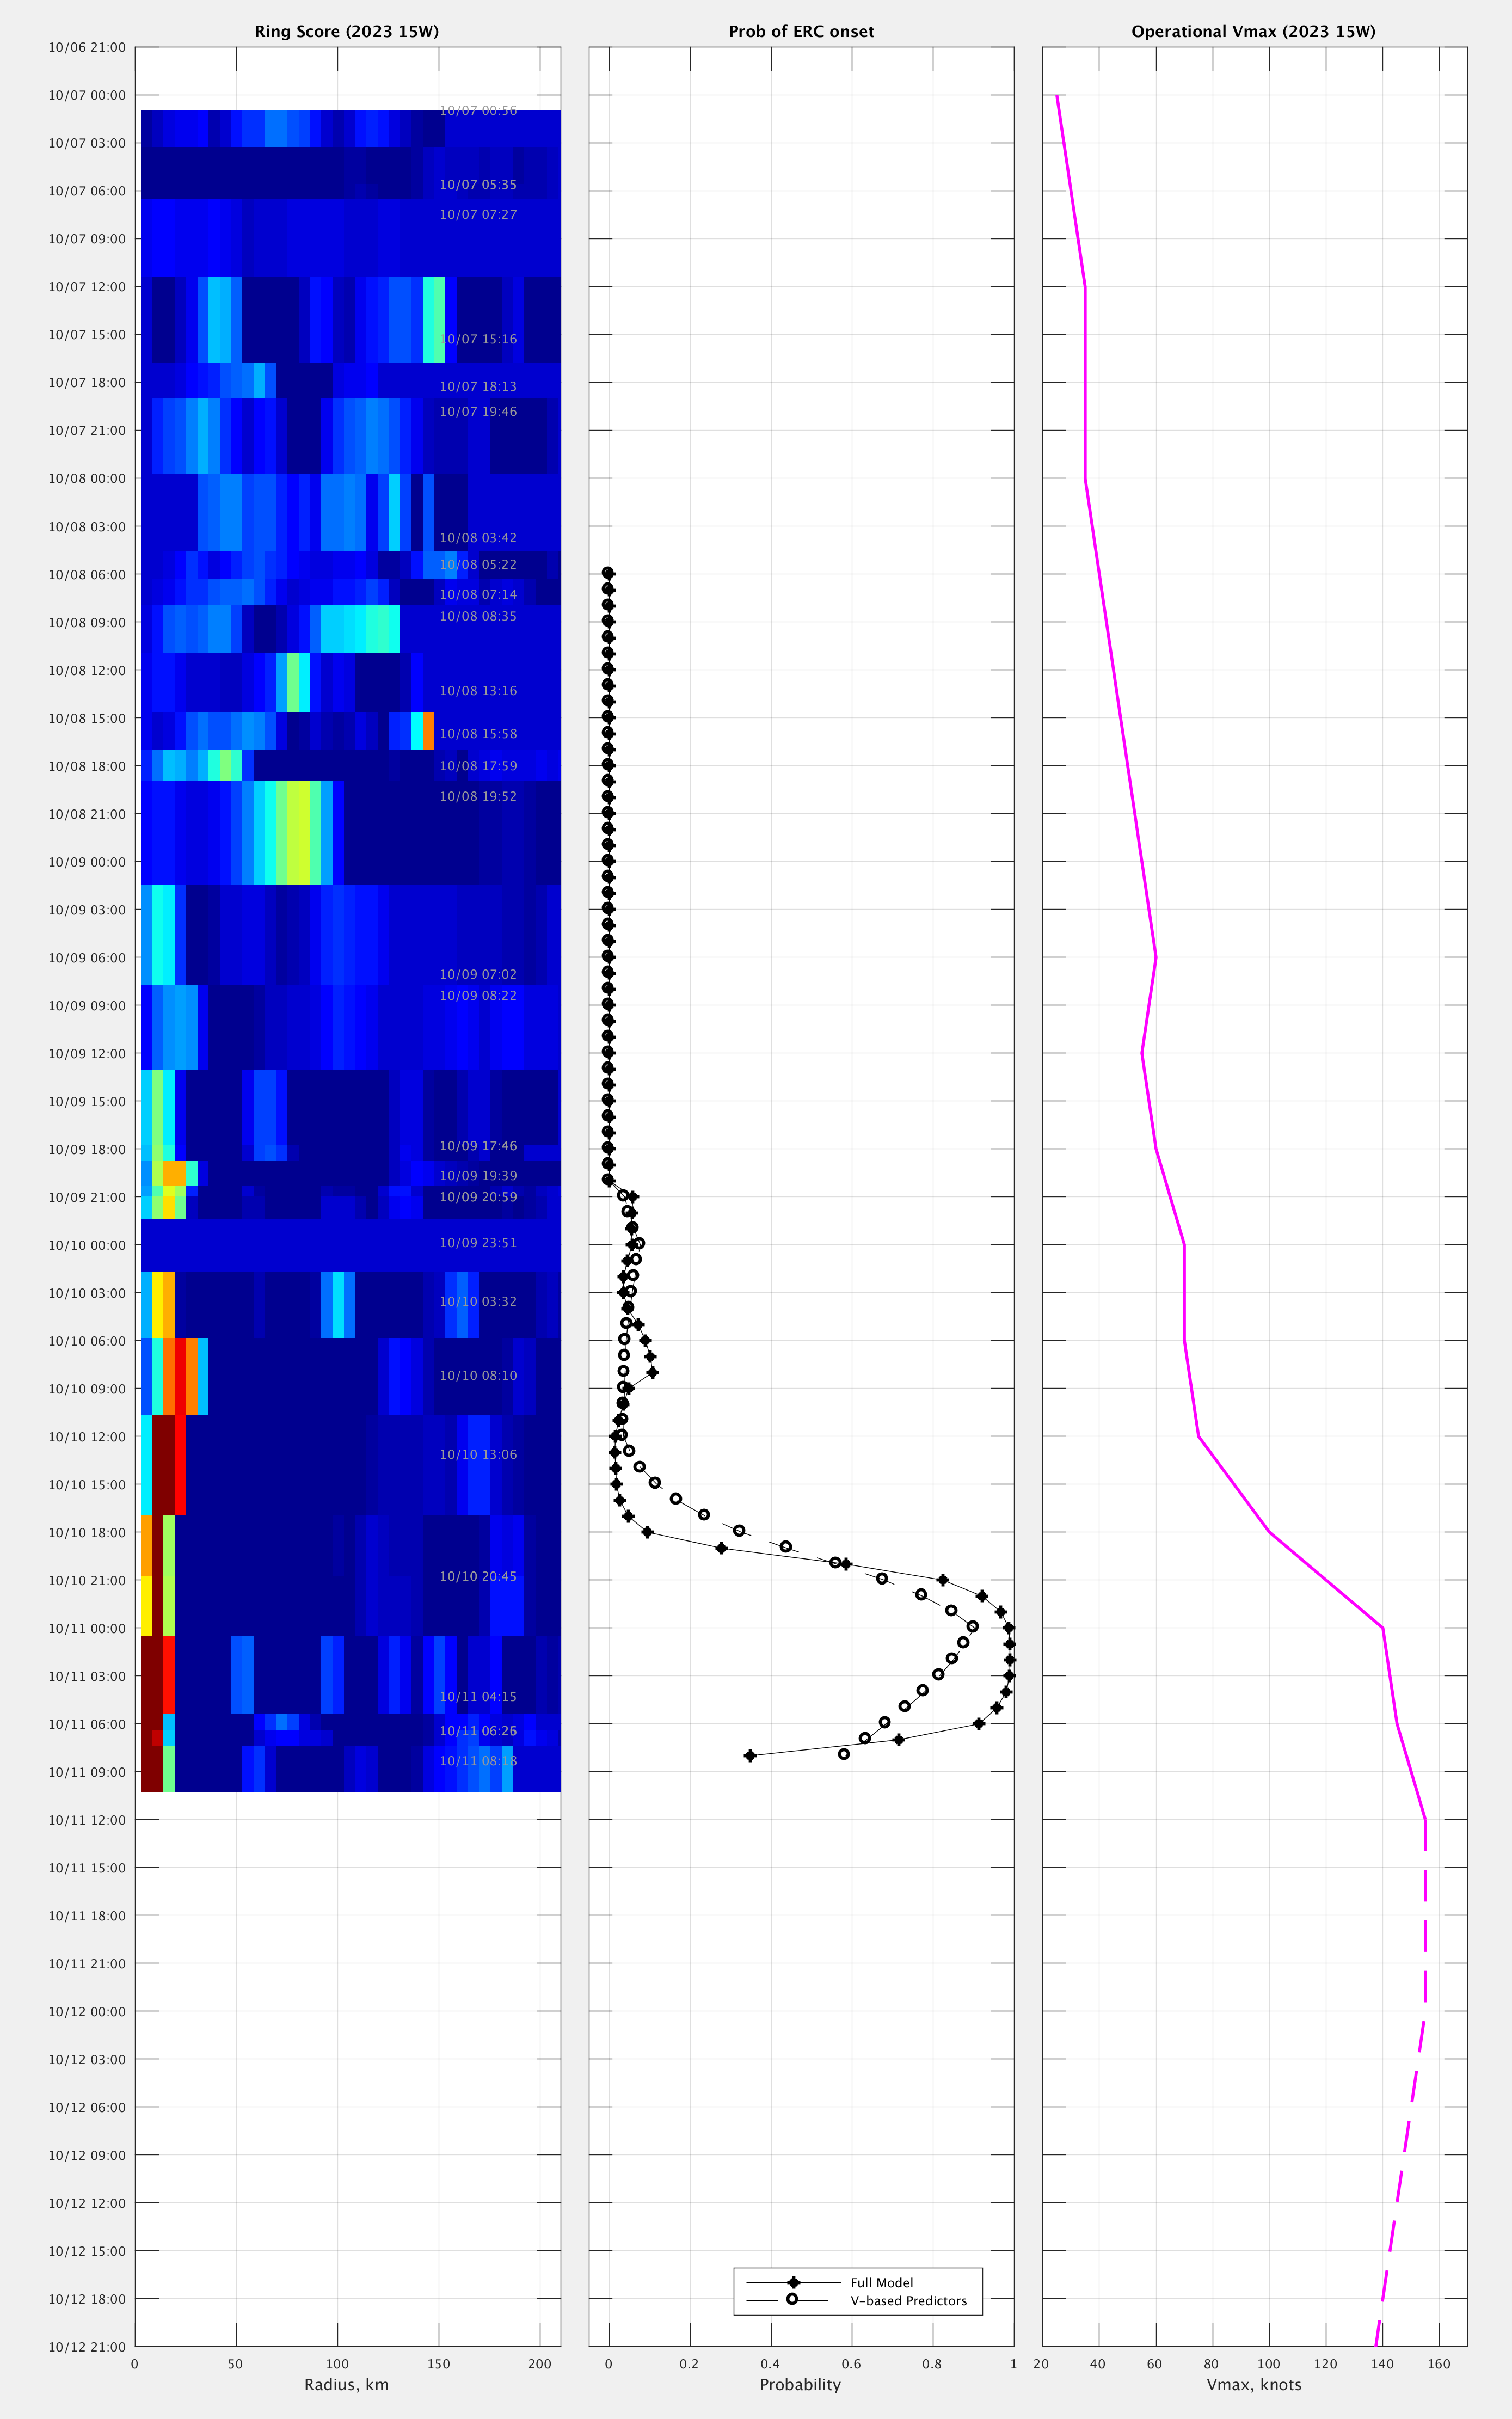
Microwave-based estimates of a Ring Score, Probability of an Eyewall Replacement, and Maximum winds (Click to view the entire diagram)
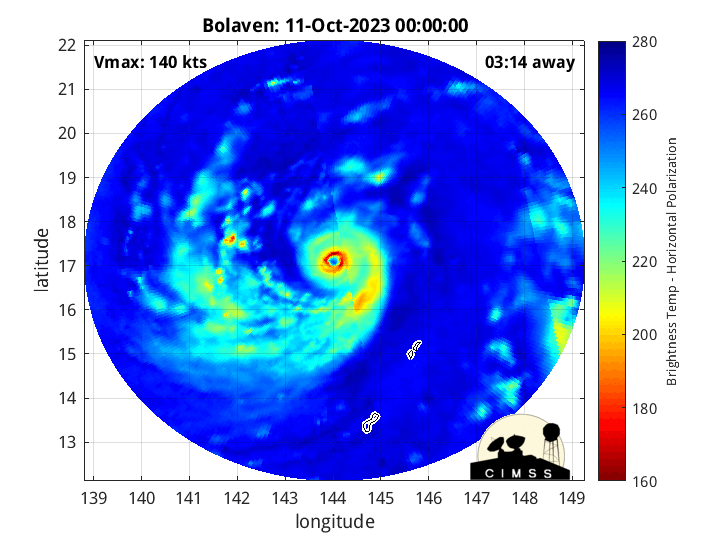
The MIMIC-TC animation below, however, shows winds consistently at/above 145 knots in the latter part of the animation, and no obvious signature of an ongoing eyewall replacement.
MIMIC-TC over Bolaven, 0000 – 0945 UTC, 11 October 2023 (click to enlarge)
For more information on this storm, refer to the webpages of the Joint Typhoon Warning Center, the RSMC in Tokyo and the CIMSS Tropical Website. Bolaven is forecast to remain at sea as it recurves to the north and east. It is forecast to become a significant mid-latitude extra-tropical cyclone in the Gulf of Alaska by 18 October.

