This website works best with a newer web browser such as Chrome, Firefox, Safari or Microsoft
Edge. Internet Explorer is not supported by this website.
10-minute Full Disk GOES-16 (GOES-East) “Red” Visible (0.64 µm), Shortwave Infrared (3.9 µm) and “Clean” Infrared Window (10.3 µm) images (above) showed that a wildfire complex in southern Brazil produced a series of 4-5 pyrocumulonimbus (pyroCb) clouds on 13 November 2023. The coldest pyroCb cloud-top 10.3 µm brightness temperature was -74.4ºC at 1530 UTC.Regarding the wildfire... Read More
GOES-16 “Red” Visible (0.64 µm, left), Shortwave Infrared (3.9 µm, center) and “Clean” Infrared Window (10.3 µm, right) images, from 1200 UTC to 1900 UTC on 13 November [click to play animated GIF | MP4]
10-minute Full Disk GOES-16 (GOES-East) “Red” Visible (0.64 µm), Shortwave Infrared (3.9 µm) and “Clean” Infrared Window (10.3 µm) images (above) showed that a wildfire complex in southern Brazil produced a series of 4-5 pyrocumulonimbus (pyroCb) clouds on 13 November 2023. The coldest pyroCb cloud-top 10.3 µm brightness temperature was -74.4ºC at 1530 UTC.
GOES-16 Fire Mask (top left), Fire Power (top right), Fire Area (bottom left) and Fire Temperature (bottom right) derived products [click to play animated GIF | MP4]
Regarding the wildfire complex that produced those pyroCb clouds, the 4 components of the GOES-16 Fire Detection and Characterization Algorithm (FDCA) are shown above — and a larger-scale view of the Fire Mask component is shown below.
GOES-16 Fire Mask derived product [click to play animated GIF | MP4]
A blend of GOES-16 Shortwave Infrared and “Clean” Infrared Window images with an overlay of GLM Group Points — created using RealEarth — revealed that there were periods of significant lightning activity associated with the largest pyroCb cloud as it drifted southward away from the large wildfire complex.
Blend of GOES-16 Shortwave Infrared (3.9 µm) and “Clean” Infrared Window (10.3 µm) images, with an overlay of GLM Group Points, from 1200 UTC to 1900 UTC on 13 November [click to play animated GIF | MP4]
This is likely the fourth confirmed case of a South American pyroCb — in addition, it’s one of the very few pyroCb events documented so far in the tropics.
CIMSS provides (free of charge) CSPPGeo software that can create (and plot) gridded GLM data from GLM Level 2 LCFA files. The data from those files can then be plotted by geo2grid on top of ABI data to give an idea of how much lightning is occurring each minute. On... Read More
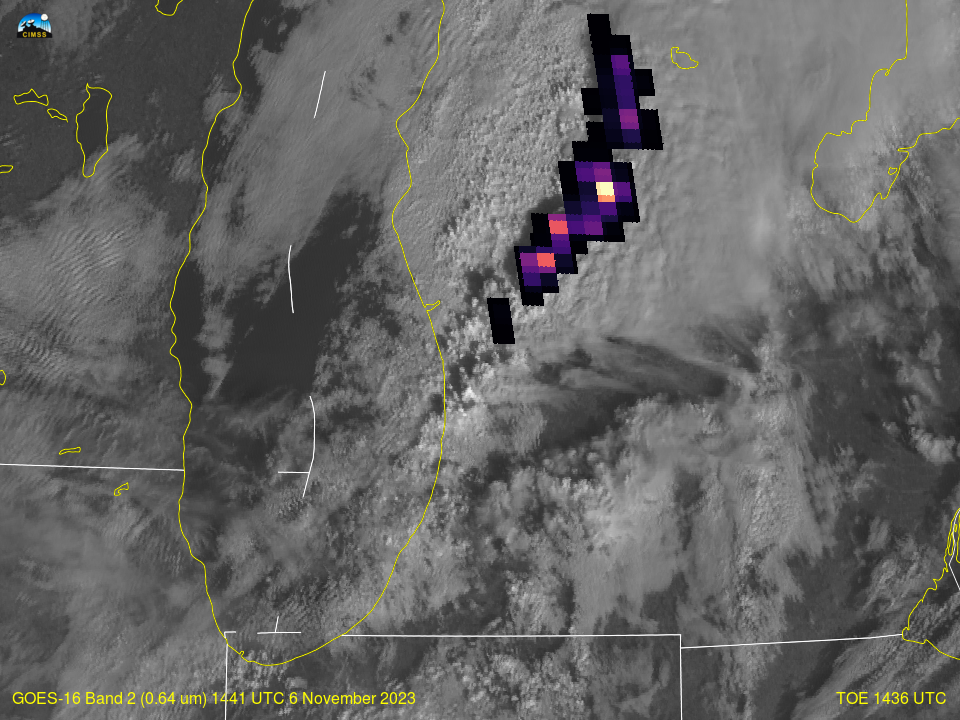
GOES-16 Band 2 visible (0.64 µm) imagery, 1436 and 1441 UTC on 6 November 2023 (Click to enlarge)
CIMSS provides (free of charge) CSPPGeo software that can create (and plot) gridded GLM data from GLM Level 2 LCFA files. The data from those files can then be plotted by geo2grid on top of ABI data to give an idea of how much lightning is occurring each minute. On 6 November, severe hail was reported over lower Michigan as documented in this blog post. What did the gridded GLM fields look like on that day?
To discern this, visible imagery fields at 1436 and 1441 UTC on 6 November (near the times when severe hail was being reported) were first created using geo2grid over a specific domain, using the commands below (the results are shown above). The first command shown just below (p2g_grid_helper.sh) creates a 960×720 grid (‘GRR’) centered at 43.0oN, 86.0oW, with 500-m resolution in the E-W and N-S direction, and redirects the created grid parameters to the file ‘GRR2.yaml’. Then geo2grid is invoked to extract C02 (GOES-16 Band 2, visible imagery centered at 0.64 µm) on that grid at 1436 and 1441 UTC on 6 November 2023 (Day 310).
The commands above create two files: GOES-16_ABI_RadC_C02_20231106_143617_GRR.tif and GOES-16_ABI_RadC_C02_20231106_144117_GRR.tif.
Next, CSPPGeo software gridded GLM software is used to create minute-by-minute files of Gridded GLM, in this case from 1431 to 1440 UTC on 6 November 2023 (Day 310). These data will be overlain on the 14346 and 1441 UTC visible images created above.
sh ./cspp-geo-gglm.sh /path_to_G16GLMdata/glm/L2/LCFA/OR_GLM-L2-LCFA_G16_s20233101431*.nc
sh ./cspp-geo-gglm.sh /path_to_G16GLMdata/glm/L2/LCFA/OR_GLM-L2-LCFA_G16_s20233101432*.nc
sh ./cspp-geo-gglm.sh /path_to_G16GLMdata/glm/L2/LCFA/OR_GLM-L2-LCFA_G16_s20233101433*.nc
....
sh ./cspp-geo-gglm.sh /path_to_G16GLMdata/glm/L2/LCFA/OR_GLM-L2-LCFA_G16_s20233101440*.nc
Then, geo2grid was used to create GLM imagery (in this case Total Optical Energy fields) at the 10 times. Recall that the --list-products-all flag can be added to the geo2grid call to see which products can be produced given the input netCDF fields.
At this point, we have tif files that have the C02 (Band 2) fields, and tif fields that have Total Optical Energy fields at 1-minute intervals. Next, we color-enhance the total optical energy fields using geo2grid’s add_colormap.sh, and then add maps to both the Band 2 images and the Total Optical Energy fields, resulting in png files that have state and lake borders added. Those commands are shown below.
$GEO2GRID_HOME/bin/add_colormap.sh ../../enhancements/glm_energy_colortable.txt *GOES16*energy*.tif

./add_coastlines.sh --add-coastlines --coastlines-resolution f --add-borders --borders-resolution f GOES*16*flash*.tif

./add_coastlines.sh --add-coastlines --coastlines-resolution f --add-borders --borders-resolution f GOES*16*C02*.tif
All that remains is to annotate the Band 2 imagery, and overlay the Total Optical Energy (TOE) fields on top. This is done (not shown) using ImageMagick commands. The two Band 2 images are shown above, and the same two fields with 5 TOE fields overlain on each are shown below.
GOES-16 Band 2 Visible (0.64 µm) Images at 1436 and 1441 UTC, along with 1-minute aggregates of GOES-16 GLM Total Optical Energy, 1431 – 1440 UTC on 6 November 2023
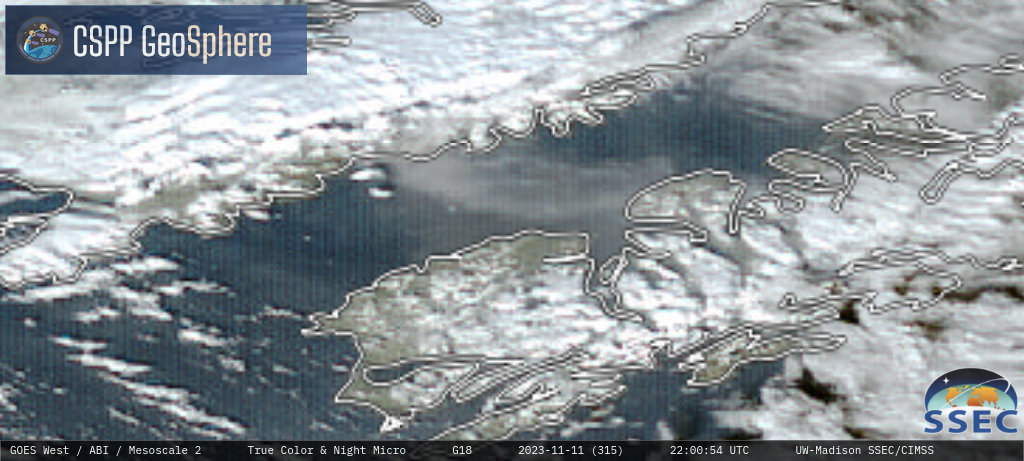
1-minute Mesoscale Domain Sector GOES-18 (GOES-West) daytime True Color RGB + Nighttime Microphysics RGB images from the CSPP GeoSphere site (above) showed a plume of resuspended volcanic ash (hazy shades of gray in True Color RGB, and brighter shades of pink in Nighttime Microphysics RGB) from the 1912 Novarupta-Katmai eruption in Alaska, which was being transported offshore across the Shelikof Strait toward Kodiak Island on... Read More
GOES-18 daytime True Color RGB and Nighttime Microphysics RGB images, from 1850 UTC on 11 November to 0600 UTC on 12 November [click to play MP4 animation]
1-minute Mesoscale Domain Sector GOES-18 (GOES-West) daytime True Color RGB + Nighttime Microphysics RGB images from the CSPP GeoSphere site (above) showed a plume of resuspended volcanic ash (hazy shades of gray in True Color RGB, and brighter shades of pink in Nighttime Microphysics RGB) from the 1912 Novarupta-Katmai eruption in Alaska, which was being transported offshore across the Shelikof Strait toward Kodiak Island on 11 November 2023. A Volcanic Ash Advisory estimated that the ash was being lofted as high as 5000 feet above the surface.
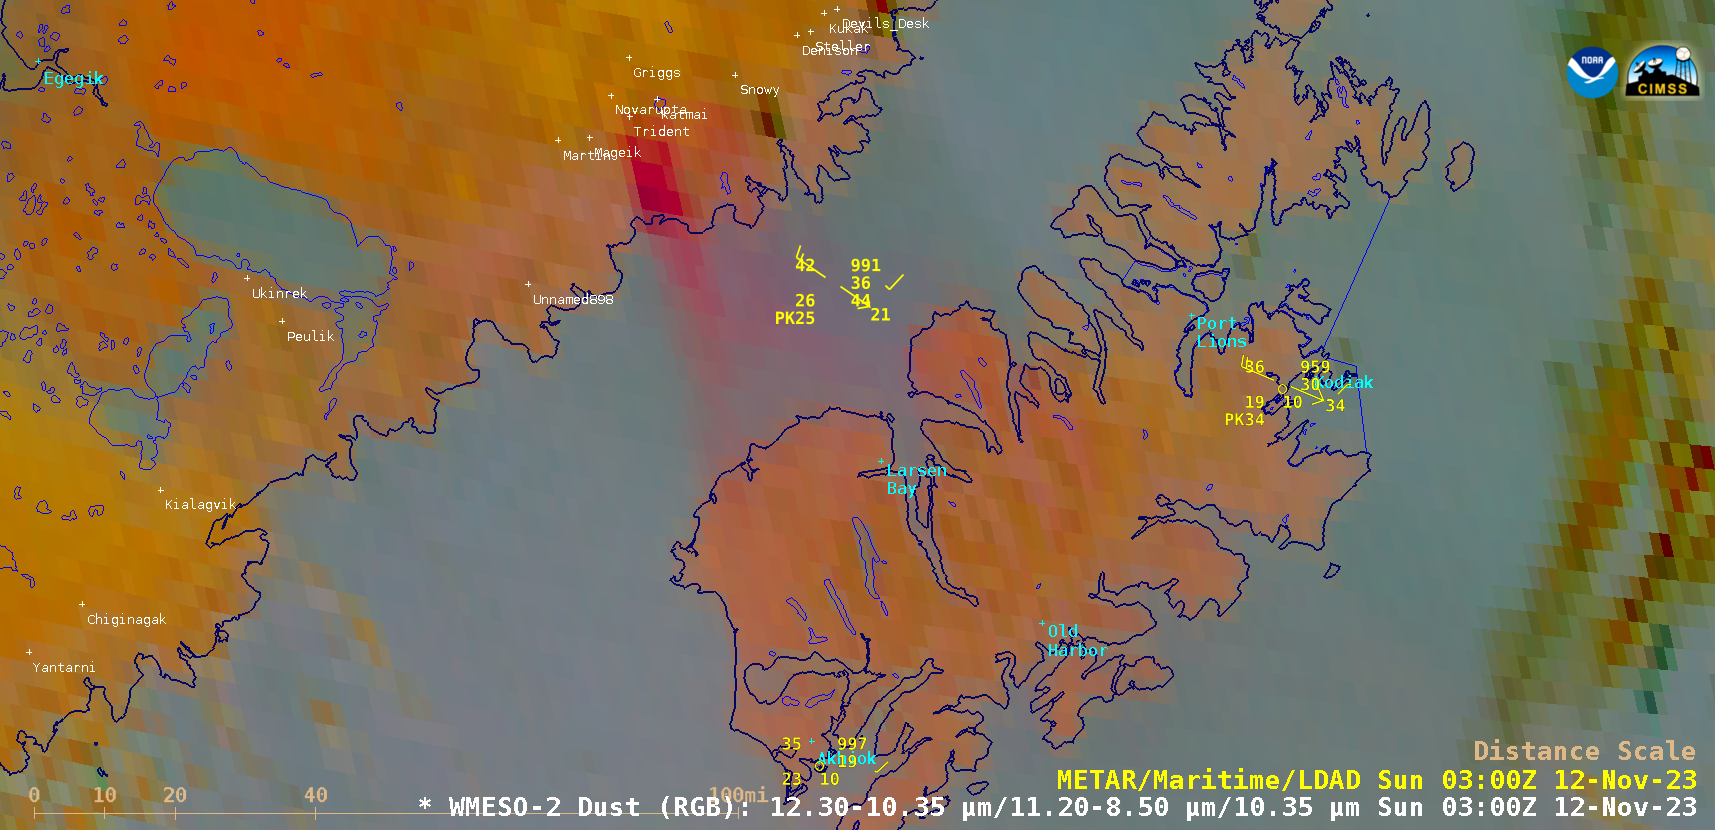
GOES-18 Dust RGB images, from 1800 UTC on 11 November to 0600 UTC on 12 November [click to play animated GIF | MP4]
1-minute GOES-18 Dust RGB images (above) also highlighted the plume of resuspended volcanic ash (shades of pink) — loose surface ash that had been deposited within the Valley Of Ten Thousand Smokes was being lofted by strong northwesterly winds. A toggle between the 0300 UTC Dust RGB image and Topography (below) highlighted that particular valley as the ash source region.
GOES-18 Dust RGB image at 0300 UTC on 12 November, and Topography [click to enlarge]
The Imager on GOES-13 captured approximately 2,307,267 images (counting each of the 5 spectral bands as an image), with an additional (at least) 264,480 images as EWS-G1 — for a total of 2,571,747 images! In addition, the GOES-13 Sounder captured 3,054,820 images (counting each of the 19 spectral bands as... Read More
The first GOES-13 Full Disk visible image from June 2006 (left) and the final (fully illuminated) EWS-G1 Full Disk image from October 2023 (right).
The Imager on GOES-13 captured approximately 2,307,267 images (counting each of the 5 spectral bands as an image), with an additional (at least) 264,480 images as EWS-G1 — for a total of 2,571,747 images! In addition, the GOES-13 Sounder captured 3,054,820 images (counting each of the 19 spectral bands as an image).
GOES-N and GOES-13
After years of planning, GOES-N was launched in the Spring of 2006. The spacecraft was built by Boeing, while the Imager and Sounder were both built by (then) ITT Industries, Inc., as part of a series (GOES-N/O/P). After reaching the geostationary orbit, it was renamed GOES-13 and there was a post-launch test (PLT) period to verify its operational readiness (which produced a NOAA Technical Report: Hillger and Schmit). More on the GOES-13 PLT, including results from both the Imager and Sounder, is available here. A University of Wisconsin-Madison/SSEC story (“Changing the GOES line-up“) from 2006.
Multi-panel image showing the five spectral bands of the GOES-13 Imager.
“The latest Geostationary Operational Environmental Satellite (GOES), GOES-N, was launched on 24 May 2006, and reached geostationary orbit at 89.5°W on 4 June 2006 to become GOES-13. It was later moved to 105ºW for the Science Test and eventual storage. The National Oceanic and Atmospheric Administration (NOAA)/National Environmental Satellite, Data, and Information Service (NESDIS) conducted a 3-week GOES-13 Science Test that began 7 December 2006 and ended officially on 28 December 2006. The Science Test schedule was integrated within the NESDIS/National Aeronautics and Space Administration (NASA) GOES- 13 Post-Launch Test (PLT) schedule. GOES-13 has instruments similar to those on GOES-8/12,but is on a different spacecraft bus. The new bus allows improvements both to navigation and registration, as well as the radiometrics. By supplying data through the eclipse periods, the GOES-N/O/P system addresses one of the major limitations which are eclipse and related outages. This is possible due to larger spacecraft batteries. Outages due to Keep Out Zones (KOZ) will be minimized.“
FROM THE 2008 NOAA Report
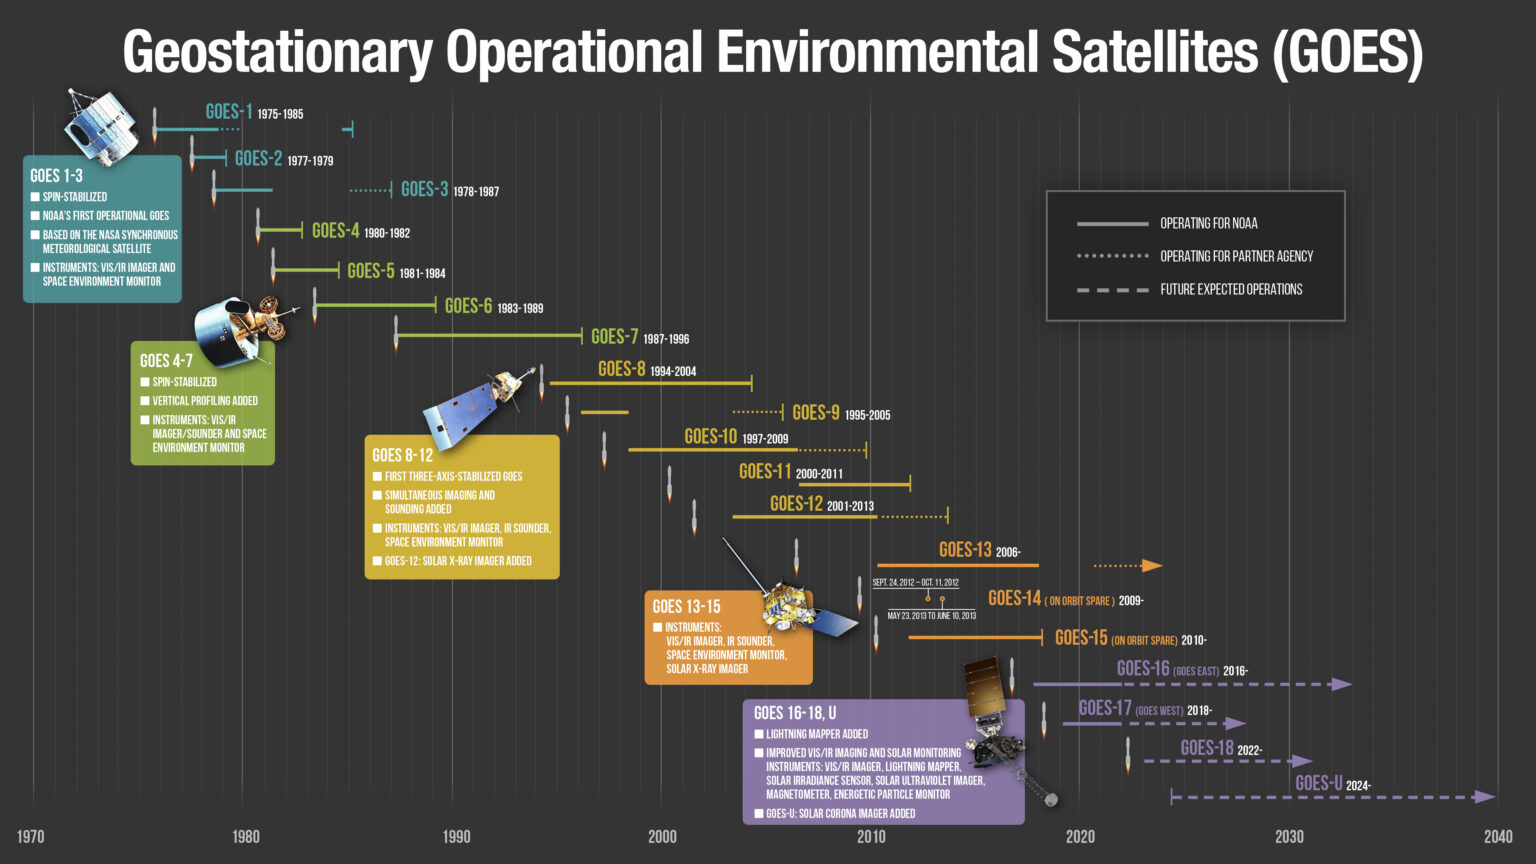
A timeline of the U.S. GOES series.
After the PLT checkout and handover from NASA to NOAA, GOES-13 was placed in on-orbit storage until it was put into operational use beginning in April of 2010. In 2012, there was an outage, while GOES-14 provided support. In 2013, the spacecraft was hit with a micrometeor, but the spacecraft was reactivated after spending two and a half weeks in safe mode. GOES-13 was featured in hundreds of entries on the CIMSS Satellite Blog covering many of the Earth-looking uses, including severe weather, fires, fog, smoke, etc. It ended operational service for NOAA in January of 2018, and was an in-orbit backup satellite until being transferred to the U.S. Space Force in 2019.
Last GOES-13 Water Vapor band image at the end of GOES-13 operations for NOAA in 2018.
GOES-13 Became EWS-G1
EWS-G1 (Electro-optical Infrared Weather System Geostationary) is a U.S. Space Force mission. The imager is running a routine scan schedule, as can be seen on the UW/SSECgeo-browser. This schedule includes scans of the Indian Ocean, the extended Indian Ocean and Full Disks. Previously only Full Disk images had been obtained every 30 minutes (see this EWS-G1 quick-guide). EWS-G1 imagery has been available via the UW/SSEC since late 2020. While operating over the Indian Ocean, the Imager monitored many phenomena, including many typhoons. Beginning in June of 2023, EWS-G1 has employed the “XGOHI” remapping of data before GVAR generation, to handle larger satellite inclination angles, increasing the time of providing quality imagery. This capability was first employed on GOES-10 (and then GOES-12) when their images provided special coverage of the Southern Hemisphere for a combined almost 7 years.
First GOES-15 visible image from April 2010.Cyclone Freddy making landfall in 2023 over Madagascar. (Click to play animation)
GOES-15 has become EWS-G2
It was recently announced by the Secretary of the Air Force that GOES-15 has become EWS-G2: “The U.S. Space Force accepted the transfer of a second geostationary weather satellite from the National Oceanic and Atmospheric Administration to extend persistent weather coverage of the Indian Ocean region until the 2030 timeframe. … As it currently does with EWS-G1, NOAA will operate EWS-G2 on behalf of the Space Force from the NOAA Satellite Operations Facility in Suitland, Maryland, and Wallops Command and Data Acquisition Station in Wallops Island, Virginia.”
An animation of the scan sectors of the EWS-G2 during part of November 8, 2023. The 6.5 micrometer (“water vapor”) band is shown. (Click to play animation)
The above loop is available as an mp4 and an animated gif.
The above image was intentionally offset to allow for special end of satellite life data collection for calibration purposes of the other GOES-N/O/P series Imagers.
EWS-G1 will soon be placed in a “super synchronous” (or “graveyard“) higher orbit – hence an end of an era. Thanks to GOES-13/EWS-G1 for much valuable data over the years.
History has been repeated, as GOES-1, after it’s operational use, was moved in the late 1970s to collect imagery over the Indian Ocean — and this has happened once again with GOES-13 and GOES-15 becoming EWS-G1 and EWS-G2.


_lifts_off_with_GOES-N.jpg)