This website works best with a newer web browser such as Chrome, Firefox, Safari or Microsoft
Edge. Internet Explorer is not supported by this website.
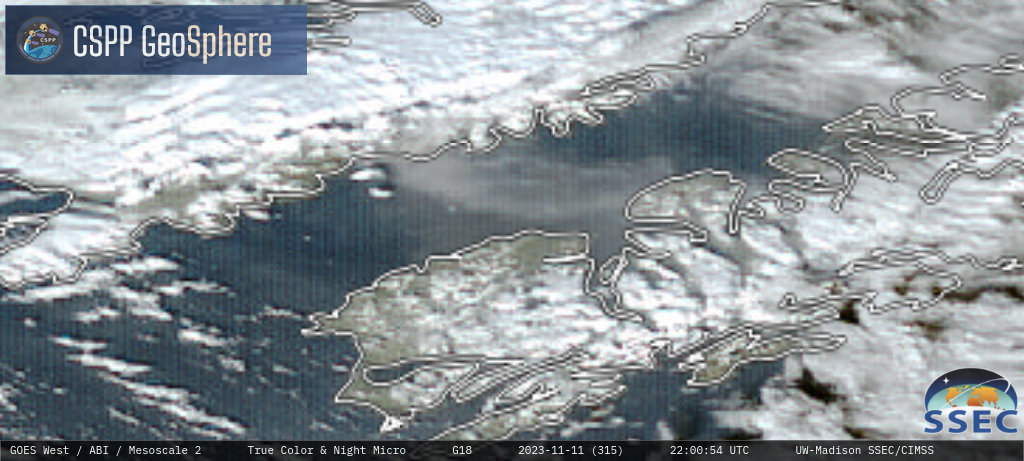
1-minute Mesoscale Domain Sector GOES-18 (GOES-West) daytime True Color RGB + Nighttime Microphysics RGB images from the CSPP GeoSphere site (above) showed a plume of resuspended volcanic ash (hazy shades of gray in True Color RGB, and brighter shades of pink in Nighttime Microphysics RGB) from the 1912 Novarupta-Katmai eruption in Alaska, which was being transported offshore across the Shelikof Strait toward Kodiak Island on... Read More
GOES-18 daytime True Color RGB and Nighttime Microphysics RGB images, from 1850 UTC on 11 November to 0600 UTC on 12 November [click to play MP4 animation]
1-minute Mesoscale Domain Sector GOES-18 (GOES-West) daytime True Color RGB + Nighttime Microphysics RGB images from the CSPP GeoSphere site (above) showed a plume of resuspended volcanic ash (hazy shades of gray in True Color RGB, and brighter shades of pink in Nighttime Microphysics RGB) from the 1912 Novarupta-Katmai eruption in Alaska, which was being transported offshore across the Shelikof Strait toward Kodiak Island on 11 November 2023. A Volcanic Ash Advisory estimated that the ash was being lofted as high as 5000 feet above the surface.
GOES-18 Dust RGB images, from 1800 UTC on 11 November to 0600 UTC on 12 November [click to play animated GIF | MP4]
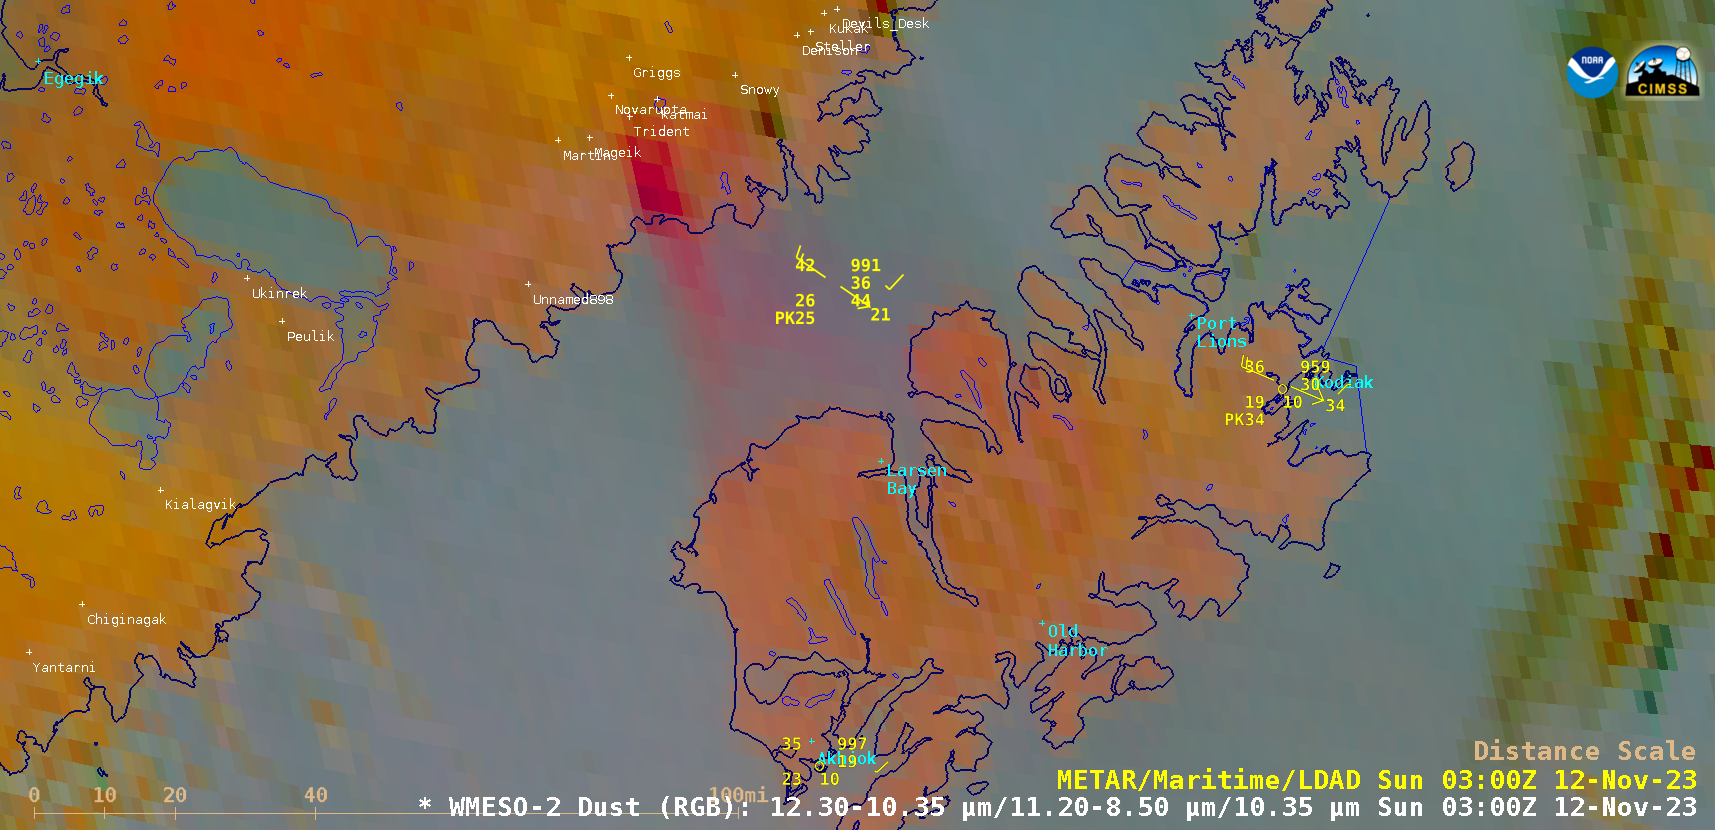
1-minute GOES-18 Dust RGB images (above) also highlighted the plume of resuspended volcanic ash (shades of pink) — loose surface ash that had been deposited within the Valley Of Ten Thousand Smokes was being lofted by strong northwesterly winds. A toggle between the 0300 UTC Dust RGB image and Topography (below) highlighted that particular valley as the ash source region.
GOES-18 Dust RGB image at 0300 UTC on 12 November, and Topography [click to enlarge]
The Imager on GOES-13 captured approximately 2,307,267 images (counting each of the 5 spectral bands as an image), with an additional (at least) 264,480 images as EWS-G1 — for a total of 2,571,747 images! In addition, the GOES-13 Sounder captured 3,054,820 images (counting each of the 19 spectral bands as... Read More
The first GOES-13 Full Disk visible image from June 2006 (left) and the final (fully illuminated) EWS-G1 Full Disk image from October 2023 (right).
The Imager on GOES-13 captured approximately 2,307,267 images (counting each of the 5 spectral bands as an image), with an additional (at least) 264,480 images as EWS-G1 — for a total of 2,571,747 images! In addition, the GOES-13 Sounder captured 3,054,820 images (counting each of the 19 spectral bands as an image).
GOES-N and GOES-13
After years of planning, GOES-N was launched in the Spring of 2006. The spacecraft was built by Boeing, while the Imager and Sounder were both built by (then) ITT Industries, Inc., as part of a series (GOES-N/O/P). After reaching the geostationary orbit, it was renamed GOES-13 and there was a post-launch test (PLT) period to verify its operational readiness (which produced a NOAA Technical Report: Hillger and Schmit). More on the GOES-13 PLT, including results from both the Imager and Sounder, is available here. A University of Wisconsin-Madison/SSEC story (“Changing the GOES line-up“) from 2006.
Multi-panel image showing the five spectral bands of the GOES-13 Imager.
“The latest Geostationary Operational Environmental Satellite (GOES), GOES-N, was launched on 24 May 2006, and reached geostationary orbit at 89.5°W on 4 June 2006 to become GOES-13. It was later moved to 105ºW for the Science Test and eventual storage. The National Oceanic and Atmospheric Administration (NOAA)/National Environmental Satellite, Data, and Information Service (NESDIS) conducted a 3-week GOES-13 Science Test that began 7 December 2006 and ended officially on 28 December 2006. The Science Test schedule was integrated within the NESDIS/National Aeronautics and Space Administration (NASA) GOES- 13 Post-Launch Test (PLT) schedule. GOES-13 has instruments similar to those on GOES-8/12,but is on a different spacecraft bus. The new bus allows improvements both to navigation and registration, as well as the radiometrics. By supplying data through the eclipse periods, the GOES-N/O/P system addresses one of the major limitations which are eclipse and related outages. This is possible due to larger spacecraft batteries. Outages due to Keep Out Zones (KOZ) will be minimized.“
FROM THE 2008 NOAA Report
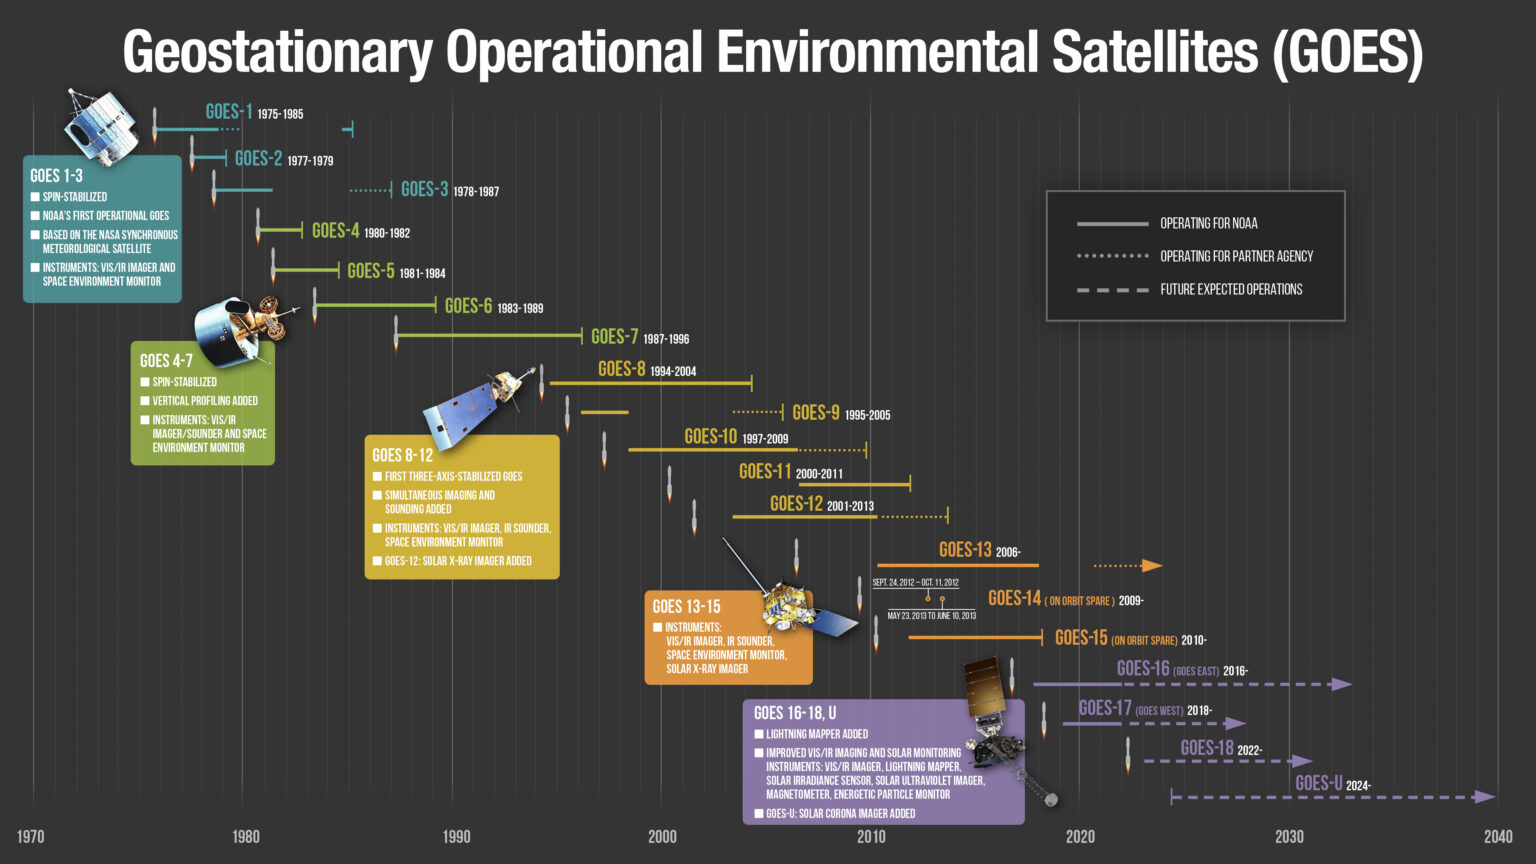
A timeline of the U.S. GOES series.
After the PLT checkout and handover from NASA to NOAA, GOES-13 was placed in on-orbit storage until it was put into operational use beginning in April of 2010. In 2012, there was an outage, while GOES-14 provided support. In 2013, the spacecraft was hit with a micrometeor, but the spacecraft was reactivated after spending two and a half weeks in safe mode. GOES-13 was featured in hundreds of entries on the CIMSS Satellite Blog covering many of the Earth-looking uses, including severe weather, fires, fog, smoke, etc. It ended operational service for NOAA in January of 2018, and was an in-orbit backup satellite until being transferred to the U.S. Space Force in 2019.
Last GOES-13 Water Vapor band image at the end of GOES-13 operations for NOAA in 2018.
GOES-13 Became EWS-G1
EWS-G1 (Electro-optical Infrared Weather System Geostationary) is a U.S. Space Force mission. The imager is running a routine scan schedule, as can be seen on the UW/SSECgeo-browser. This schedule includes scans of the Indian Ocean, the extended Indian Ocean and Full Disks. Previously only Full Disk images had been obtained every 30 minutes (see this EWS-G1 quick-guide). EWS-G1 imagery has been available via the UW/SSEC since late 2020. While operating over the Indian Ocean, the Imager monitored many phenomena, including many typhoons. Beginning in June of 2023, EWS-G1 has employed the “XGOHI” remapping of data before GVAR generation, to handle larger satellite inclination angles, increasing the time of providing quality imagery. This capability was first employed on GOES-10 (and then GOES-12) when their images provided special coverage of the Southern Hemisphere for a combined almost 7 years.
First GOES-15 visible image from April 2010.Cyclone Freddy making landfall in 2023 over Madagascar. (Click to play animation)
GOES-15 has become EWS-G2
It was recently announced by the Secretary of the Air Force that GOES-15 has become EWS-G2: “The U.S. Space Force accepted the transfer of a second geostationary weather satellite from the National Oceanic and Atmospheric Administration to extend persistent weather coverage of the Indian Ocean region until the 2030 timeframe. … As it currently does with EWS-G1, NOAA will operate EWS-G2 on behalf of the Space Force from the NOAA Satellite Operations Facility in Suitland, Maryland, and Wallops Command and Data Acquisition Station in Wallops Island, Virginia.”
An animation of the scan sectors of the EWS-G2 during part of November 8, 2023. The 6.5 micrometer (“water vapor”) band is shown. (Click to play animation)
The above loop is available as an mp4 and an animated gif.
The above image was intentionally offset to allow for special end of satellite life data collection for calibration purposes of the other GOES-N/O/P series Imagers.
EWS-G1 will soon be placed in a “super synchronous” (or “graveyard“) higher orbit – hence an end of an era. Thanks to GOES-13/EWS-G1 for much valuable data over the years.
History has been repeated, as GOES-1, after it’s operational use, was moved in the late 1970s to collect imagery over the Indian Ocean — and this has happened once again with GOES-13 and GOES-15 becoming EWS-G1 and EWS-G2.
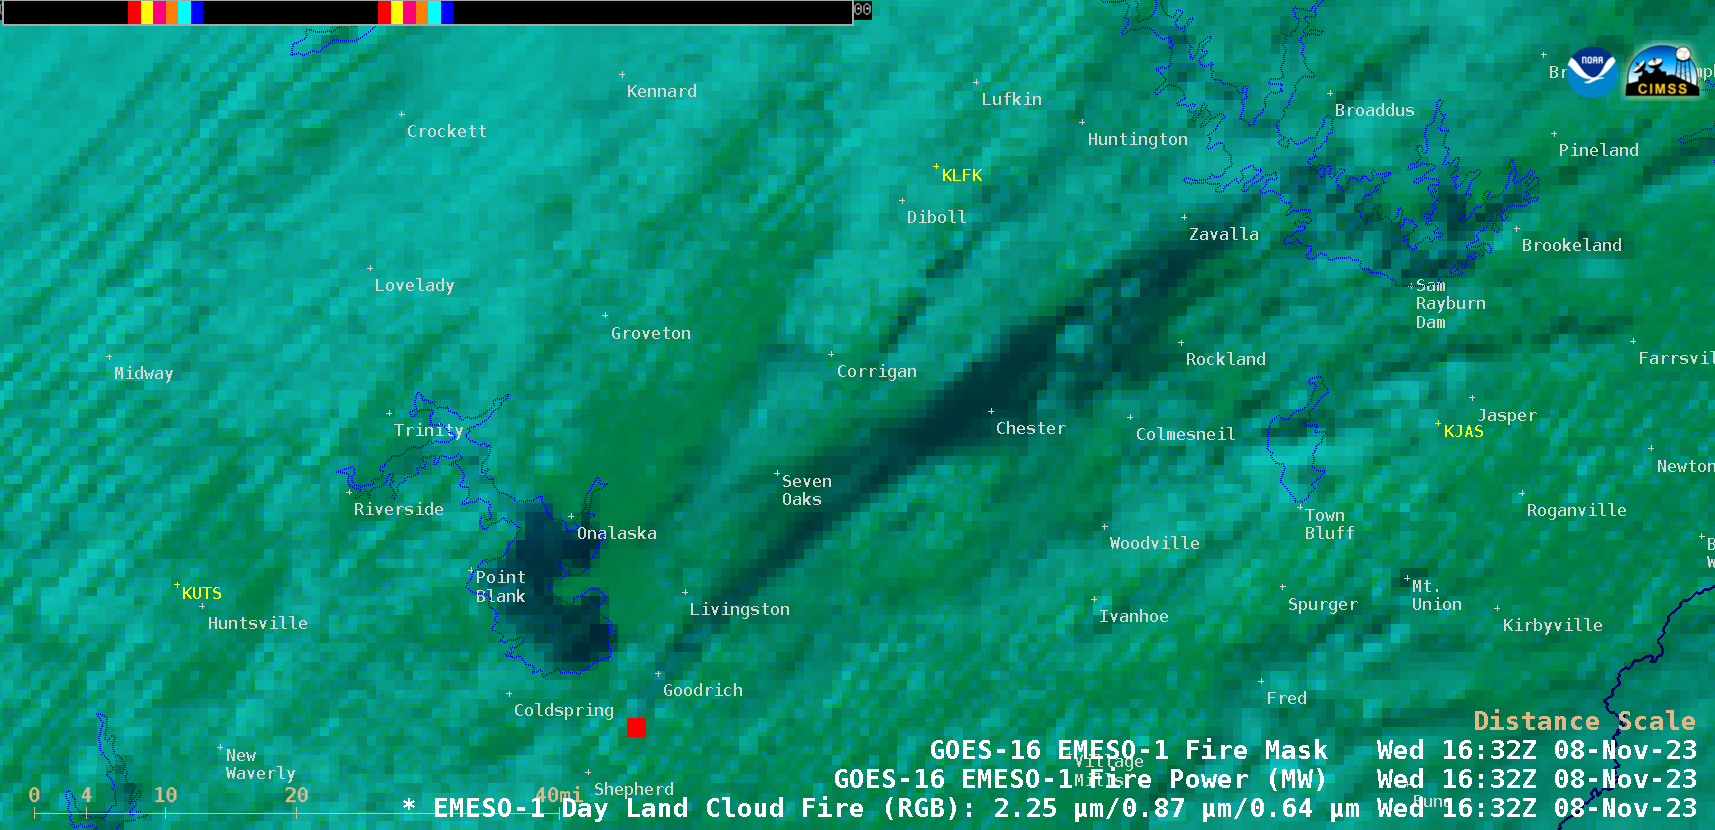
Overlapping 1-minute Mesoscale Domain Sectors provided 30-second interval GOES-16 (GOES-East) Day Land Cloud Fire RGB images (above) that included an overlay of Fire Power and Fire Mask derived products (2 components of the GOES Fire Detection and Characterization Algorithm FDCA) — which showed the thermal signature and dark black smoke plume associated with a fire at the... Read More
GOES-16 Day Land Cloud Fire RGB images with an overlay of Fire Power and Fire Mask derived products, from 1400 UTC to 1900 UTC [click to play animated GIF | MP4]
Overlapping 1-minute Mesoscale Domain Sectors provided 30-second interval GOES-16 (GOES-East)Day Land Cloud Fire RGB images (above) that included an overlay of Fire Power and Fire Mask derived products (2 components of the GOES Fire Detection and Characterization Algorithm FDCA) — which showed the thermal signature and dark black smoke plume associated with a fire at the Sound Resource Solutions chemical plant in Shepherd, Texas on 08 November 2023. The smoke plume was thick enough to significantly reduce incoming solar radiation reaching the surface, which inhibited the subsequent development of boundary layer cumulus clouds (resulting in a pronounced gap in the cumulus field downwind of the fire and smoke plume source after about 1700 UTC).
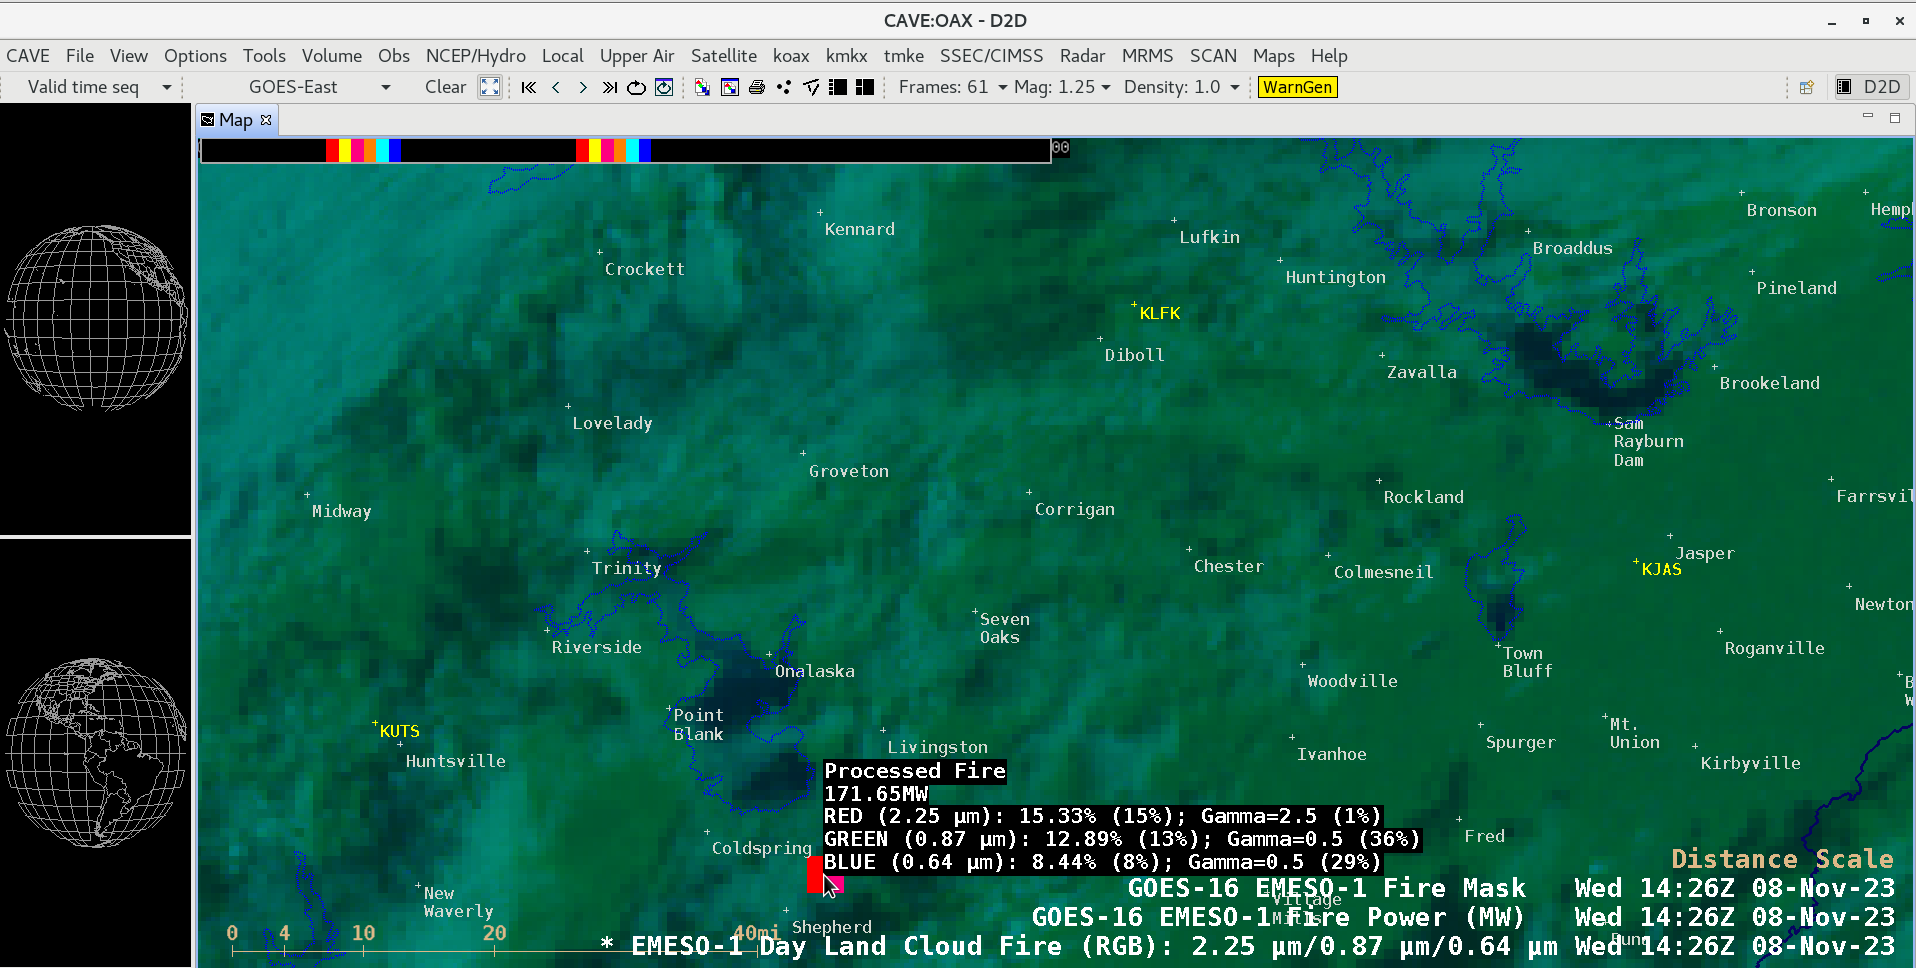
GOES-16 Day Land Cloud Fire RGB image at 1426 UTC, with a cursor sample of Fire Mask and Fire Power derived product values [click to enlarge]
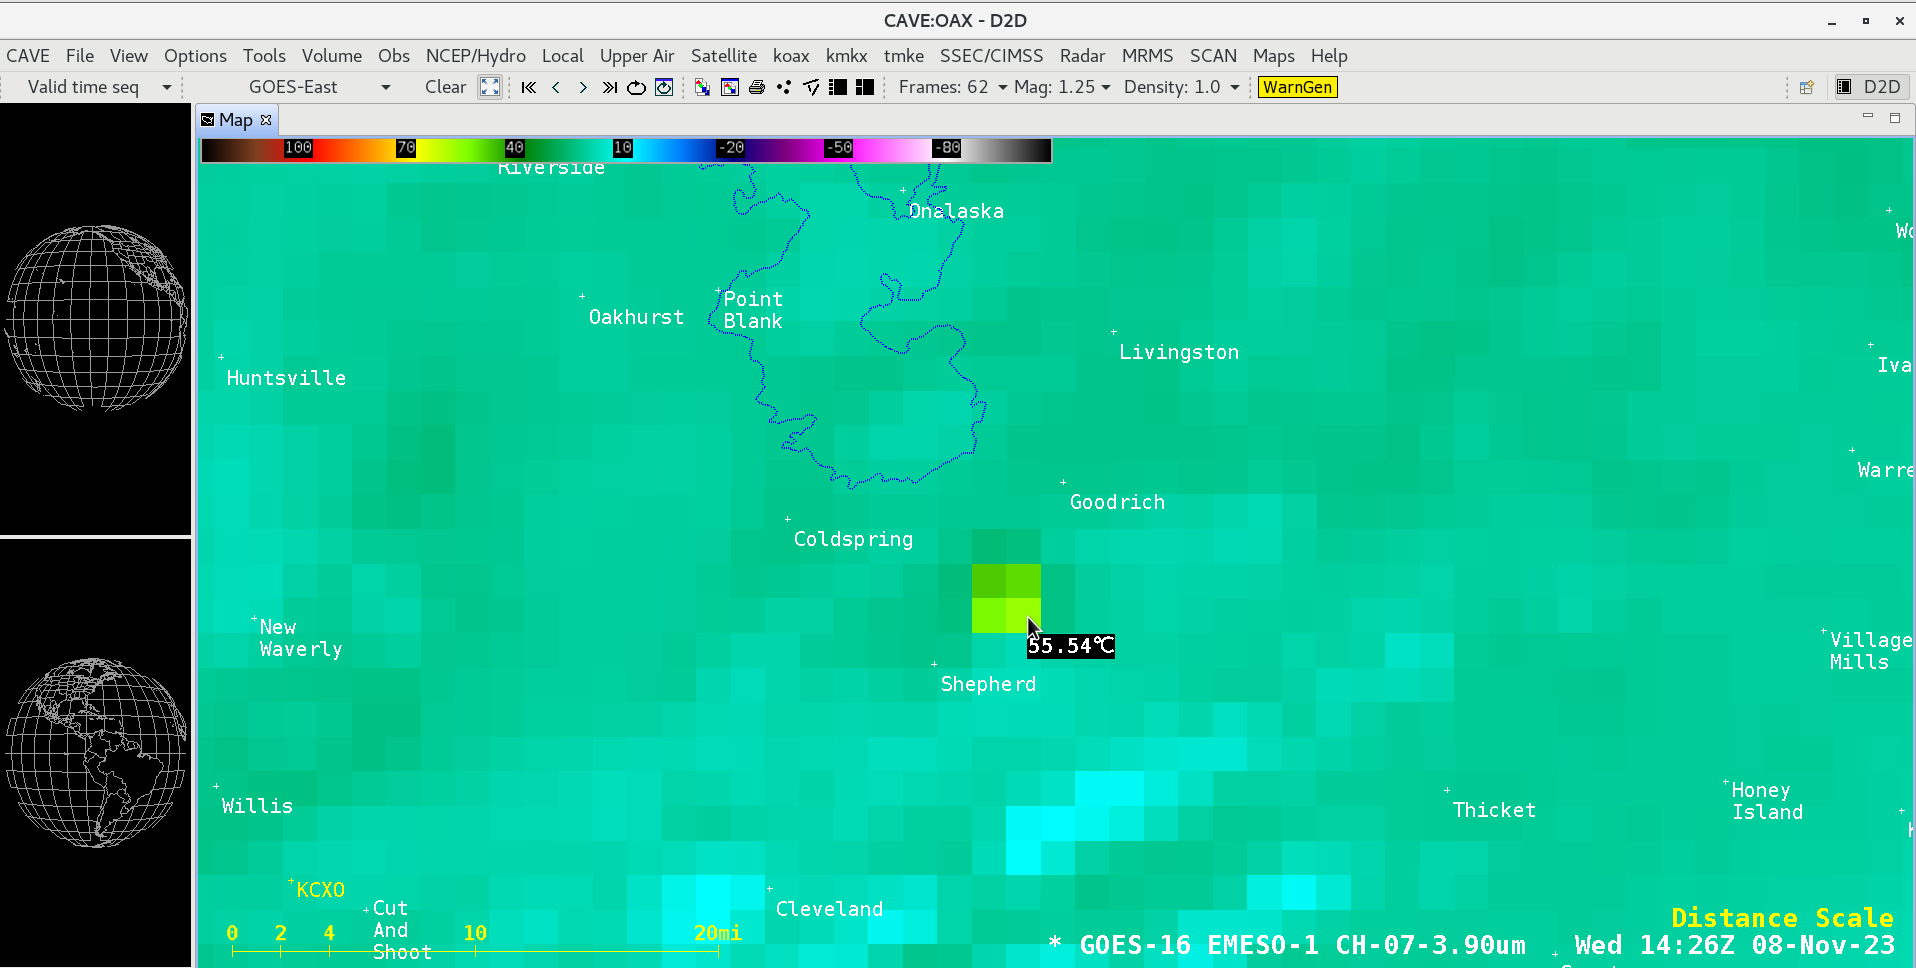
The FDCA first identified a Processed Fire at 1420 UTC — and the peak Fire Power value of 171.65 MW occurred 6 minutes later (above). The maximum Shortwave Infrared (3.9 µm) brightness temperature of 55.54ºC also occurred at 1426 UTC (below).
GOES-16 Shortwave Infrared (3.9 µm) image at 1426 UTC, with a cursor sample of the 3.9 µm infrared brightness temperature [click to enlarge]
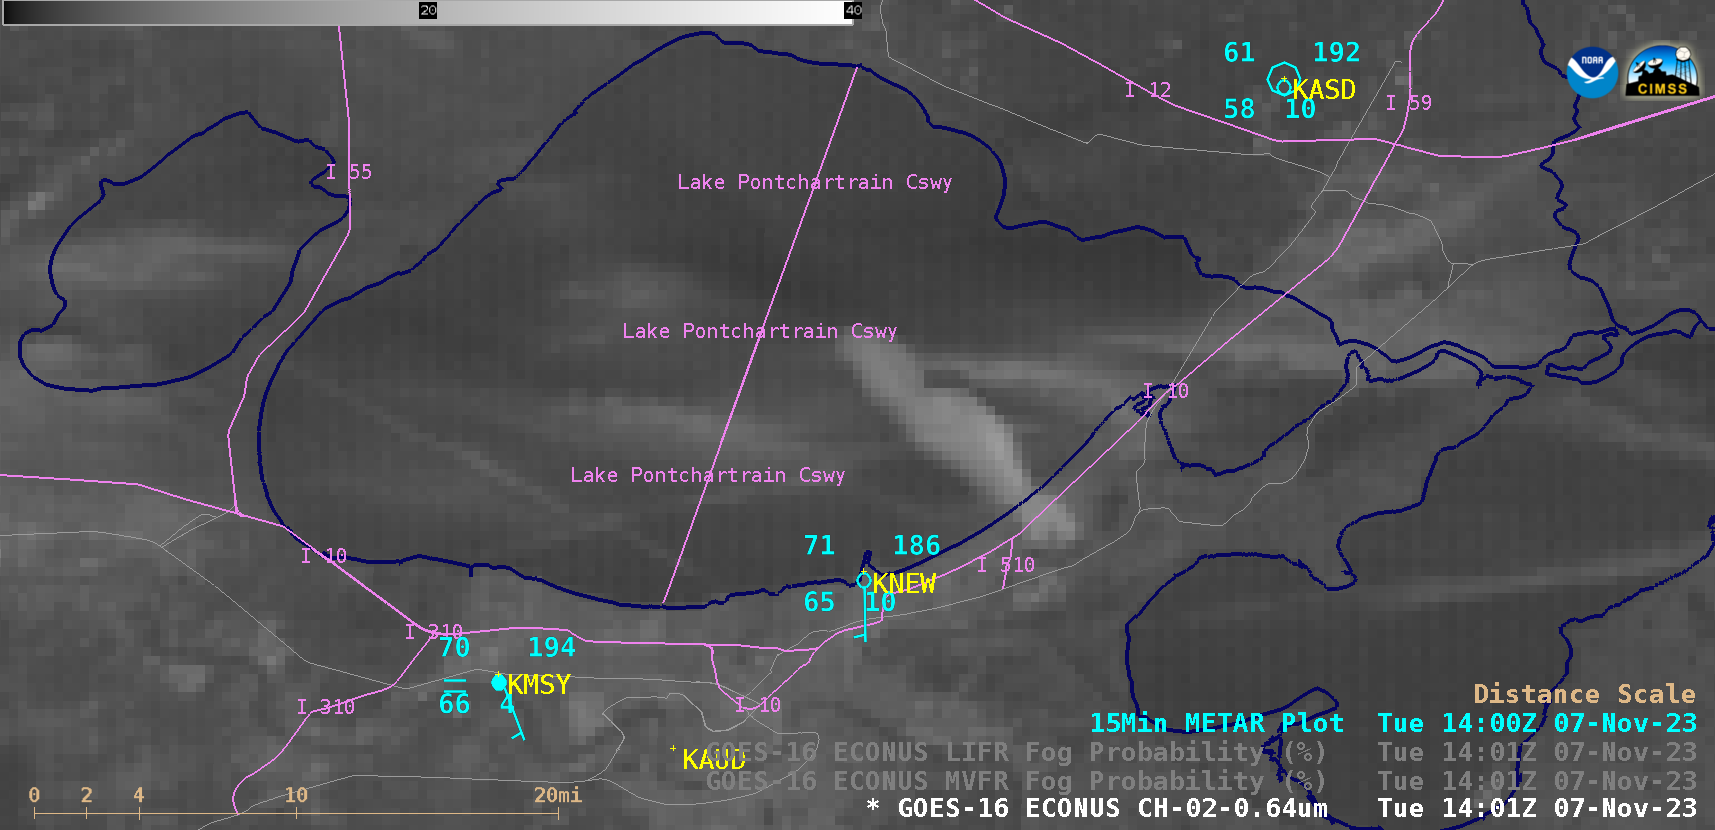
GOES-16 (GOES-East) “Red” Visible (0.64 µm) images (above) showed a narrow (2-4 miles in width) plume of smoke+fog — the smoke was from a marsh fire burning near New Orleans East — that was moving to the northwest across Lake Pontchartrain after sunrise on 07 November 2023. This dense smoke+fog plume rapidly reduced... Read More
GOES-16 “Red” Visible (0.64 µm) images, from 1231 UTC to 1601 UTC [click to play animated GIF | MP4]
GOES-16 (GOES-East) “Red” Visible (0.64 µm) images (above) showed a narrow (2-4 miles in width) plume of smoke+fog — the smoke was from a marsh fire burning near New Orleans East — that was moving to the northwest across Lake Pontchartrain after sunrise on 07 November 2023. This dense smoke+fog plume rapidly reduced visibility along a portion of Interstate 10, resulting in several accidents (media report).
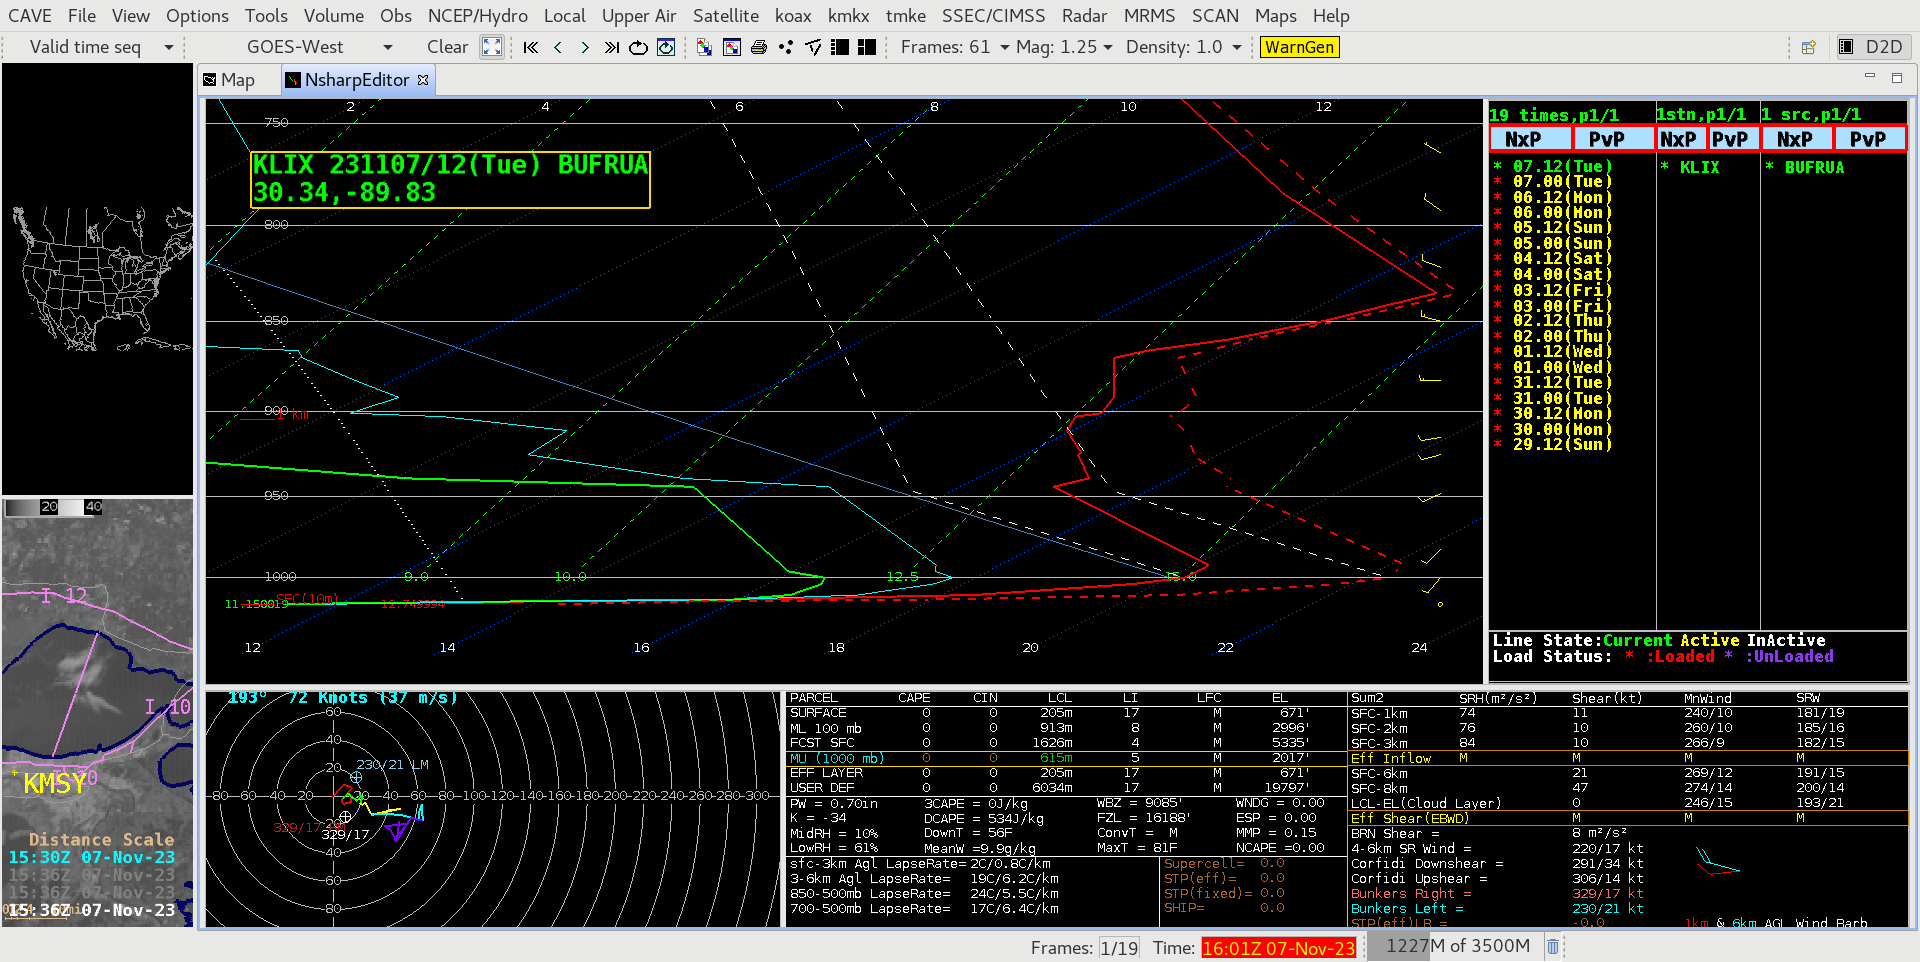
A plot of rawinsonde data from New Orleans at 1200 UTC (below) indicated that there was a pronounced and very shallow temperature inversion just above the surface, which was trapping the dense wildfire smoke+fog near the surface and preventing its vertical dispersion (until a few hours after sunrise, when boundary layer mixing began to increase).
Plot of rawinsonde data from New Orleans at 1200 UTC [click to enlarge]
===== 08 Nov Update =====
GOES-16 Nighttime Microphysics RGB and daytime “Red” Visible (0.64 µm) images, from 1026 UTC to 1631 UTC [click to play animated GIF | MP4]
On the following day, GOES-16 Nighttime Microphysics RGB and daytime Visible images (above) showed another smoke+fog plume, which persisted long enough after sunrise to impact traffic along the Lake Pontchartrain Causeway. Prior to sunrise, Nighttime Microphysics RGB imagery revealed the plume thickening near New Orleans East and beginning to move NW across the lake — and around 1100 UTC, I-10 and I-510 in that vicinity were proactively closed for several hours until visibility improved.
Unlike the previous day — when a veil of high clouds frequently prevented a view of low clouds/fog — a more distinct fog signature was seen in GOES-16 Night Fog Difference images (below).
GOES-16 Night Fog Difference (11.2-3.9 µm) images, from 1001-1236 UTC [click to play animated GIF | MP4]


_lifts_off_with_GOES-N.jpg)