This website works best with a newer web browser such as Chrome, Firefox, Safari or Microsoft
Edge. Internet Explorer is not supported by this website.
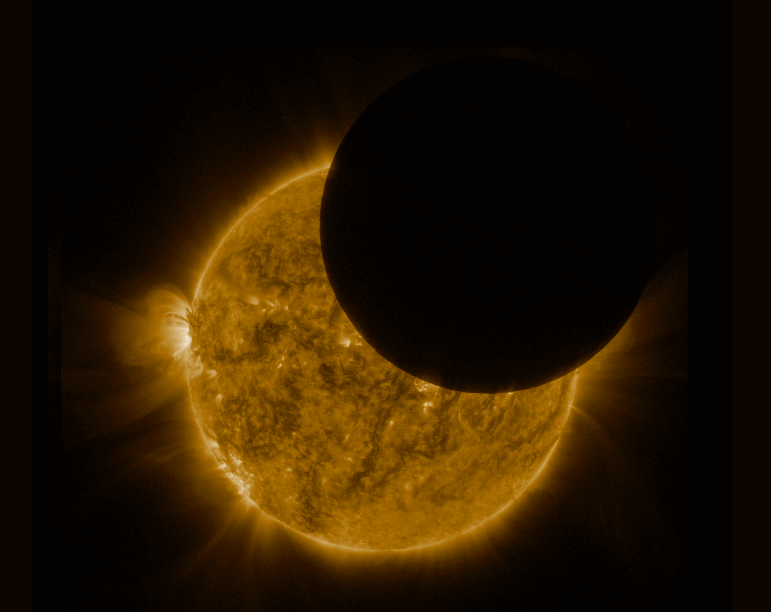
The Solar Ultraviolet Imager (SUVI) on GOES East captured a partial solar eclipse during the new moon on November 13th. But the moon’s shadow didn’t reach Earth. Why’s that?Solar eclipses are only possible when the new moon occurs near the nodes of the lunar orbit, which is where the... Read More
Moon’s orb transiting the Sun captured by the GOES-16 Solar Ultraviolet Imager (SUVI). Credit: Rick Kohrs
The Solar Ultraviolet Imager (SUVI) on GOES East captured a partial solar eclipse during the new moon on November 13th. But the moon’s shadow didn’t reach Earth. Why’s that?
Solar eclipses are only possible when the new moon occurs near the nodes of the lunar orbit, which is where the moon’s path intersects with the Sun-Earth ecliptic plane. This alignment makes it possible for the moon’s shadow to reach Earth’s surface and cause an eclipse.
Lunar nodes only align with the Sun-Earth line twice a year. The time on either side of that alignment is often called an “eclipse season.”
Turns out geosynchronous satellites, which orbit Earth 22 thousand miles above the equator (several Earth diameters high) can pass through the lunar shadow during an eclipse season without the moon’s shadow reaching Earth, essentially meaning satellites have longer eclipse seasons than Earth.
Monday November 13 marked one lunar cycle since the October annular eclipse on Earth, so SUVI was within an extended satellite eclipse season and able to track the moon transiting the Sun from geostationary orbit.
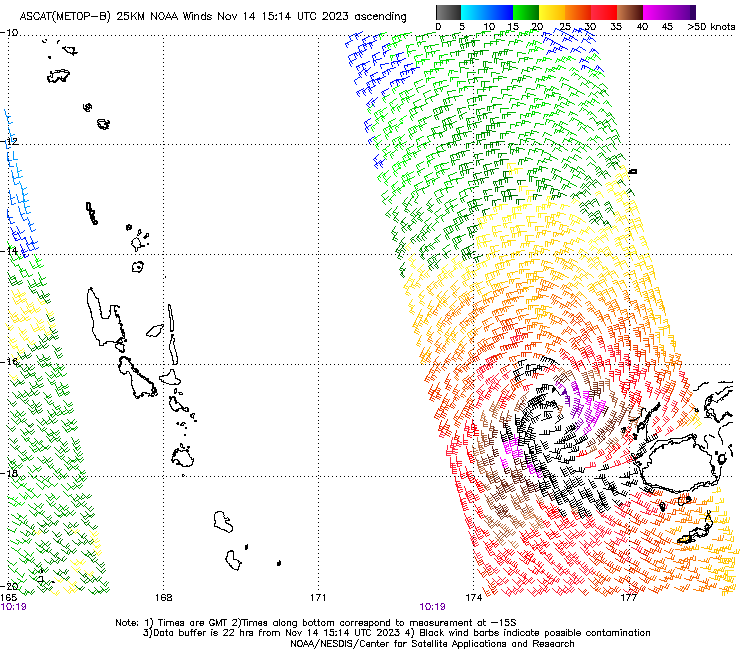
Metop-B and Metop-C both overflew Tropical Storm Mal as it approached the island of Fiji on 14 November. The toggle above shows the two wind plots from this website, MetopC from 0933 UTC and MetopB from 1013 UTC. The two swaths show the center of the storm moving southeast, skirting the main islands of Fiji. A shortcoming... Read More
Advanced Scatterometer (ASCAT) observations near Fiji, 0933 and 1013 UTC on 14 November 2023 (Click to enlarge)
Metop-B and Metop-C both overflew Tropical Storm Mal as it approached the island of Fiji on 14 November. The toggle above shows the two wind plots from this website, MetopC from 0933 UTC and MetopB from 1013 UTC. The two swaths show the center of the storm moving southeast, skirting the main islands of Fiji. A shortcoming of ASCAT winds in tropical cyclones occurs when winds exceed 40 knots; the wind (and rain) perturbs the ocean surface sufficiently at those speeds to change the backscatter of microwave radiation back to the satellite. Still, ASCAT gives a good overall view of the outer wind fields, including where gales are occurring and where the circulation center sits.
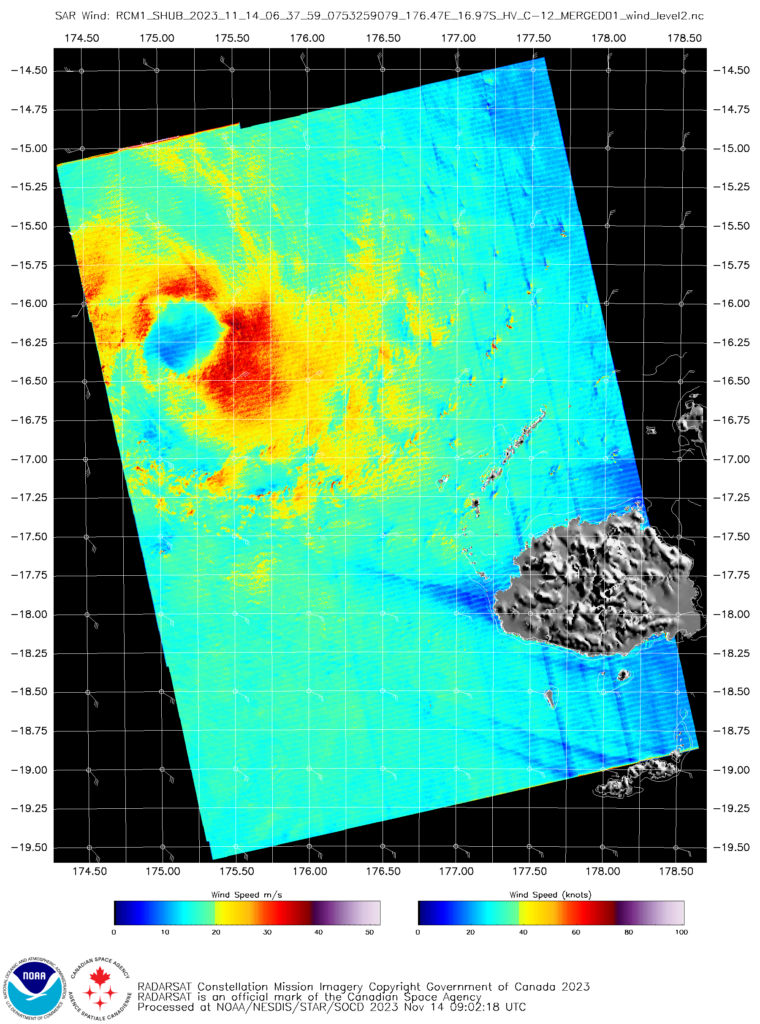
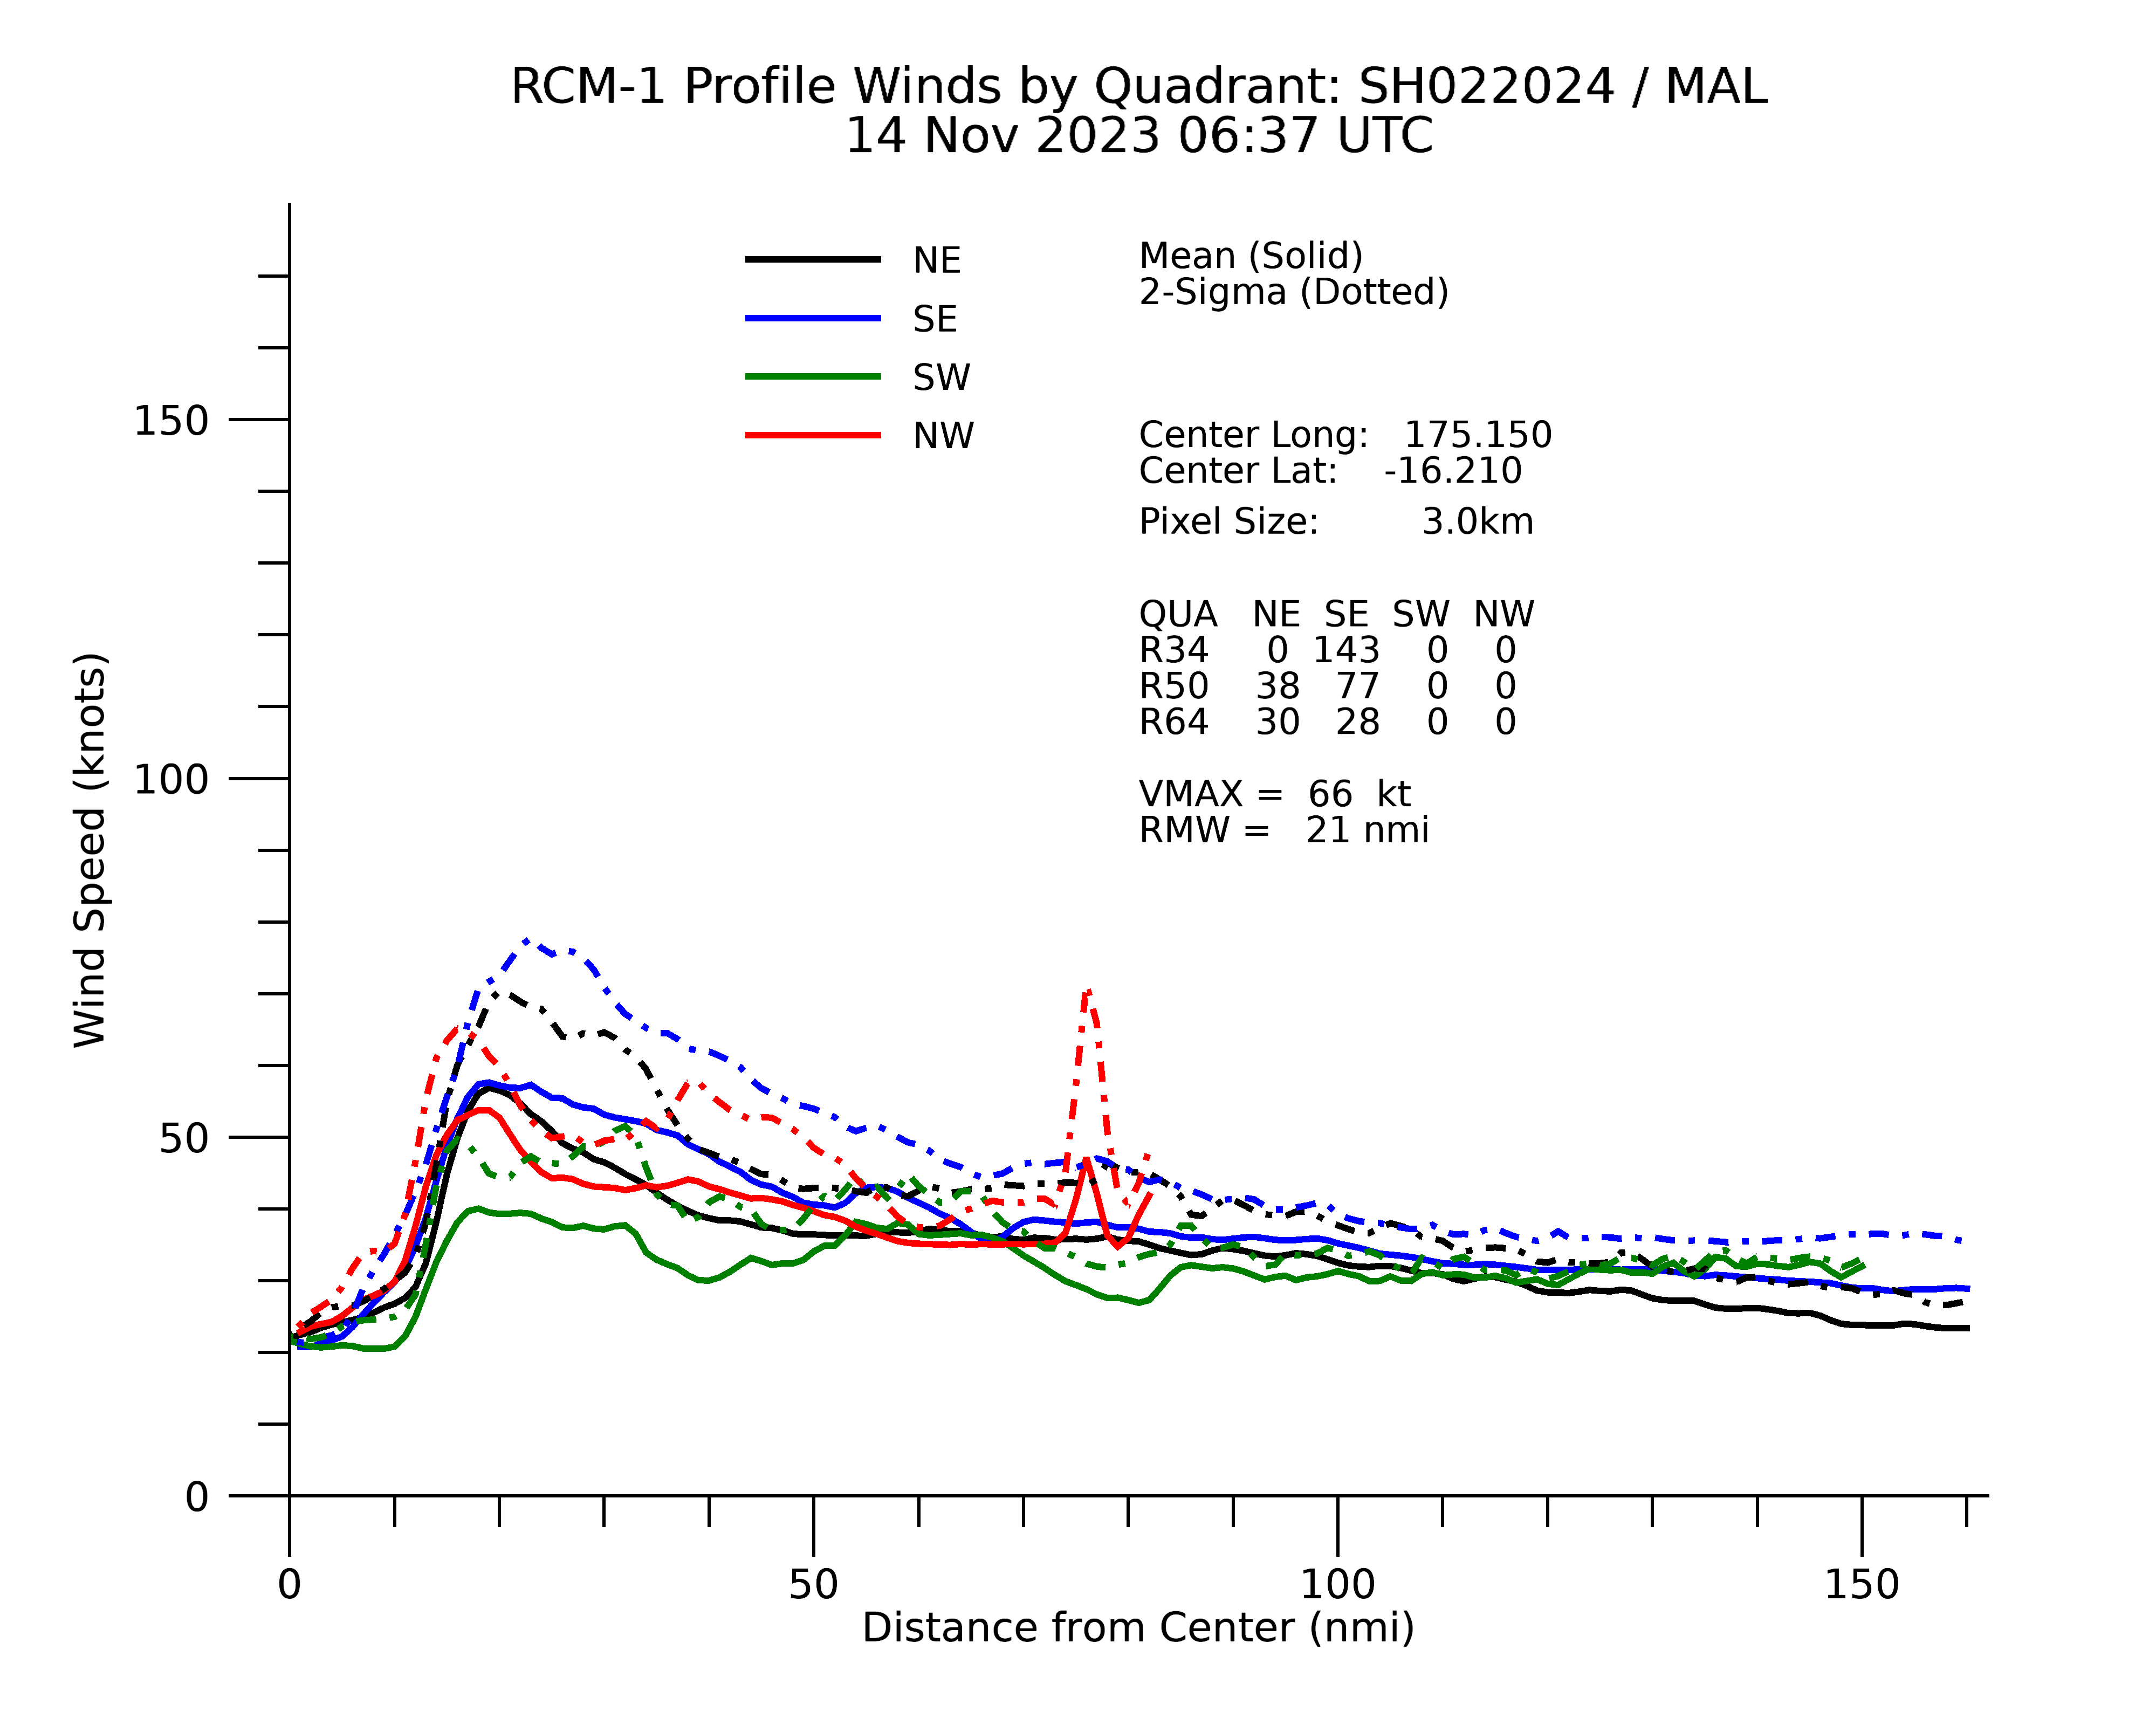
RCM-1 (Radar Constellation Mission-1) overflew Mal at 0637 UTC on 14 November, and the Synthetic Aperture Radar (SAR) wind field from that is shown below (source). The wind analysis from the SAR data (here) suggests that the SW quadrant of the storm has the weakest winds. The blocking effect of the terrain from both Viti Levu (the largest island in the Republic of Fiji) and the Kadavu Islands is apparent in the imagery below, with weaker east-southeast winds in the lee of the islands.
RCM-1 SAR Winds over Tropical Storm Mal, 0637 UTC on 14 November 2023 (Click to enlarge)
The toggle below compares the SAR winds with the GOES-18 Clean Window infrared (Band 13, 10.35 µm) imagery. There is a significant parallax shift in the infrared imagery; the Republic of Fiji is just east of the dateline, and GOES-West is overhead at the Equator at 137.2oW. The SAR-derived storm center is likely nearer to the center of the very cold clouds.
GOES-18 Band 13 infrared (10.35 µm) imagery and RCM-1 SAR Winds over Tropical Storm Mal, 0637 UTC on 14 November 2023 (Click to enlarge)
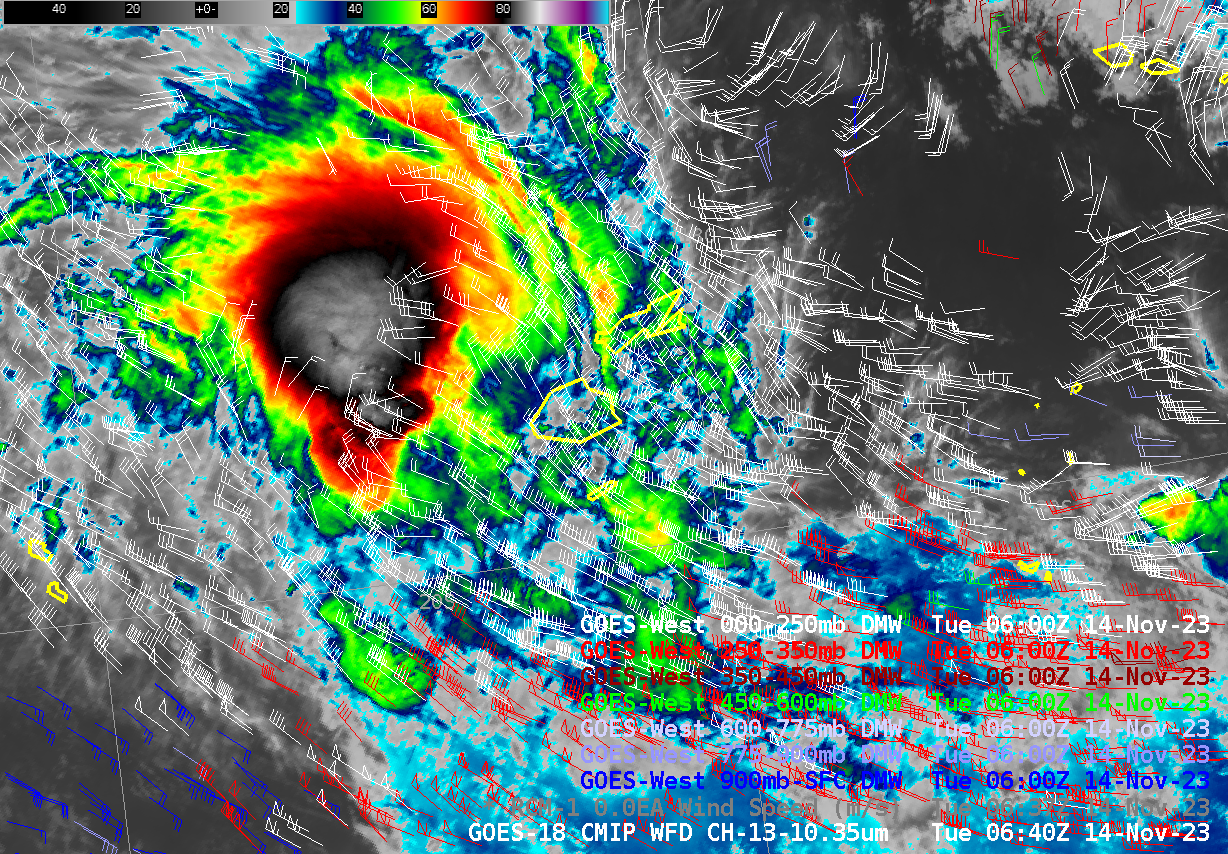
Satellite-derived winds are available hourly from GOES-18, and they are shown below. In the vicinity of Mal, only high-level winds can be generated, because only high-level cloud features can be tracked. The structure of Mal is acting as a blocking feature, and upper-level winds are diverted around it. In addition, a poleward outflow jet is apparent to the east and southeast of the storm. Note also the very strong shear at the southern edge of the domain. Low-level winds (in blue) are flowing in an opposite direction to the upper-level winds (in white).
GOES-18 Band 13 (10.35 µm) imagery, 0640 UTC and Derived Motion winds, 0600 UTC on 14 November 2023 (Click to enlarge)
A second SAR observation, this time from RCM-3, occurred at 1757 UTC. The toggle below shows the change in the infrared imagery between the two SAR observation times, one at 0640, one at 1750 UTC. The development of outer bands in the storm is most notable, as is the appearance of an eye-like structure at 1750 UTC.
GOES-18 Band 13 (10.35 µm) imagery, 0640 UTC and 1750 UTC on 14 November 2023 (Click to enlarge)GOES-18 Band 2 visible (0.64 µm) and Band 13 infrared (10.35 µm) imagery and RCM-3 SAR Winds over Tropical Storm Mal, 1750 UTC on 14 November 2023 (Click to enlarge)
By 1750 UTC, SAR winds show a significantly strengthened system southwest of Fiji. A circular eye that is more symmetric is apparent in the SAR imagery, and hints of an eye are starting to develop in the GOES-18 imagery. Note that the GOES-18 Visible imagery has been brightened (0-30 vs. the default 0-130) in this near-sunrise image. (Here is a toggle of the RCM-1/RCM-2 SAR Winds).
MIMIC Total Precipitable Water fields over the south Pacific near Fiji and Australia, above (source), show the development of a cyclonic circulation in between the ITCZ and SPCZ that moves southward as Cyclone Mal. Some dry air is diagnosed to impinge on the northern part of the storm at the... Read More
Total Precipitable Water fields 0000 UTC 10 November – 1700 UTC 13 November 2023 (Click to enlarge)
MIMIC Total Precipitable Water fields over the south Pacific near Fiji and Australia, above (source), show the development of a cyclonic circulation in between the ITCZ and SPCZ that moves southward as Cyclone Mal. Some dry air is diagnosed to impinge on the northern part of the storm at the end of the animation.
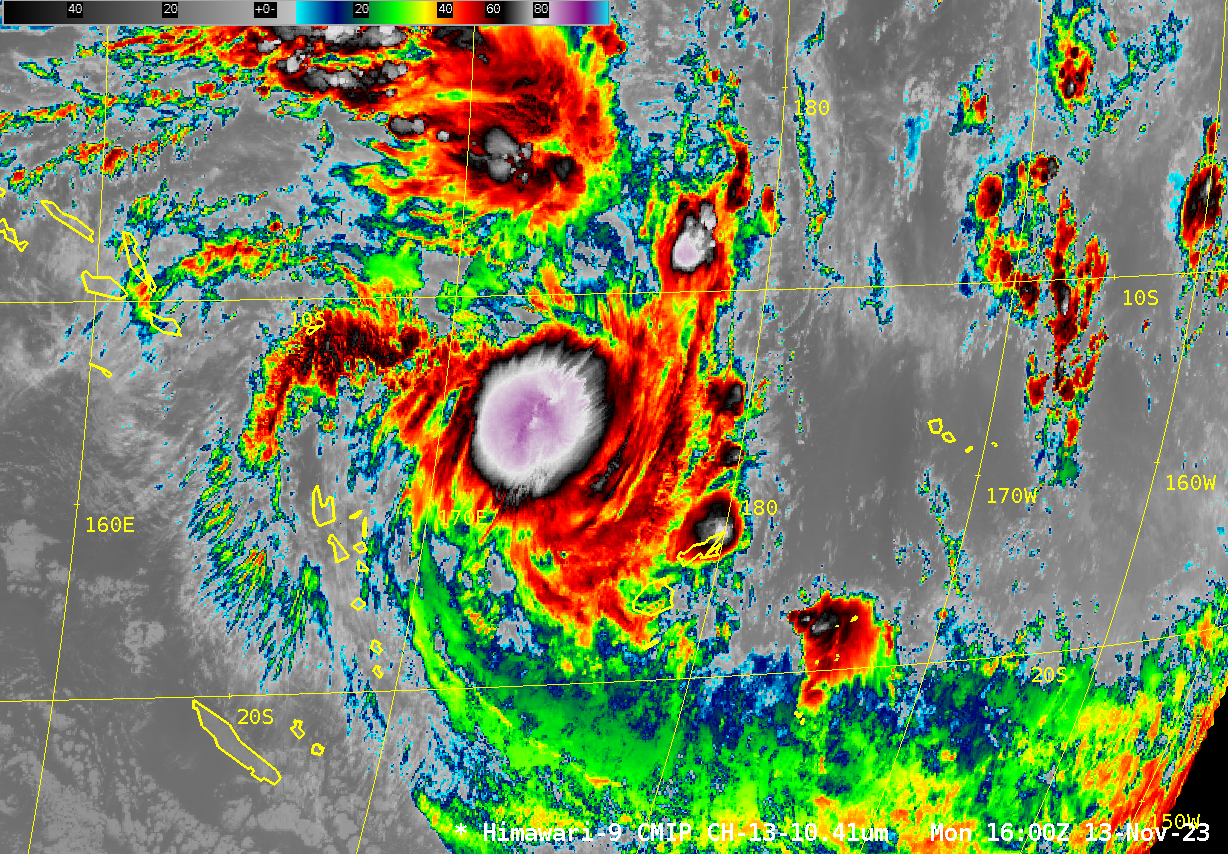
Himawari-9 Clean Window infrared (10.4) imagery, below, shows the development of a very cold Central Dense Overcast (CDO) by 1600 UTC, with brightness temperatures (violet in the enhancement used) between -85oC and -90oC.
Himawari-9 Clean Window (Band 13, 10.4 µm) infrared imagery, hourly from 0000 UTC to 1600 UTC on 13 November 2023 (Click to enlarge)
A closer look at 10-minute Himawari-9 Infrared images (below) revealed that cloud-top 10.4 µm brightness temperatures within the CDO were as cold as -96ºC (darker gray pixels embedded within the interior yellow-enhanced region) at 1450 UTC.
JMA Himawari-9 “Clean” Infrared Window (10.4 µm) images, from 1130 UTC to 1800 UTC on 13 November (courtesy Scott Bachmeier, CIMSS) [click to play animated GIF | MP4]
What are shear values like around Mal? The animation below, taken from the SSEC/CIMSS Tropical Weather website (direct link) shows modest amounts of shear over the storm, with significantly more shear to the south.
Diagnosed 850-200 mb shear, 0300-1800 UTC on 13 November 2023 (Click to enlarge)
Morphed microwave imagery (source), below, shows a slow organization of the storm with vigorous convection surrounding about half the eye by 1900 UTC.
Morphed Microwave Imagery at CIMSS (MIMIC) fields around Mal, 0000 – 1900 UTC on 13 November 2023 (click to enlarge)
The AMSU 89-GHz field at 0952 UTC on 13 November, below (source), also shows evidence of strong convection (i.e., cold brightness temperatures caused by strong scattering of 89 GHz energy by ice) near the storm center.
89-GHz imagery, 0952 UTC on 13 November 2023 (Click to enlarge)
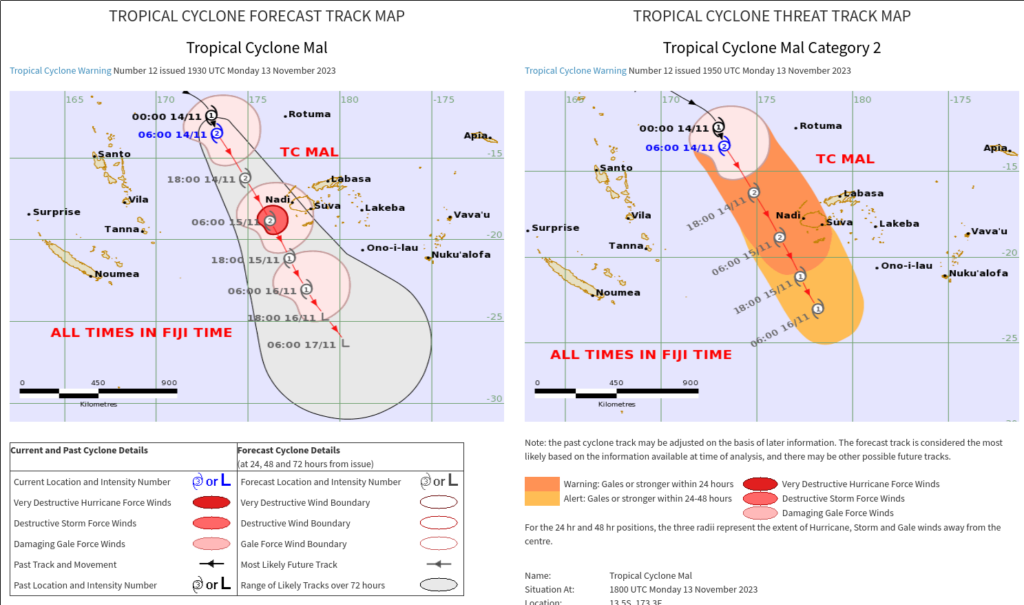
For more information on Mal, refer to the CIMSS Tropical Website for this storm (link), or to the Fiji RSMC. The forecast for the storm from JTWC (here), shows intensification through 1200 UTC 14 November, and a path that takes the storm very close to Fiji. The forecast graphic from Fiji is shown below, showing something similar to the JTWC graph. Note the times on the graphic below are Fiji Standard time, i.e., UTC + 12.
Tropical Cyclone Mal forecast track and threats, issued 1900 UTC on 13 November 2023 (Click to enlarge)24 frames of Tropical Cyclone Mal every hour, from 2023-11-12 at 2100Z to 2023-11-13 at 2100Z. Imagery is from Japan’s Advanced Himawari Imager. Both true color imagery and Band 9 mid-level water vapor imagery are show. Users can recreate this animation in RealEarth.
Users can view Mal using RealEarth such as in the example above, provided by Alexa Ross, SSEC/CIMSS, that shows true color imagery and Band 9 mid-level water vapor infrared (6.95 µm) imagery from Japan’s Advanced Himawari Imager (AHI).
10-minute Full Disk GOES-16 (GOES-East) “Red” Visible (0.64 µm), Shortwave Infrared (3.9 µm) and “Clean” Infrared Window (10.3 µm) images (above) showed that a wildfire complex in southern Brazil produced a series of 4-5 pyrocumulonimbus (pyroCb) clouds on 13 November 2023. The coldest pyroCb cloud-top 10.3 µm brightness temperature was -74.4ºC at 1530 UTC.Regarding the wildfire... Read More
GOES-16 “Red” Visible (0.64 µm, left), Shortwave Infrared (3.9 µm, center) and “Clean” Infrared Window (10.3 µm, right) images, from 1200 UTC to 1900 UTC on 13 November [click to play animated GIF | MP4]
10-minute Full Disk GOES-16 (GOES-East) “Red” Visible (0.64 µm), Shortwave Infrared (3.9 µm) and “Clean” Infrared Window (10.3 µm) images (above) showed that a wildfire complex in southern Brazil produced a series of 4-5 pyrocumulonimbus (pyroCb) clouds on 13 November 2023. The coldest pyroCb cloud-top 10.3 µm brightness temperature was -74.4ºC at 1530 UTC.
GOES-16 Fire Mask (top left), Fire Power (top right), Fire Area (bottom left) and Fire Temperature (bottom right) derived products [click to play animated GIF | MP4]
Regarding the wildfire complex that produced those pyroCb clouds, the 4 components of the GOES-16 Fire Detection and Characterization Algorithm (FDCA) are shown above — and a larger-scale view of the Fire Mask component is shown below.
GOES-16 Fire Mask derived product [click to play animated GIF | MP4]
A blend of GOES-16 Shortwave Infrared and “Clean” Infrared Window images with an overlay of GLM Group Points — created using RealEarth — revealed that there were periods of significant lightning activity associated with the largest pyroCb cloud as it drifted southward away from the large wildfire complex.
Blend of GOES-16 Shortwave Infrared (3.9 µm) and “Clean” Infrared Window (10.3 µm) images, with an overlay of GLM Group Points, from 1200 UTC to 1900 UTC on 13 November [click to play animated GIF | MP4]
This is likely the fourth confirmed case of a South American pyroCb — in addition, it’s one of the very few pyroCb events documented so far in the tropics.
