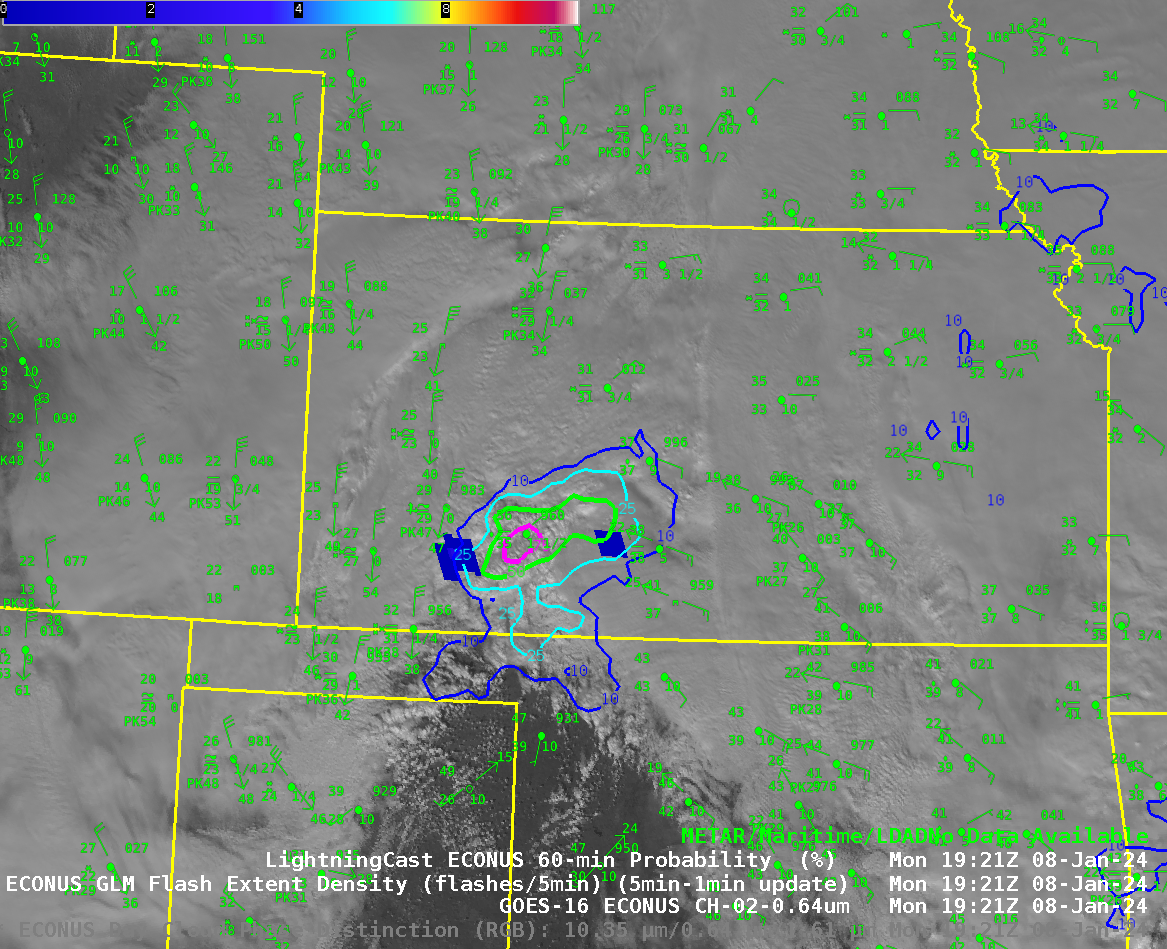
This website works best with a newer web browser such as Chrome, Firefox, Safari or Microsoft Edge. Internet Explorer is not supported by this website.

NWS Fairbanks issues a record 13 Severe Thunderstorm Warnings in a single day

GOES-18 (GOES-West) “Clean” Infrared Window (10.3 µm) and “Red” Visible (0.64 µm) images (above) included plots of the 15 Severe Thunderstorm Warning polygons issued by NWS Fairbanks on 07 July 2023 — which was a record number of warnings issued by that forecast office for a single calendar day. The coldest cloud-top 10.3... Read More

GOES-18 “Clean” Infrared Window (10.3 µm) and “Red” Visible (0.64 µm) images, with Severe Thunderstorm Warning polygons plotted in yellow [click to play animated GIF | MP4]

GOES-18 (GOES-West) “Clean” Infrared Window (10.3 µm) and “Red” Visible (0.64 µm) images (above) included plots of the 15 Severe Thunderstorm Warning polygons issued by NWS Fairbanks on 07 July 2023 — which was a record number of warnings issued by that forecast office for a single calendar day. The coldest cloud-top 10.3 µm infrared brightness temperatures were -51C — which corresponded to an altitude around 36,000 feet, according to 0000 UTC rawinsonde data from Fairbanks (below).

Plot of rawinsonde data from Fairbanks at 0000 UTC on 08 July [click to enlarge]


GOES-18 “Clean” Infrared Window (10.3 µm) image at 0410 UTC [click to enlarge]

Recall that when viewing geostationary imagery at high latitudes, parallax must be taken into account — for example, the cold overshooting top east of Fort Yukon seen on the 0410 UTC image (above) was actually located over a point about 35 km (22 miles) to the south-southeast (below), placing it closer to Circle.

GOES-18 parallax correction vector (green) and magnitude (in km, red) for a cloud-top feature at a height of 9.1 km (30,000 feet) [click to enlarge]

In GOES-18 Day Cloud Phase Distinction RGB images (below), developing cumulus clouds that were beginning to glaciate exhibited shades of green. Given that many of these thunderstorms occurred in rather remote areas, verification was difficult — but there was one report of tree damage in Chalkyitsik.

GOES-18 Day Cloud Phase Distinction RGB images, with Severe Thunderstorm Warnings plotted in yellow [click to play animated GIF | MP4]

View only this post Read Less

Pyrocumulonimbus clouds created by a wildfire complex in British Columbia

GOES-18 (GOES-West) Day Land Cloud Fire RGB, Shortwave Infrared (3.9 µm), “Clean” Infrared Window (10.3 µm) and Near-Infrared “Vegetation” (0.86 µm) images with an overlay of the Fire Power derived product (a component of the GOES Fire Detection and Characterization Algorithm FDCA) (above) showed that the Hossitl Creek wildfire complex northeast of Fort Nelson (CYYE) — in far northeastern British Columbia... Read More

GOES-18 Day Land Cloud Fire RGB (top left), Shortwave Infrared (3.9 µm, top right), “Clean” Infrared Window (10.3 µm, bottom left) and Near-Infrared “Vegetation” (0.86 µm) + Fire Power derived product (bottom right) [click to play animated GIF | MP4]

GOES-18 (GOES-West) Day Land Cloud Fire RGB, Shortwave Infrared (3.9 µm), “Clean” Infrared Window (10.3 µm) and Near-Infrared “Vegetation” (0.86 µm) images with an overlay of the Fire Power derived product (a component of the GOES Fire Detection and Characterization Algorithm FDCA(above) showed that the Hossitl Creek wildfire complex northeast of Fort Nelson (CYYE) — in far northeastern British Columbia (and far southwestern Northwest Territories) — produced a pair of pyrocumulonimbus (pyroCb) clouds on 05 July 2023. Strong northeasterly winds in the wake of a cold frontal passage likely played a role in the rapid flare-up of ongoing fires (and the subsequent pyroCb development).

The thermal signature of active wildfires along the southern perimeter of the complex was either partially or completely masked by clouds much of the time, but one fire did exhibit 3.9 µm brightness temperatures as hot as 76.1ºC and Fire Power values as high as 1550.7 MW (both occurring at 2010 UTC). The pyroCB clouds exhibited cloud-top 10.3 µm infrared brightness temperatures as cold as -54.54ºC at 0110 UTC — at that same time/location, the CIMSS-derived CLAVR-x Cloud Top Temperature was -58.27ºC, with a corresponding Cloud Top Height of 40,266.81 feet (below).

Cursor sampling of GOES-18 “Clean” Infrared Window (10.3 µm) brightness temperature, CLAVR-x Cloud Top Temperature and CLAVR-x Cloud Top Height (bottom left image panel) [click to enlarge]

In GOES-18 True Color RGB images from the CSPP GeoSphere site (below), shades of tan to light brown helped to identify the smoke-laden anvil of the pyroCb clouds as they merged and drifted southeastward across the British Columbia / Alberta border.

GOES-18 True Color RGB images [click to play MP4 animation]

View only this post Read Less

Actinoform cloud produces light rain in Hawai`i

GOES-18 (GOES-West) Nighttime Microphysics RGB and daytime True Color RGB images from the CSPP GeoSphere site (above) displayed the cyclonic circulation of an actinoform cloud feature as it moved westward toward Hawai`i on 03 July 2023.A closer view using GOES-18 “Red” Visible (0.64 µm) and Day Cloud Phase Distinction RGB images (below) showed the actinoform cloud as it... Read More

GOES-18 Nighttime Microphysics RGB and daytime True Color RGB images [click to play MP4 animation]

GOES-18 (GOES-West) Nighttime Microphysics RGB and daytime True Color RGB images from the CSPP GeoSphere site (above) displayed the cyclonic circulation of an actinoform cloud feature as it moved westward toward Hawai`i on 03 July 2023.

A closer view using GOES-18 “Red” Visible (0.64 µm) and Day Cloud Phase Distinction RGB images (below) showed the actinoform cloud as it approached the island of Oahu. 15-minute METAR surface reports revealed that one of the actinoform’s “spiral bands” produced brief (20-30 minute) periods of light rain and/or drizzle — first at Kaneohe Bay (PHNG) beginning around 0201 UTC, and then at Wheeler Air Force Base (PHHI) beginning around 0331 UTC — as it passed over the island.

GOES-18 “Red” Visible (0.64 µm) and Day Cloud Phase Distinction RGB images [click to play animated GIF | MP4]

According to the Day Cloud Phase Distinction RGB Quick Guide, shades of green generally denote cloud tops that are beginning to glaciate — but in this case, a GOES-18 Day Cloud Phase Distinction RGB image at 2301 UTC (below) included cursor-sampled values of RGB components along with the corresponding Cloud Top Phase and Cloud Top Height derived products at that same location. Since cloud-top 10.3 µm infrared brightness temperatures at that cursor location were quite warm (15.27ºC), derived products indicated that the Cloud Top Phase was Water (as opposed to a Mixed water/ice phase, which is often associated with cloud features exhibiting similar shades of green in this particular RGB).

GOES-18 Day Cloud Phase Distinction RGB image at 2301 UTC, with cursor-sampled values of RGB components along with the corresponding Cloud Top Phase and Cloud Top Height derived products [click to enlarge]

AWIPS Users: a variety of GOES RGB types combined with Derived Product Readouts is available under the Satellite -> Local Menu Items menu (below).

GOES RGBs with Derived Product Readouts menu structure [click to enlarge]

View only this post Read Less

Derecho damage swath in southern Nebraska

GOES-16 (GOES-East) Near-Infrared “Vegetation” (0.86 µm), Vegetation Channel Difference (0.64 µm – 0.86 µm), Day Land Cloud RGB and CIMSS Natural Color RGB images (above) showed a west-to-east oriented damage swath across Furnas and Harlan counties in far southern Nebraska n 02 July 2023  — which resulted from wind-driven large hail (wind gusts to 70 mph, hail up to... Read More

GOES-16 Near-Infrared “Vegetation” (0.86 µm), Vegetation Channel Difference (0.64 µm – 0.86 µm), Day Land Cloud RGB and CIMSS Natural Color RGB images [click to play animated GIF | MP4]

GOES-16 (GOES-East) Near-Infrared “Vegetation” (0.86 µm), Vegetation Channel Difference (0.64 µm – 0.86 µm), Day Land Cloud RGB and CIMSS Natural Color RGB images (above) showed a west-to-east oriented damage swath across Furnas and Harlan counties in far southern Nebraska n 02 July 2023  — which resulted from wind-driven large hail (wind gusts to 70 mph, hail up to 3.00 inches in diameter: Local Storm Reports) 3 days earlier during the 28-29 June Derecho event.

GOES-16 Rayleigh-scattering-corrected True Color RGB images from the CSPP GeoSphere site (below) provided a higher-contrast view of the damage swath, which exhibited shades of tan (in contrast to the predominantly greener appearance of adjacent healthy vegetation and fields of crops).

GOES-16 True Color RGB images [click to play MP4 animation]

The derecho damage swath also showed up well in a toggle between Suomi-NPP VIIRS True Color RGB and False Color RGB images valid at 1932 UTC (below). Data used to create the VIIRS images were downloaded and processed by the SSEC/CIMSS Direct Broadcast ground station.

Suomi-NPP VIIRS True Color RGB and False Color RGB images valid at 1932 UTC [click to enlarge]

1-minute Mesoscale Domain Sector GOES-16 “Clean” Infrared Window (10.3 µm) images just after local midnight on 29 June (below) inc\luded time-matched (+/- 3 minutes) SPC Storm Reports plotted in white — which showed the reports of wind/hail responsible for the Furnas/Harlan county damage swath seen on 02 July.

GOES-16 “Clean” Infrared Window (10.3 µm) images, with time-matched SPC Storm Reports plotted in white; Furnas and Harlan counties are outlined in cyan [click to play animated GIF | MP4]

View only this post Read Less