GOES-16 “Clean” Infrared Window (10.3 µm) images centered over north-central Illinois, with an overlay of GLM Flash Extent Density and plots of 15-minute METAR surface reports from 0701 UTC to 1316 UTC [click to play animated GIF | MP4]
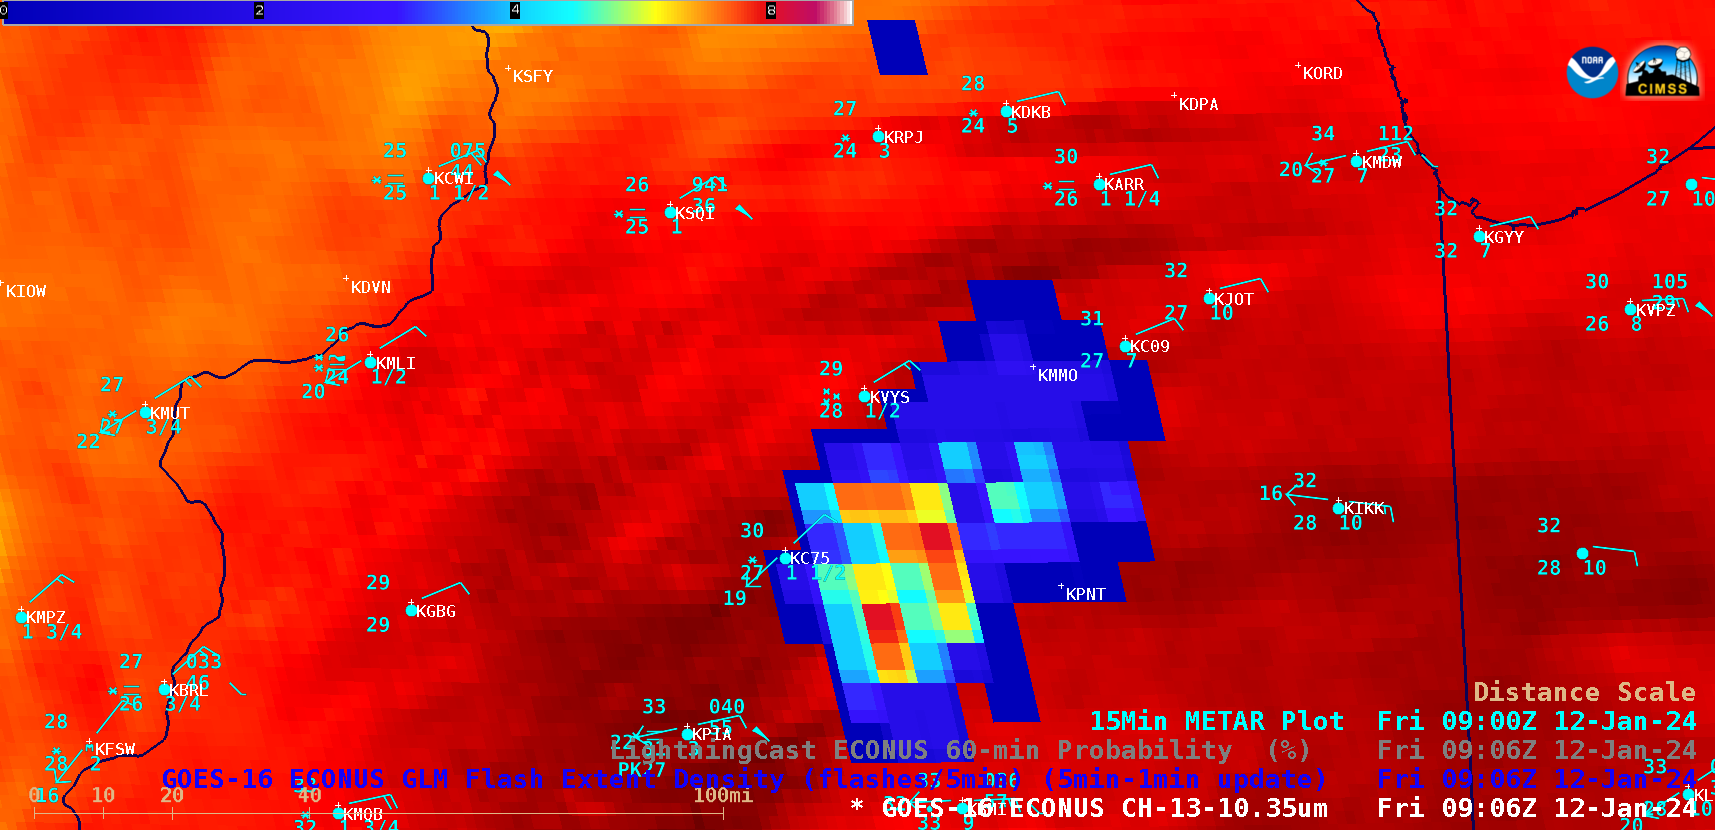
GOES-16 Infrared + Flash Extent Density images that also included contours of LightningCast Probability (below) showed that the LightningCast tool generally performed fairly well, with probability values frequently in the 25-50% range in advance of many of the larger Flash Extent Density episodes across Illinois.
GOES-16 “Clean” Infrared Window (10.3 µm) images centered over north-central Illinois, with an overlay of GLM Flash Extent Density, contours of LightningCast Probability and plots of 15-minute METAR surface reports [click to play animated GIF | MP4]
GOES-16 “Red” Visible (0.64 µm, top) and “Clean” Infrared Window (10.3 µm, bottom) images centered over the Chicago area, with an overlay of GLM Flash Extent Density and plots of 15-minute METAR surface reports [click to play animated GIF | MP4]
GOES-16 “Red” Visible (0.64 µm, top) and “Clean” Infrared Window (10.3 µm, bottom) images centered over the Chicago area, with an overlay of GLM Flash Extent Density, contours of LightningCast Probability and plots of 15-minute METAR surface reports [click to play animated GIF | MP4]
GOES-16 “Clean” Infrared Window (10.3 µm) images centered over southeastern Lower Michigan, with an overlay of GLM Flash Extent Density and plots of 15-minute METAR surface reports [click to play animated GIF | MP4]
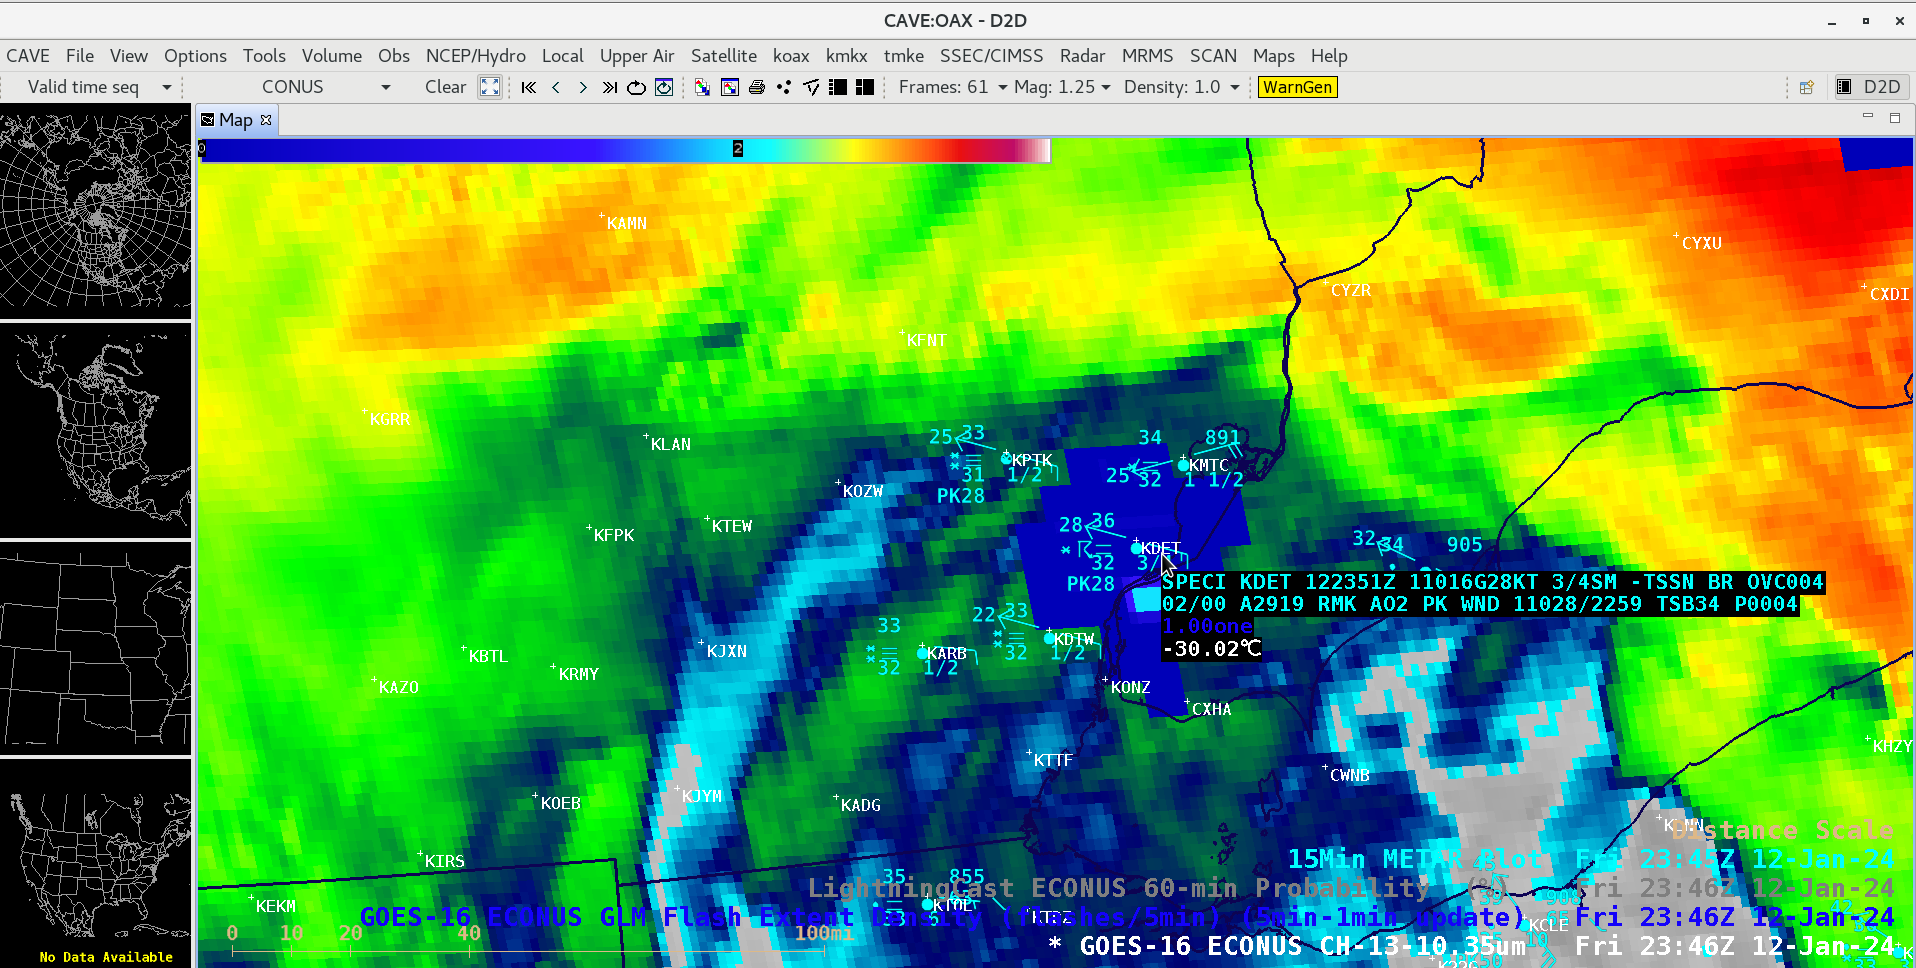
GOES-16 “Clean” Infrared Window (10.3 µm) image centered over southeastern Lower Michigan at 2346 UTC, with an overlay of GLM Flash Extent Density and a cursor sample of the KDET METAR surface report at 2351 UTC [click to enlarge]
GOES-16 “Clean” Infrared Window (10.3 µm) images centered over southeastern Lower Michigan, with an overlay of GLM Flash Extent Density, contours of LightningCast Probability and plots of 15-minute METAR surface reports [click to play animated GIF | MP4]
View only this post Read Less


