This website works best with a newer web browser such as Chrome, Firefox, Safari or Microsoft
Edge. Internet Explorer is not supported by this website.
Night Microphysics RGB imagery from the CSPP Geosphere site (link to a very similar animation to the one above) shows a line of tropical cumulus approaching Samoa. There are subtle color changes in that RGB that typically presage convective development (as also shown in this blog post, for example), and as highlighted in the annotated animation below that covers 0830-1230 UTC. The... Read More
GOES-West Night Microphysics RGB on 2 January 2024, 0600-1350 UTC
Night Microphysics RGB imagery from the CSPP Geosphere site (link to a very similar animation to the one above) shows a line of tropical cumulus approaching Samoa. There are subtle color changes in that RGB that typically presage convective development (as also shown in this blog post, for example), and as highlighted in the annotated animation below that covers 0830-1230 UTC. The last few frames of the annotation include screen captures of LightningCast probabilities over the region — and increasing probabilities over Savai’i should give a forecaster more confidence that convective initiation is ongoing. (This Night Microphysics RGB Quick Guide notes that ‘redder’ means thicker clouds are present).
Annotated Night Microphysics RGB from the CSPP Geosphere website, 0830-1230 UTC on 2 January 2024 (Click to enlarge)
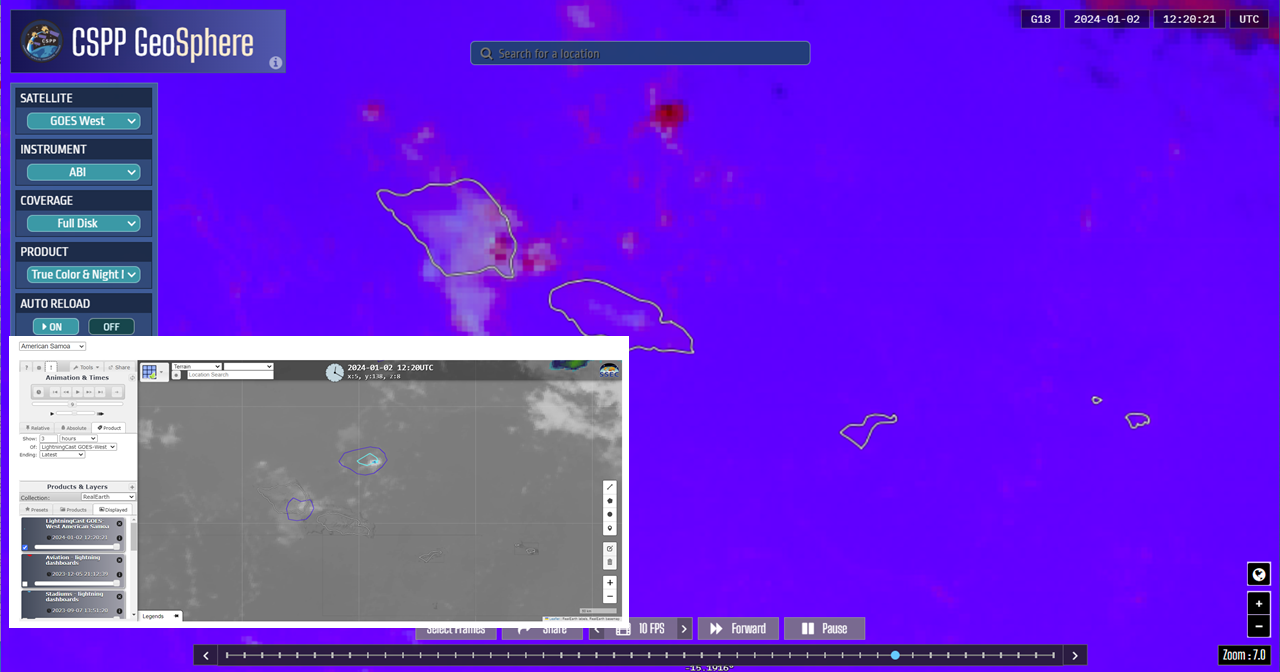
LightningCast probability estimates the likelihood that the GLM on board GOES-R satellites (for this case, GOES-18) will have a lightning observation in the next 60 minutes. Screen captures of the product over the Samoan Islands from 1100 to 1400 UTC, partially overlapping the animations above, below (from this website, choose the American Samoa sector from the drop-down menu), show a slow increase in values over eastern Savai’i, especially after 1300 UTC. The GLM observed lightning between 1330 and 1400 UTC.
LightningCast probability 1100 – 1400 UTC on 2 January 2024 overlain with GOES-18 GLM observations (Click to enlarge)
Level 2 Products from GOES-18 gave useful information during this event as well. The Derived Stability Index Lifted Index field, below, shows an axis of instability moving westward over the Samoan islands during the time of convective initiation. The default display values for AWIPS for Lifted Index (-10 to 20) have been changed (to -5 to 5) for the display below to better highlight the region of instability. Recall that level 2 Stability fields are clear-sky only, but skies around Samoa early on 2 January were largely cloud-free (in contrast to much of December 2024: link, link, link)
GOES-18 Band 7 (Shortwave infrared, 3.9 µm) imagery overlain with Derived Lifted Index, 0800 – 1450 UTC, 2 January 2023 (Click to enlarge)
Use multiple tools, such as LightningCast, Night Microphysics RGB imagery, and Level 2 Products, to determine when convective initiation is occurring. Combining information from multiple satellite sources means you can be more confident about predictions of development. Also: The CSPP Software team at CIMSS is creating software that allows for stand-alone LightningCast Probability fields. Stay tuned!
It’s very hard to choose just one event from every month of the year, but the goal here is to show a variety of phenomena and locations that NOAA‘s GOES ABI routinely monitors, in this case during 2023. Most loops generated are from the University of Wisconsin-Madison CIMSS Satellite Blog, which is linked to in the titles at the top of each monthly entry. Imagery from GOES-16 and -18 is showcased, along with the sectors it scans: Full Disk (10-min intervals), Contiguous U.S. (5-min intervals) and Mesoscale sectors (30-sec to 1-min intervals).
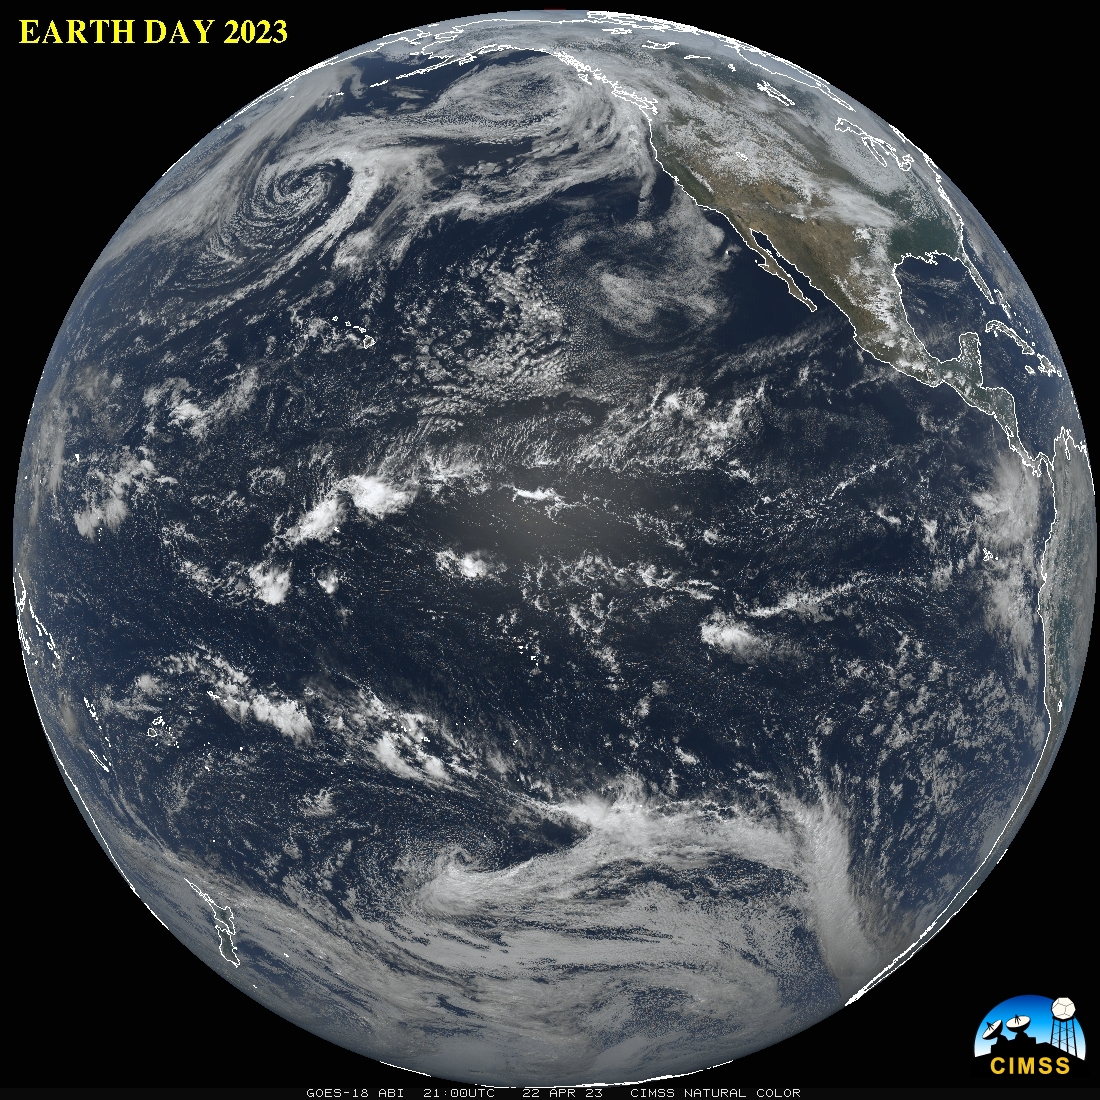
While the ABI on GOES-18 was earlier used operationally, it was deemed operational on January 4, 2023.
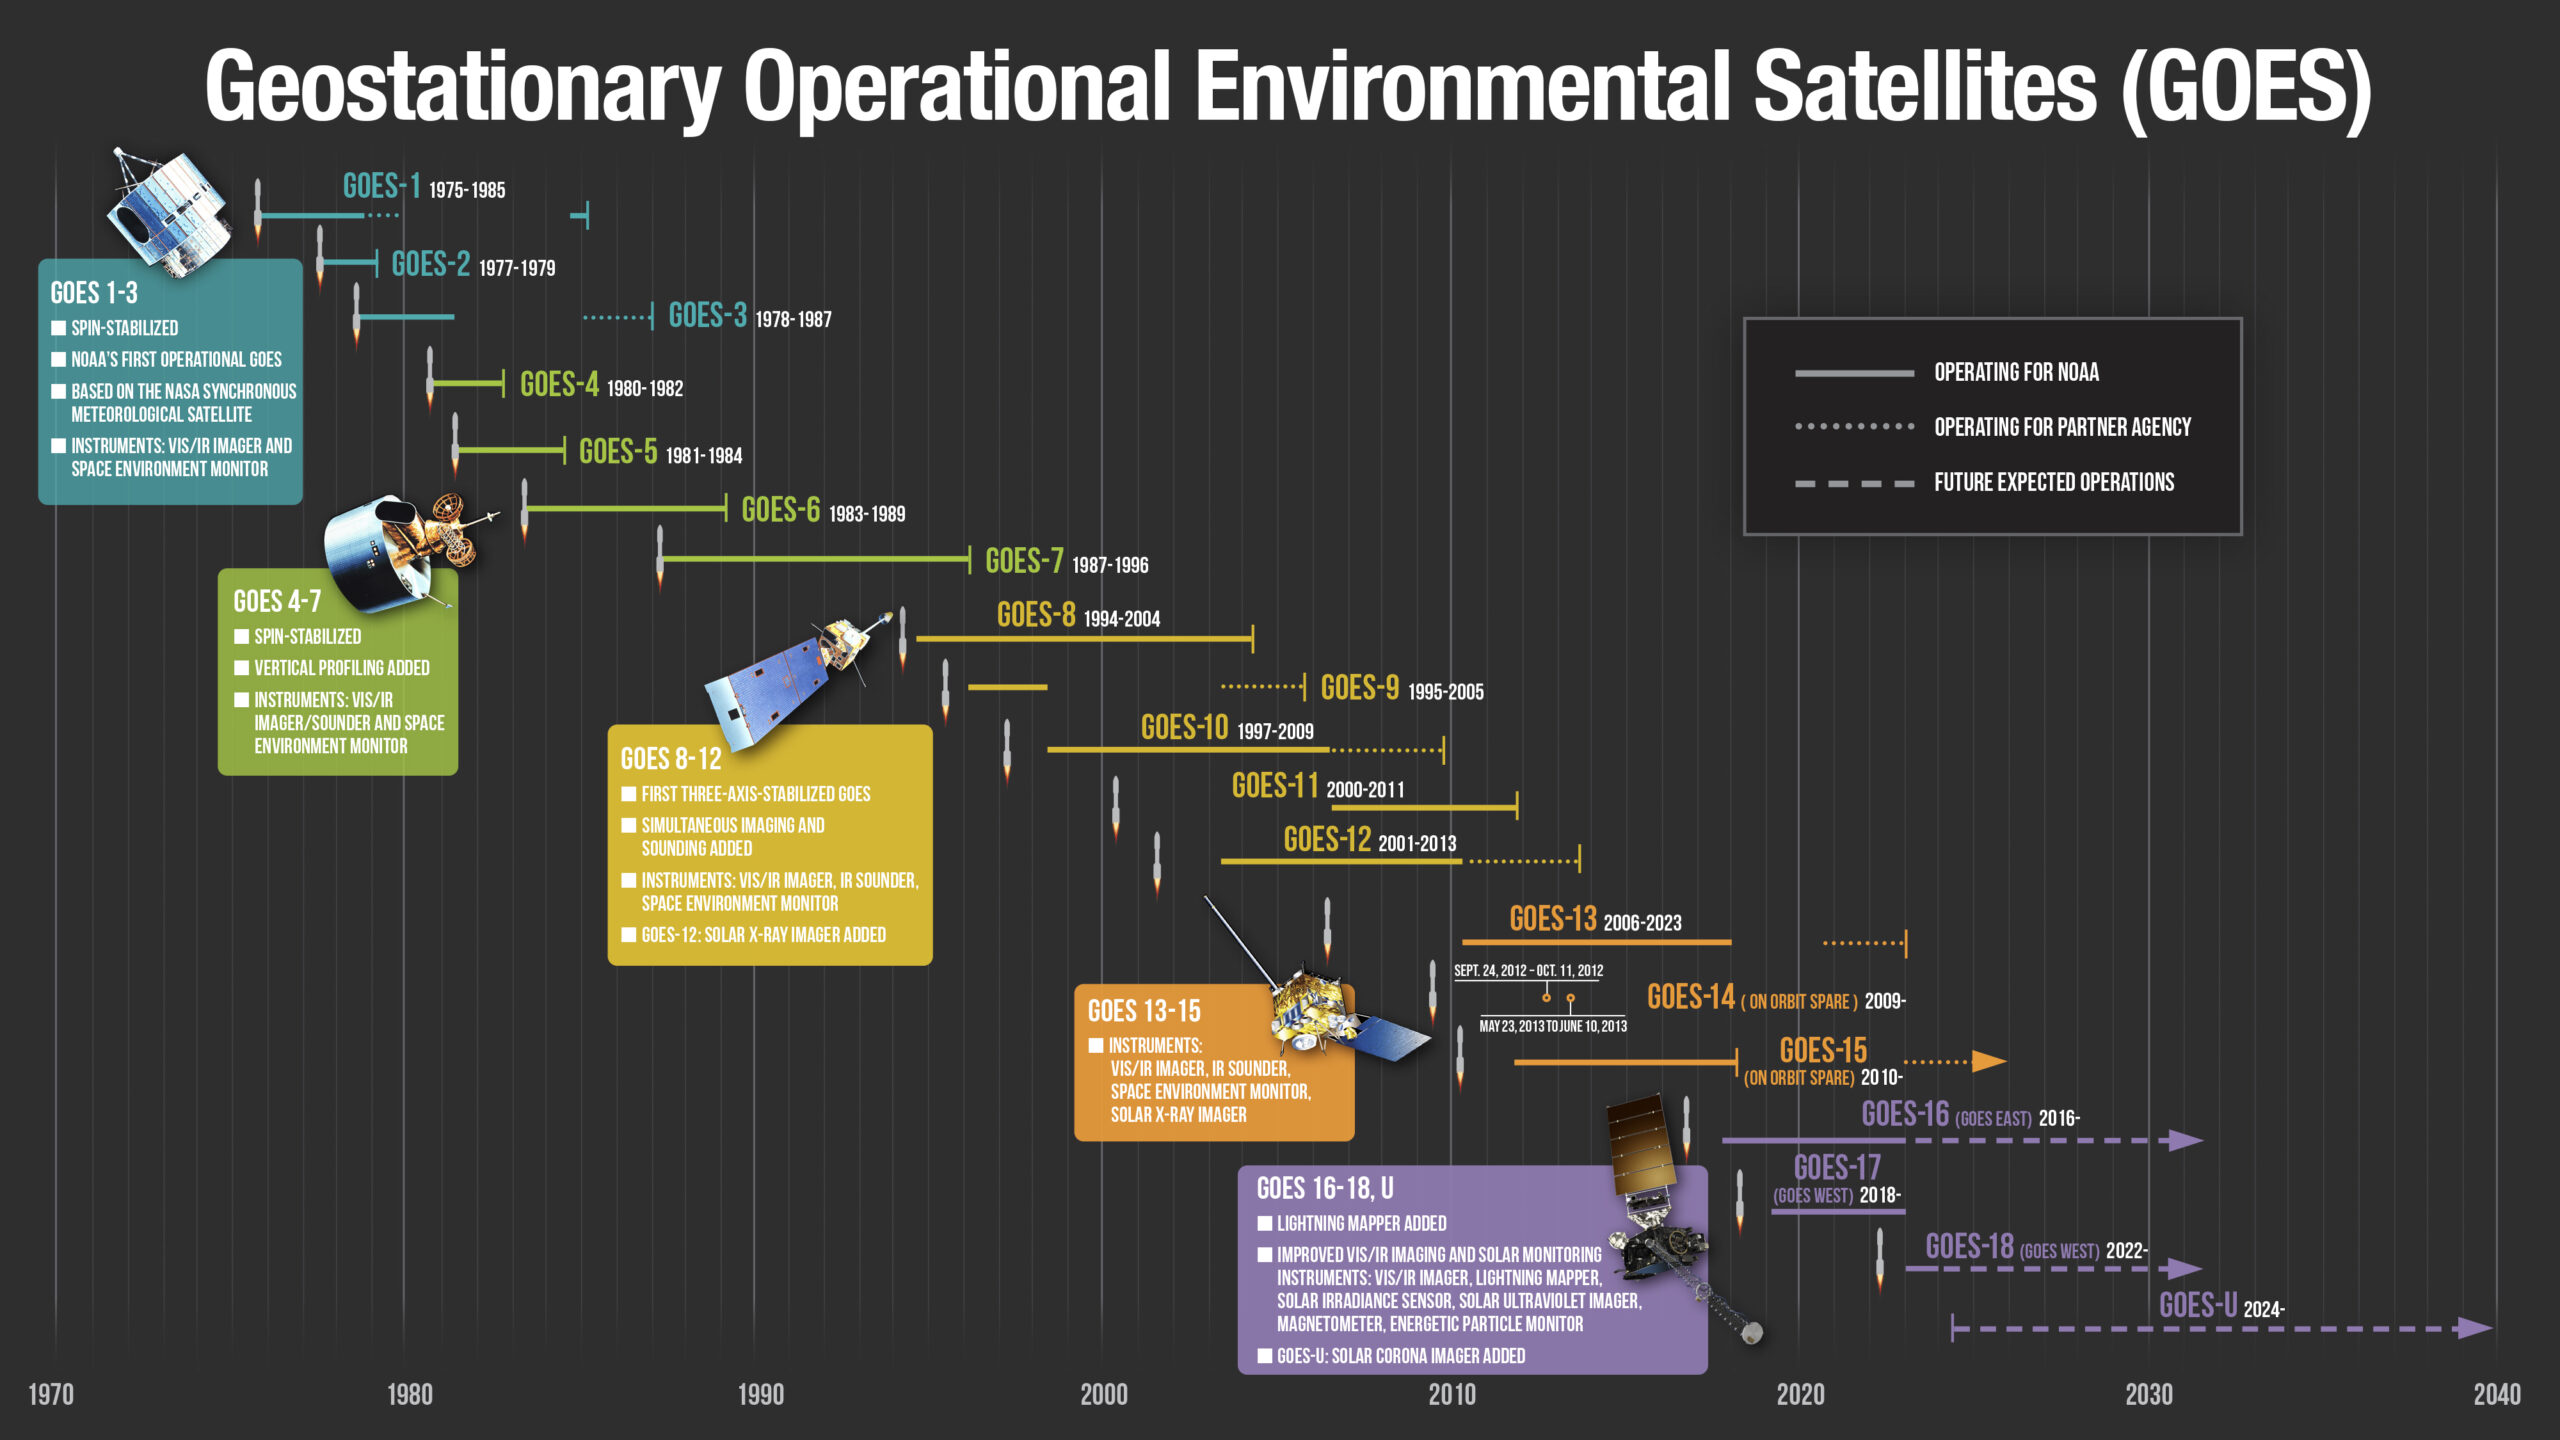
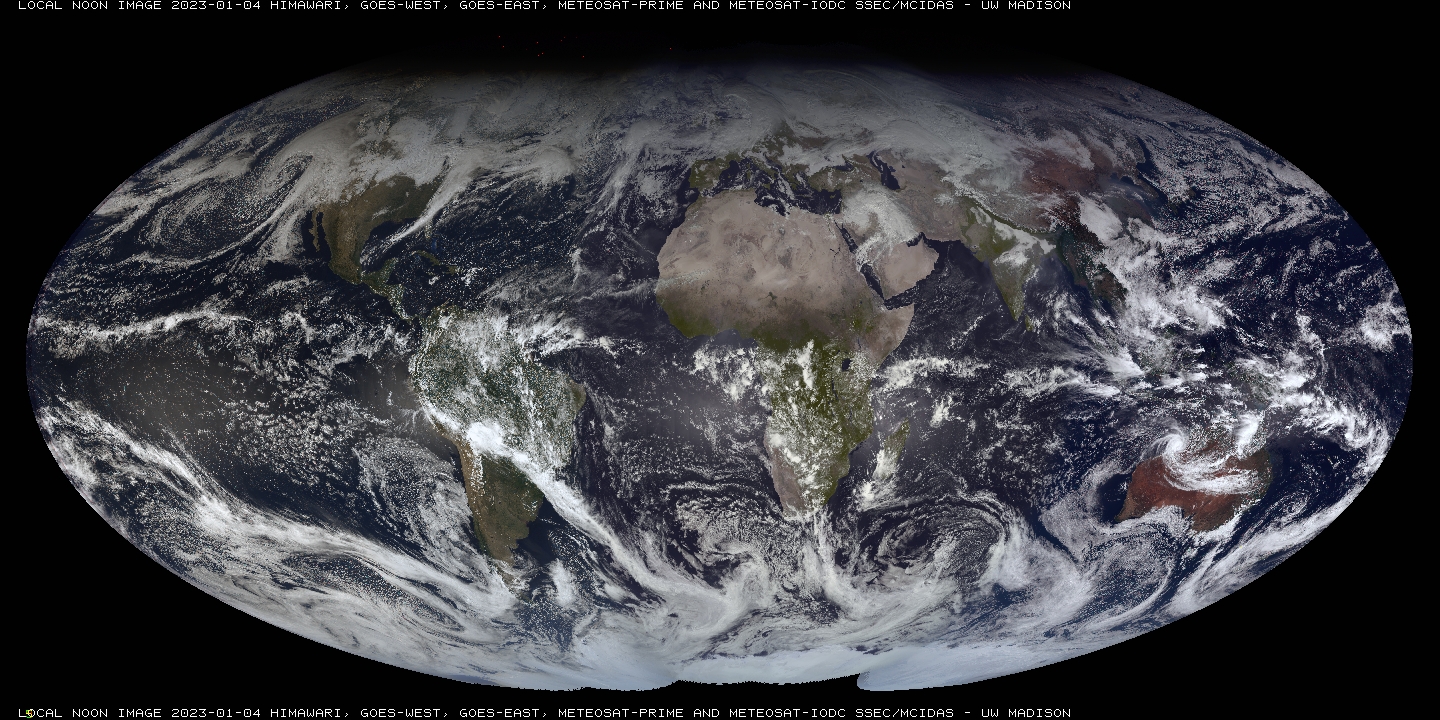
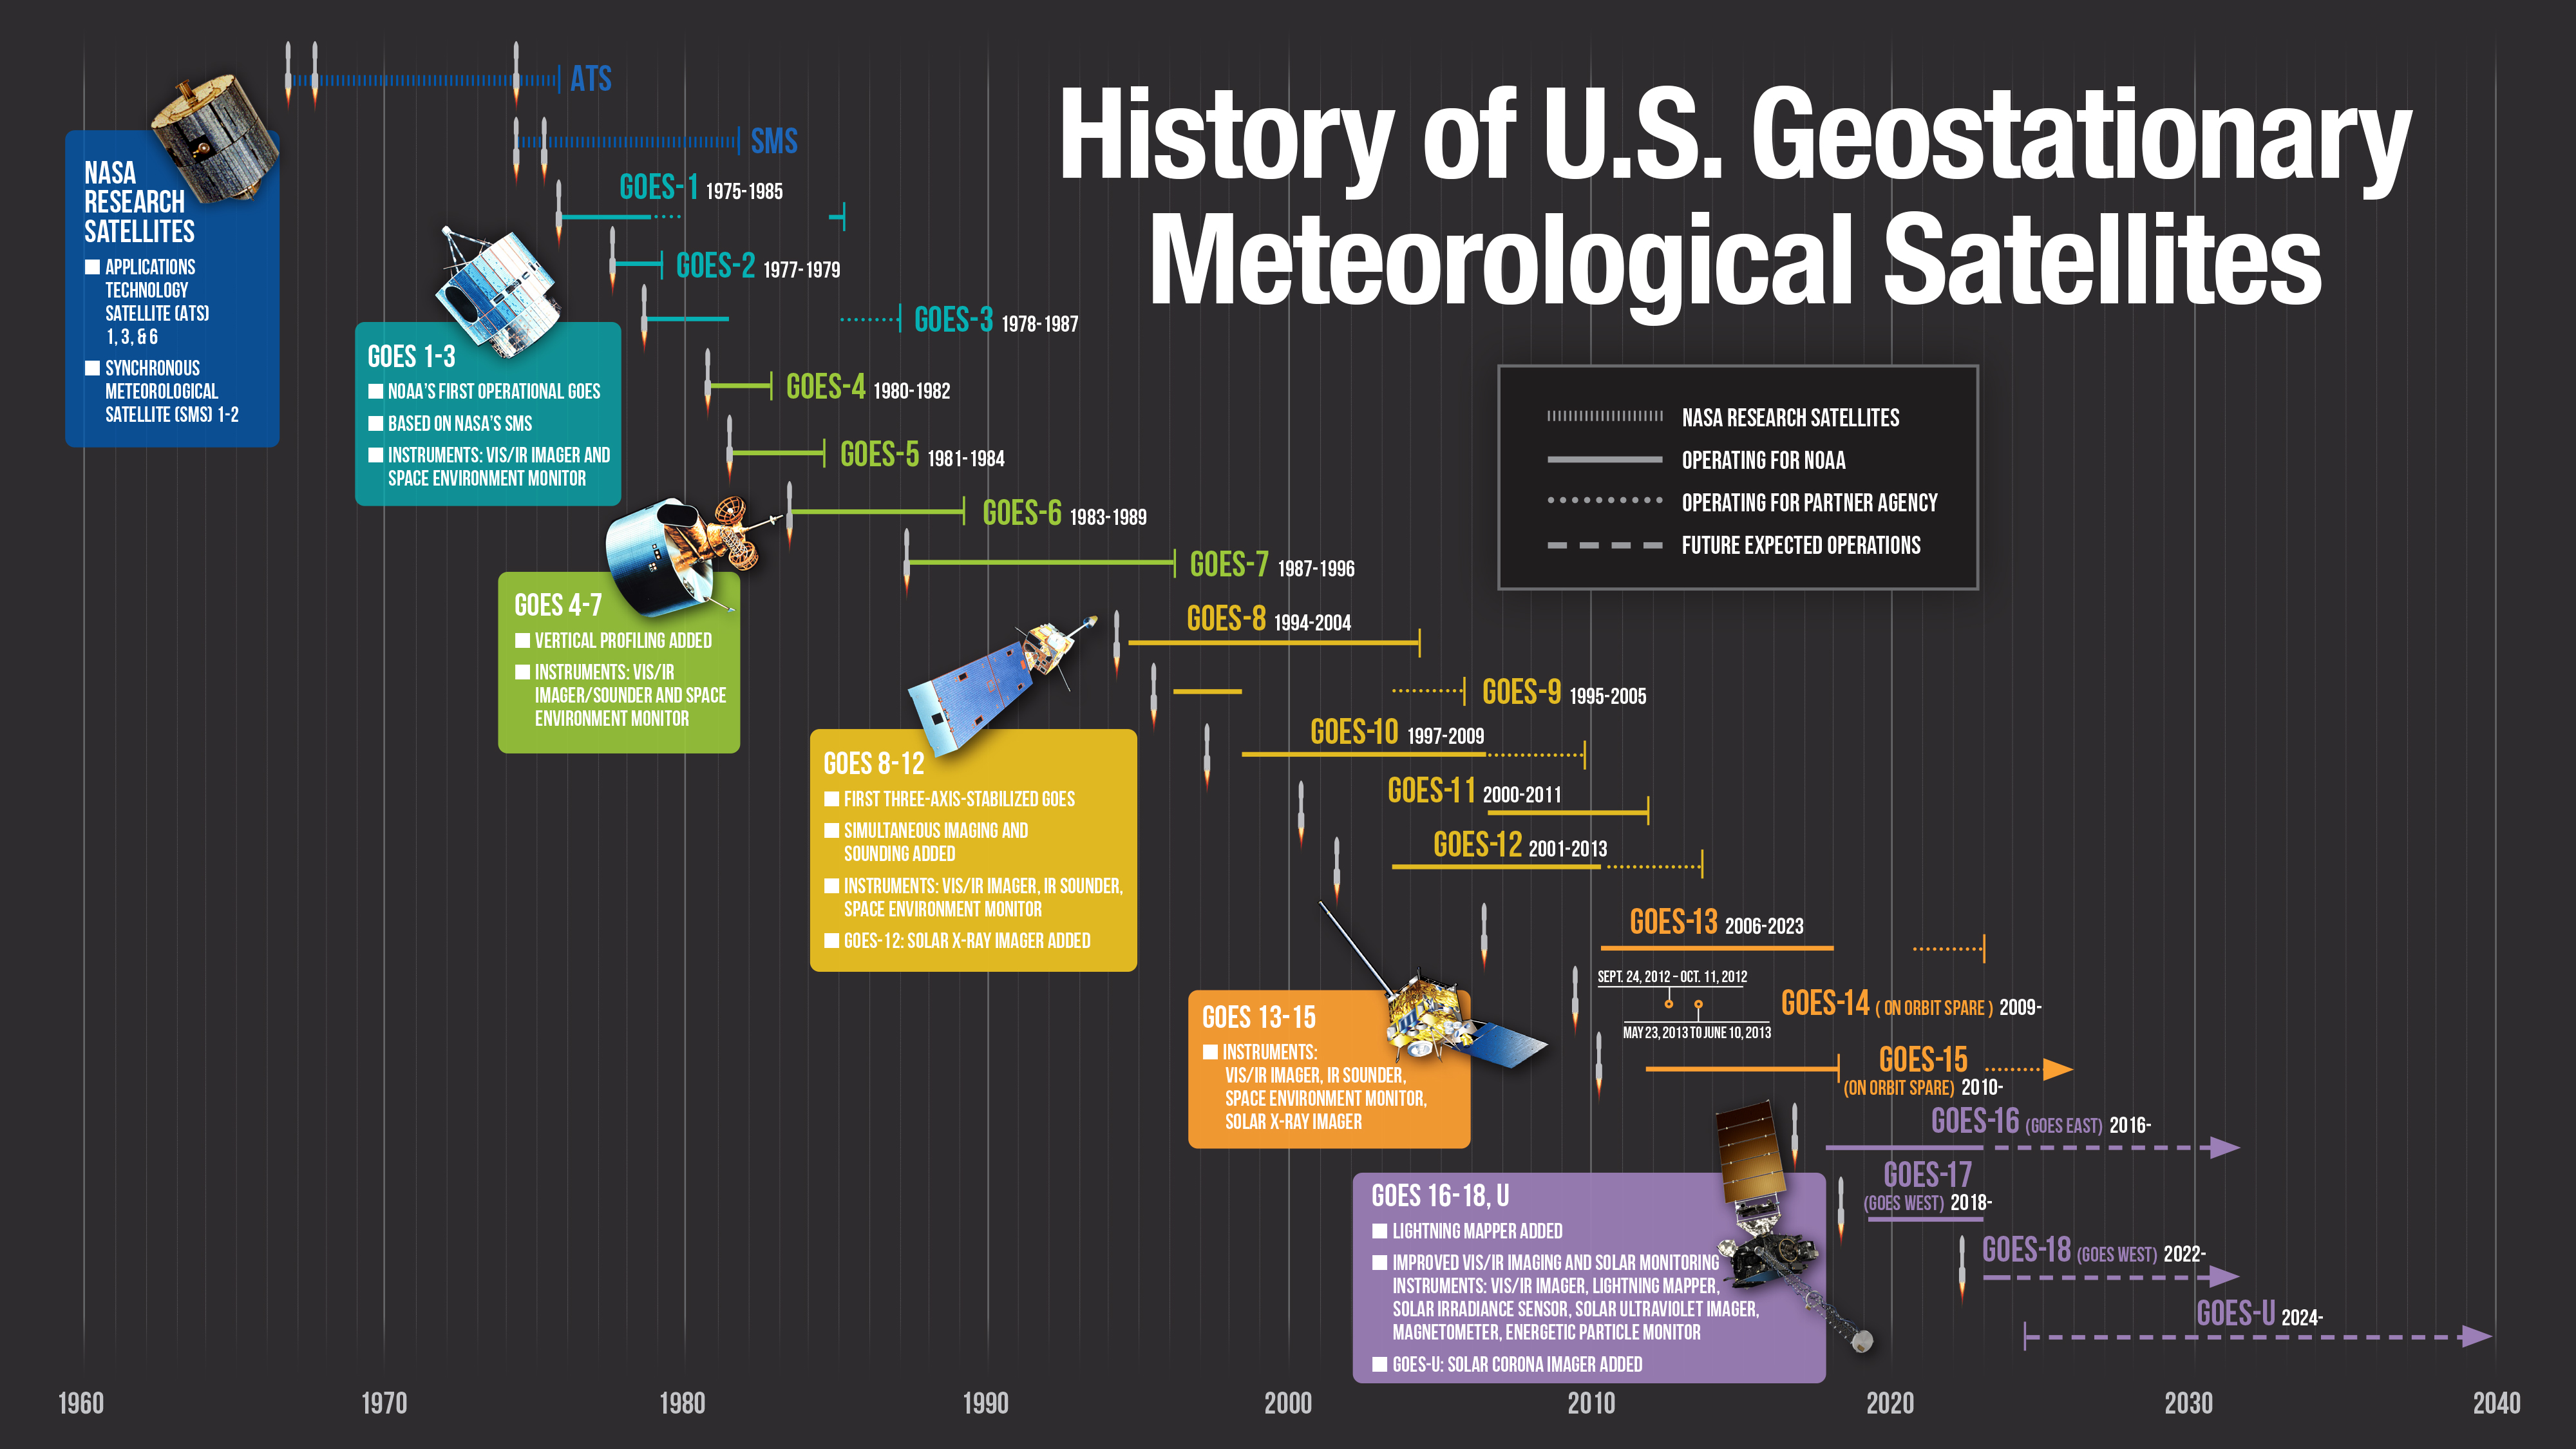
“High Noon” from a ring of geostationary imagers, including GOES-18. Data from January 4, 2023. (Click to show larger image.)A timeline of the GOES, from GOES-1 to GOES-U. Figure credit: GOES-R Program Office. (Click to show larger image.)
A similar timeline as above, but also including the experimental, pre-GOES, the ATS and SMS series. Note that GOES-15 is now operating as the U.S. Space Forces EWS-G2.
GOES-16 “Red” Visible (0.64 µm), Day Cloud Phase Distinction RGB and Day Snow-Fog RGB images (with and without hourly observations of Ceiling / Visibility / Surface Weather, plotted in cyan) [click to play MP4 animation | animated GIF]
GOES-16 ABI true color images at 11 UTC each day from the 2022 Fall to the 2023 Spring Equinox.
11 UTC loops from the (northern hemisphere) fall Equinox to the Spring Equinox. These posted GOES ABI Full Disk imagery are only showing a small number of the pixels, for a fuller resolution image at one time (20-March-2023).
GOES-16 “Clean” Infrared Window (10.3 µm) images, with/without an overlay of GLM Flash Extent Density and contours of LightningCast Probability [click to play MP4]
GOES-16 “Clean” Infrared Window (10.3 µm) images [click to play animation]
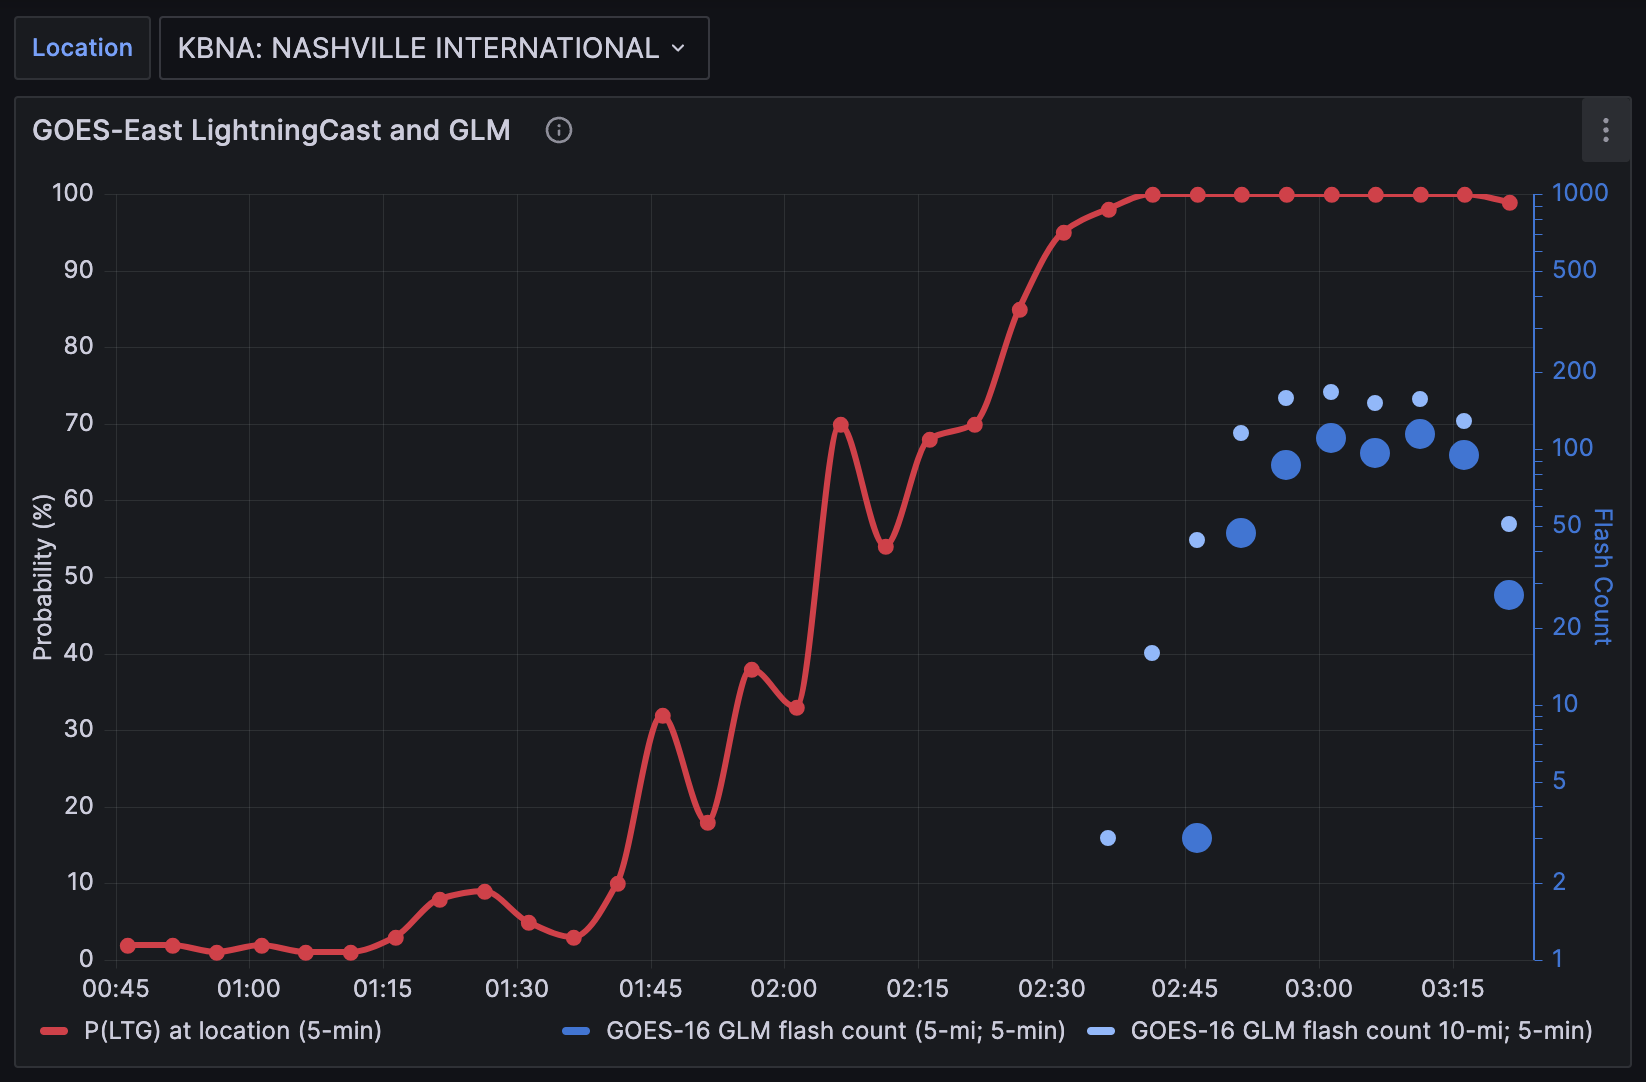
Time series of LightningCast Probability for Nashville International Airport. with plots of GLM Flash Counts within a 5 and 10 mile radius of the airport (courtesy John Cintineo, CIMSS) [click to enlarge]
GOES-16 Clean Window infrared (Band 13, 10.3 µm), Total Precipitable Water (in clear skies), and surface observations, 1356 – 1851 UTC, 29 September 2023 (Click to enlarge)
GOES-16 CIMSS Natural True Color RGB images [click to play animation]
ICYMI – the moon photobombed the #GOESEast Solar Ultraviolet Imager (SUVI) this past weekend. This loop from November 13th shows the moon's orb moving across the face of the Sun from the perspective of @NOAASatellites GOES-16 satellite. (HT @UWSSEC Rick Kohrs) pic.twitter.com/CDjJwia2yQ
#HappyNewYear A year in satellite imagery from GOES-16. This loop shows one mid-level water vapor image every day in 2023 around 17:30 UTC. Made with McIDAS-V. pic.twitter.com/QUpfTiXGEM
Thanks to all who make the satellite imagery possible, the ingest and software to display the imagery (including, but not limited to McIDAS-X, geo2grid, geosphere, Real Earth and AWIPS) and all who generated CIMSS Satellite Blog entries, especially Scott Bachmeier and Scott Lindstrom. Special thanks to Mat Gunshor and Jim Nelson of UW/CIMSS.
MIMIC Total Preciptable Water (TPW) Fields (from this site), below, for the 24 hours ending 1300 UTC on 26 December 2023, show the Samoan Islands (at 13-14oS, ~172oW) in the middle of the South Pacific Convergence Zone (SPCZ) that stretches east-southeastward across the South Pacific. Pago Pago has received more than 20″... Read More
MIMIC Total Preciptable Water (TPW) Fields (from this site), below, for the 24 hours ending 1300 UTC on 26 December 2023, show the Samoan Islands (at 13-14oS, ~172oW) in the middle of the South Pacific Convergence Zone (SPCZ) that stretches east-southeastward across the South Pacific. Pago Pago has received more than 20″ of rain in December so far, with 2.36″ falling on Christmas Day. (Average rainfall in December is near 15″).
Total Precipitable Water values, 1400 UTC 25 December – 1300 UTC 26 December 2023 (Click to enlarge)
Rain on Christmas Day was supported by strong low-level convergence near the Samoan Islands, as shown below in the animation of Advanced Scatterometer (ASCAT) winds from MetopB and MetopC. Strong convergence is apparent over the islands at the start of the animation, but that zone of convergence has moved south by the 26th.
ASCAT surface winds from MetopC (left) and MetopB (right) on 25 and 26 December. TImes as indicated (in magenta) at the bottom of the figures (Click to enlarge)
GOES-18 Clean Window imagery, below, overlain on top of Level 2 TPW (scaled from 1-2.5 inches in the figure), also show the slow southward sag of the leading edge of the convergence (inferred by the development of strong convection). Low-level water vapor infrared imagery (Band 10, 7.34 µm) also shows the southward motion of the moisture between 0000 and 1400 UTC on 26 December 2023. The leading edge of the surface convergence has moved south, and strong convection associated with that leading edge has also moved south. However, strong convection continues in the moist air north of the strong convergence, including over the Samoan Islands. A Flood Watch continues over American Samoa through Tuesday (WSO PPG website).
GOES-18 Clean Window (Band 13, 10.3 µm) infrared imagery, 0000 – 1400 UTC on 26 December 2023 (Click to enlarge). Total Precipitable Water (scaled from 1-2.5 in) is shown in regions of clear skies
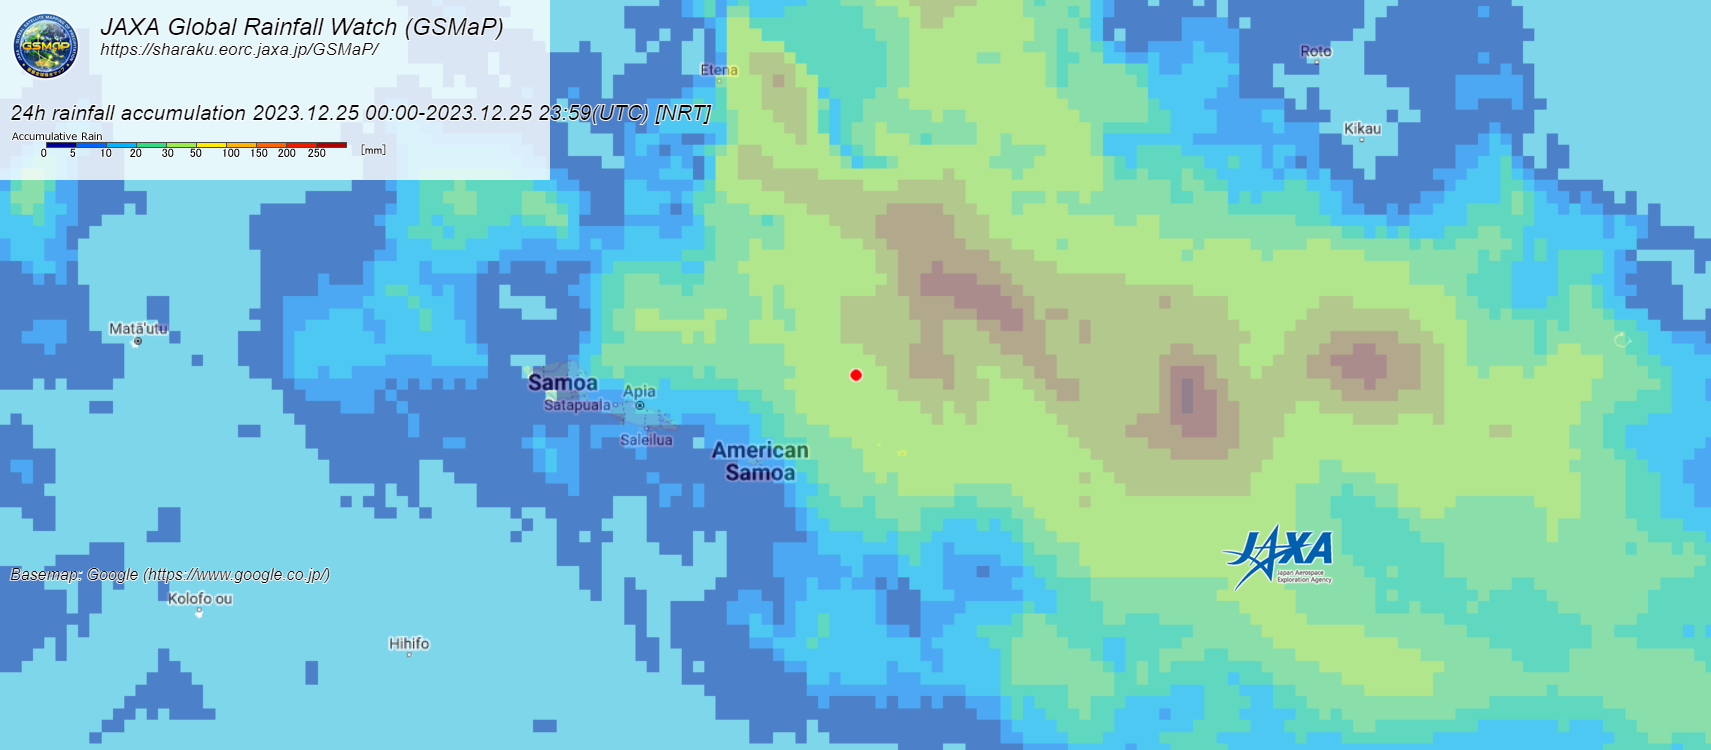
Microwave estimates of 24-precipitation on Christmas Day from JAXA’s GsMap site (below) show that the heaviest rain on that day fell over the Manu’a Islands with even larger totals over the ocean to the north.
24-Microwave Precipitation estimates for 25 December 2023 (click to enlarge)
The Samoan Islands are currently under strong shear, so it would be a surprise if the convection over and south of Samoa developed into a tropical cyclone. However, shear is favorable to the northwest of the Samoan Islands. (Shear image taken from the SSEC/CIMSS Tropical Weather Website).
850-200 mb shear values over the southwest Pacific Ocean, 1200 UTC on 26 December 2023 (Click to enlarge)
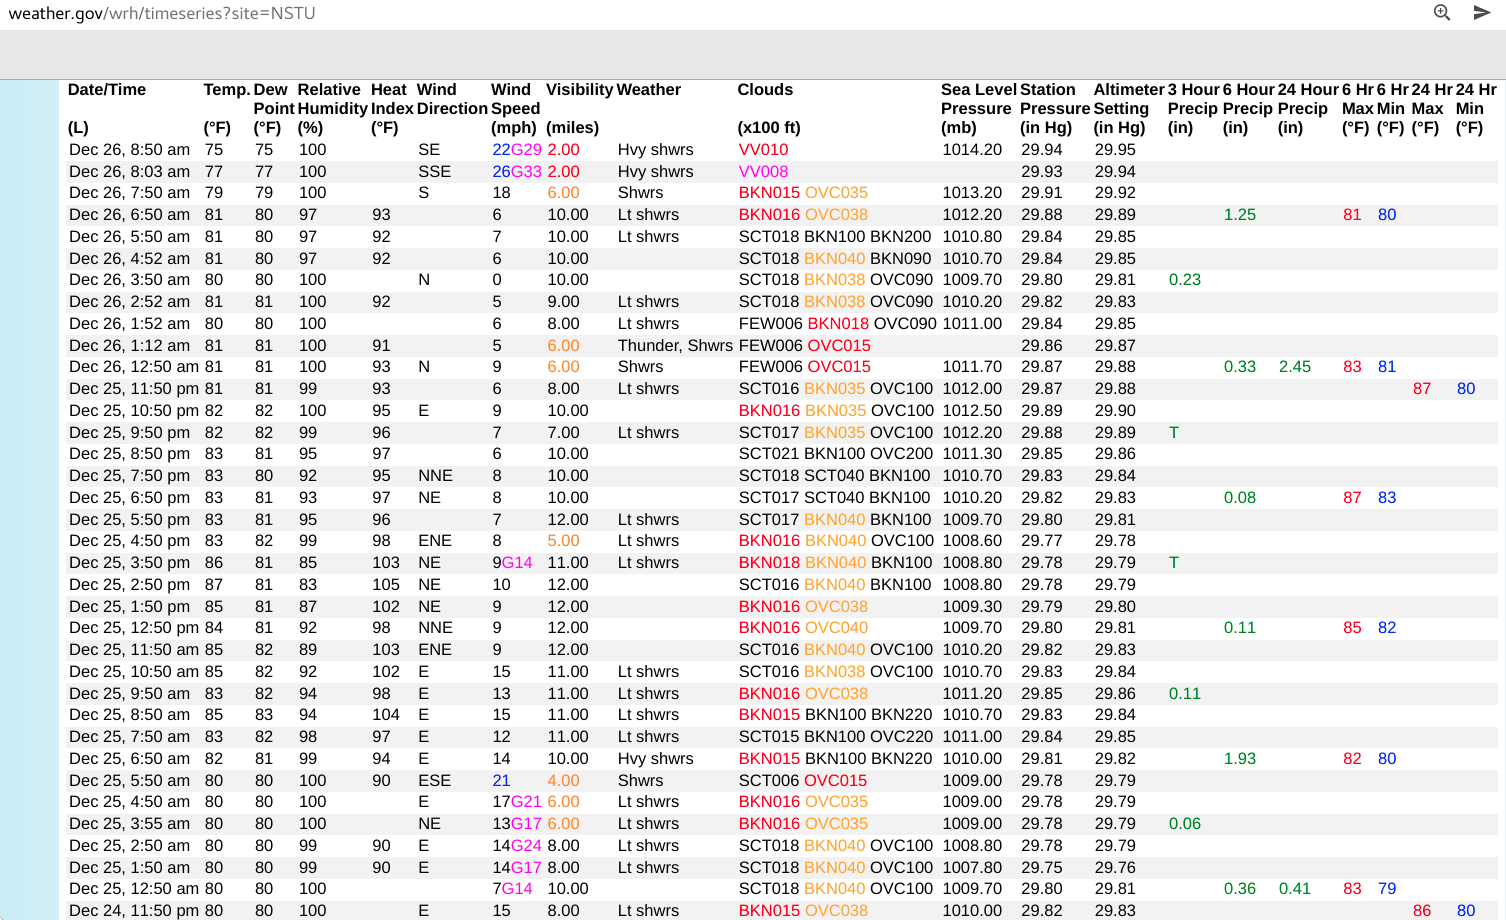
As discussed in this blog post, heavy rainfall had continued across the Samoan Islands on 25 December 2023. The South Pacific Convergence Zone (SPCZ) remained in the vicinity of the Samoan Islands on that day (surface analyses) — and 1-minute Mesoscale Domain Sector GOES-18 (GOES-West) “Clean” Infrared Window (10.3 µm) images (above) showed additional pulses of deep convection that... Read More
1-minute GOES-18 “Clean” Infrared Window (10.3 µm) images, from 1100 UTC on 25 December to 1100 UTC on 26 December [click to play animated GIF | MP4]
As discussed in this blog post, heavy rainfall had continued across the Samoan Islands on 25 December 2023. The South Pacific Convergence Zone (SPCZ) remained in the vicinity of the Samoan Islands on that day (surface analyses) — and 1-minute Mesoscale Domain Sector GOES-18 (GOES-West) “Clean” Infrared Window (10.3 µm) images (above) showed additional pulses of deep convection that produced heavy rainfall over Tutuila and the Manu`a Islands of American Samoa. During the calendar day of 25 December local time (which is 1100 UTC on 25 December to 1100 UTC on 26 December), Pago Pago on Tutuila received 2.45 inches of rainfall.
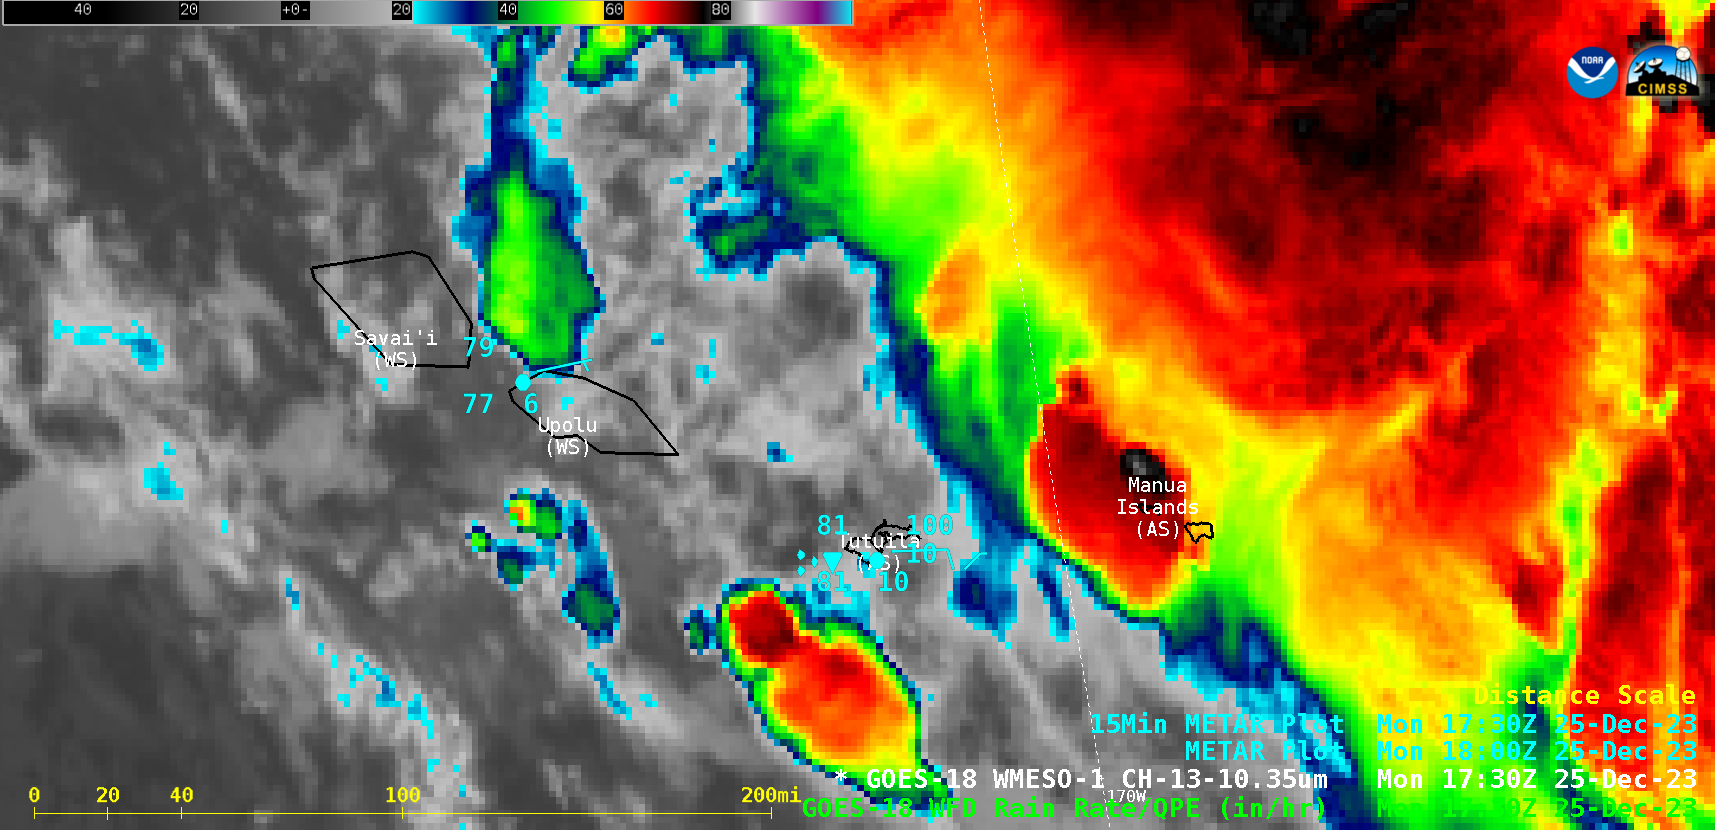
The GOES-18 Infrared image at 1720 UTC on 25 December (below) included a cursor sample of the 10.3 µm cloud-top brightness temperature and associated Level 2 Rain Rate derived product just southwest of the Pago Pago METAR site on Tutuila — the Rain Rate was 1.92 in/hr, highlighting the heavy rain potential of these convective showers.
GOES-18 “:Clean” Infrared Window (10.3 µm) image at 1720 UTC on 25 December, with a cursor sample of the 10.3 µm cloud-top brightness temperature (white) and associated Rain Rate derived product (green) just southwest of Tutuila [click to enlarge]


