1-minute imagery of wildfires and pyrocumulonimbus clouds in British Columbia

GOES-18 Fire Temperature RGB images (top) and “Clean” Infrared Window (10.3 µm) images (bottom) [click to play animated GIF | MP4]
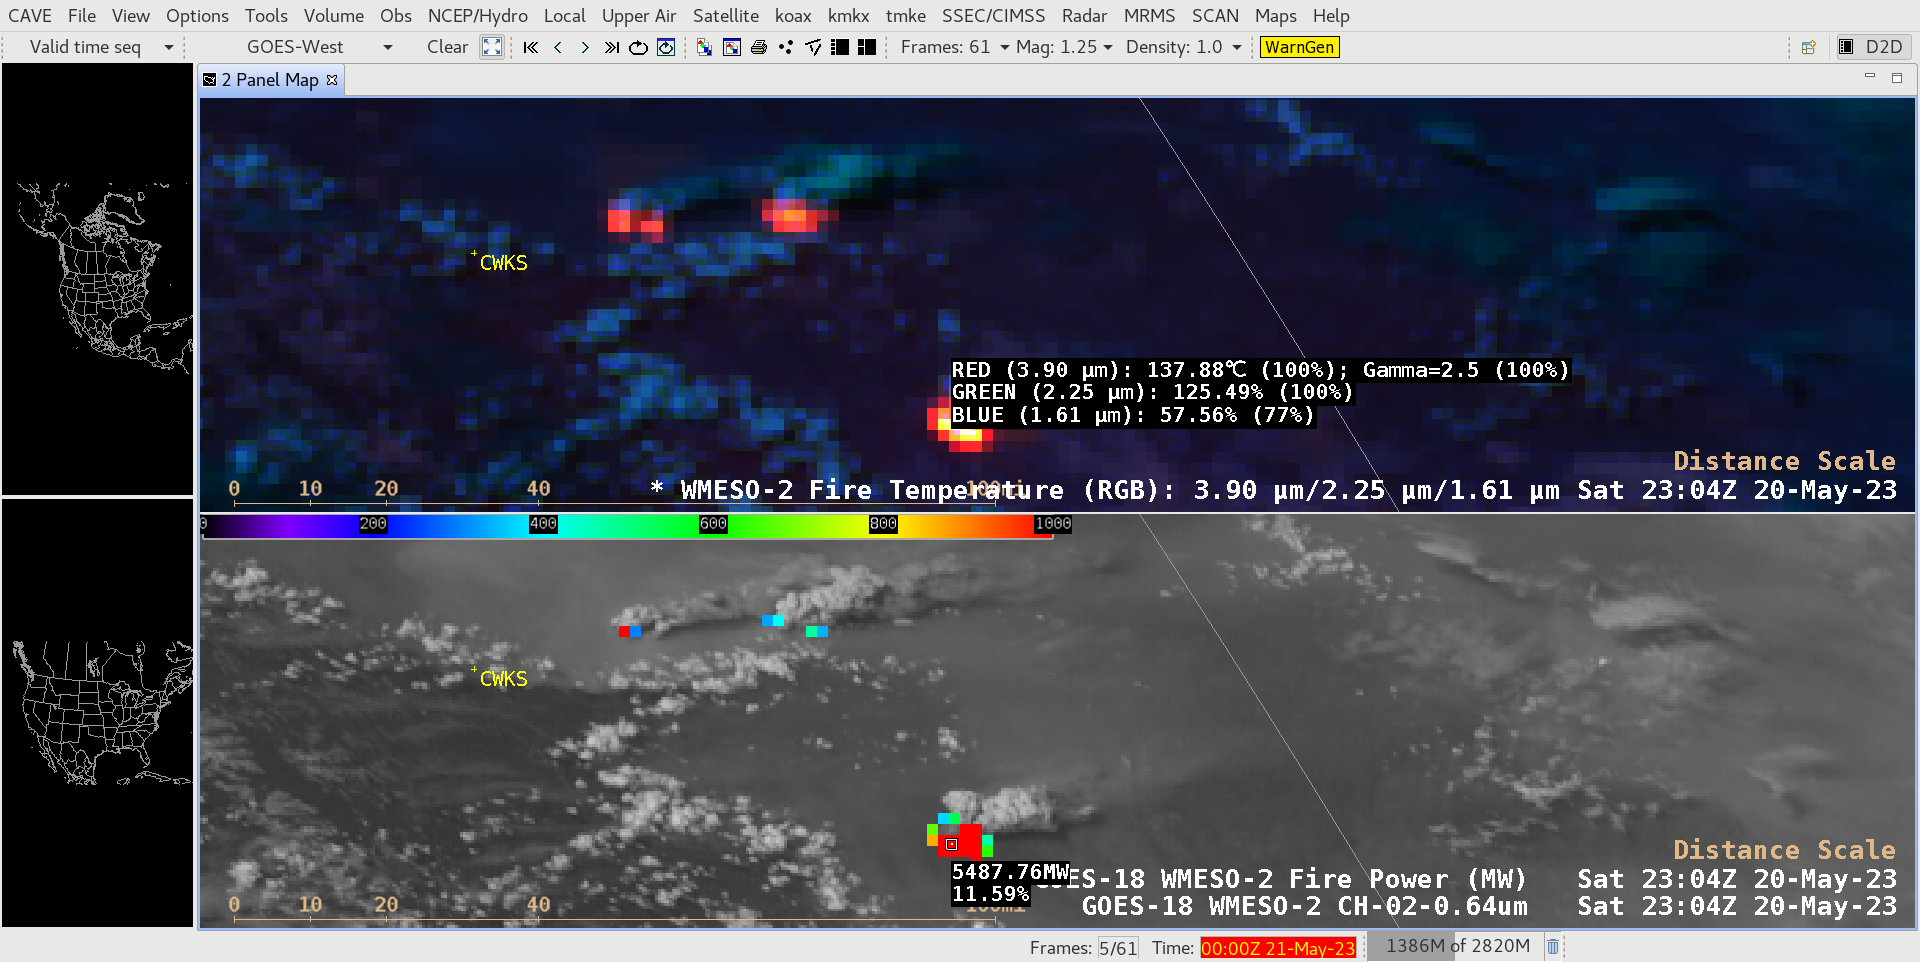
During the time period that the fires were burning very hot and beginning to produce pyroCB clouds, 1-minute GOES-18 Fire Temperature RGB images and “Red” Visible (0.64 µm) images with an overlay of the Fire Power derived product (below) showed that the southernmost fire frequently exhibited Fire Power values in excess of 5000 MW (with a peak of 5487.76 MW at 2304 UTC). The Fire Power derived product is a component of the GOES Fire Detection and Characterization Algorithm (FDCA).
GOES-18 Fire Temperature RGB images (top) and “Red” Visible (0.64 µm) images with an overlay of the Fire Power derived product (bottom) [click to play animated GIF | MP4]
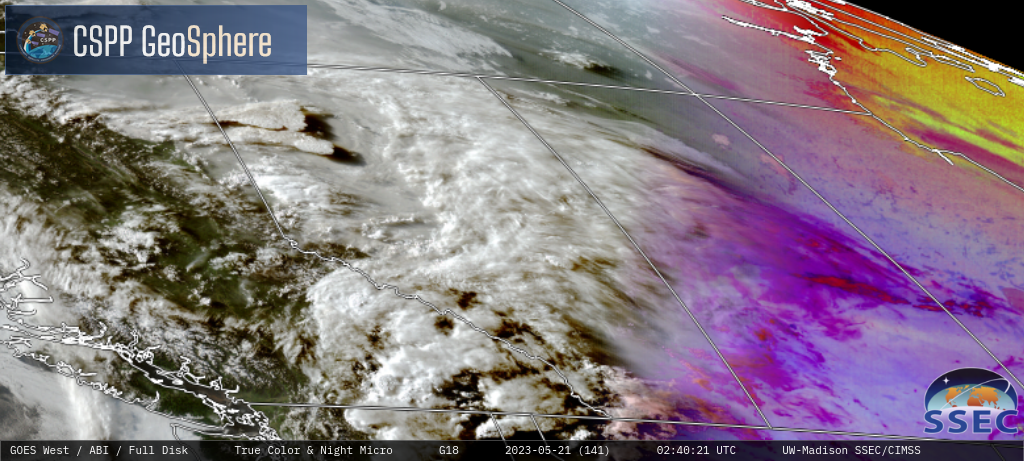
GOES-18 True Color RGB and Nighttime Microphysics RGB images [click to play MP4 animation]