30-second imagery of severe thunderstorms across the Mid-South and Deep South
30-second GOES-16 “Red” Visible (0.64 µm, top) and “Clean” Infrared Window (10.3 µm, bottom) images, with time-matched (+/- 3 minutes) plots of SPC Storm Reports, from 1900 UTC to 2013 UTC on 09 December [click to play animated GIF | MP4]
1-minute GOES-16 Visible and Infrared images with/without an overlay of GLM Flash Extent Density (below) showed pulses of cold overshooting tops (brighter white infrared pixels) and brief lightning jumps associated with the Clarksville supercell thunderstorm as it moved across Montgomery County in Tennessee into Todd County in Kentucky.
1-minute GOES-16 “Red” Visible (0.64 µm, top) and “Clean” Infrared Window (10.3 µm, bottom) images, with/without an overlay of GLM Flash Extent Density, from 1900 UTC to 2045 UTC on 09 December [click to play animated GIF | MP4]
30-second GOES-16 “Clean” Infrared Window (10.3 µm) images, with time-matched (+/- 3 minutes) plots of SPC Storm Reports, from 2200 UTC to 2320 UTC on 09 December [click to play animated GIF | MP4]
1-minute GOES-16 “Clean” Infrared Window (10.3 µm) images, with/without an overlay of GLM Flash Extent Density, from 2130 UTC to 2330 UTC on 09 December [click to play animated GIF | MP4]
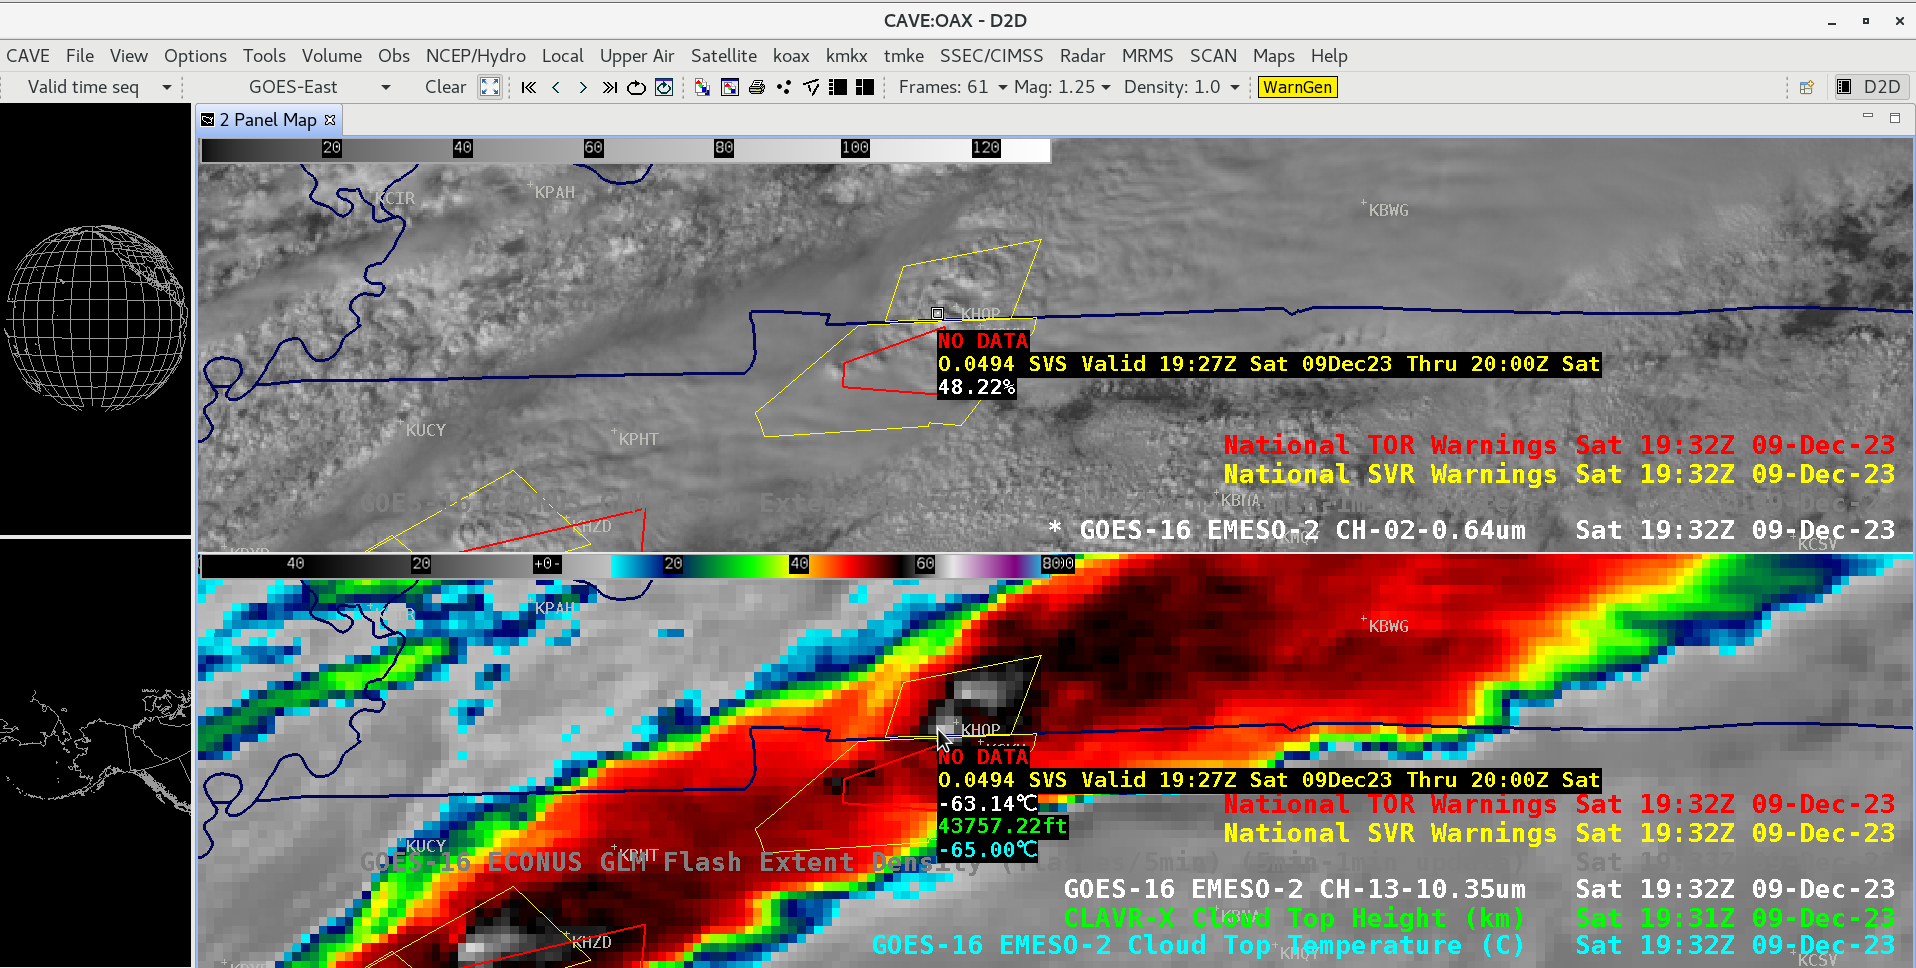
Cursor sample of GOES-16 10.3 µm brightness temperature, Cloud Top Temperature derived product and CLAVR-x Cloud Top Height derived product for the Clarksville TN tornadic thunderstorm at 1932 UTC on 09 December [click to enlarge]
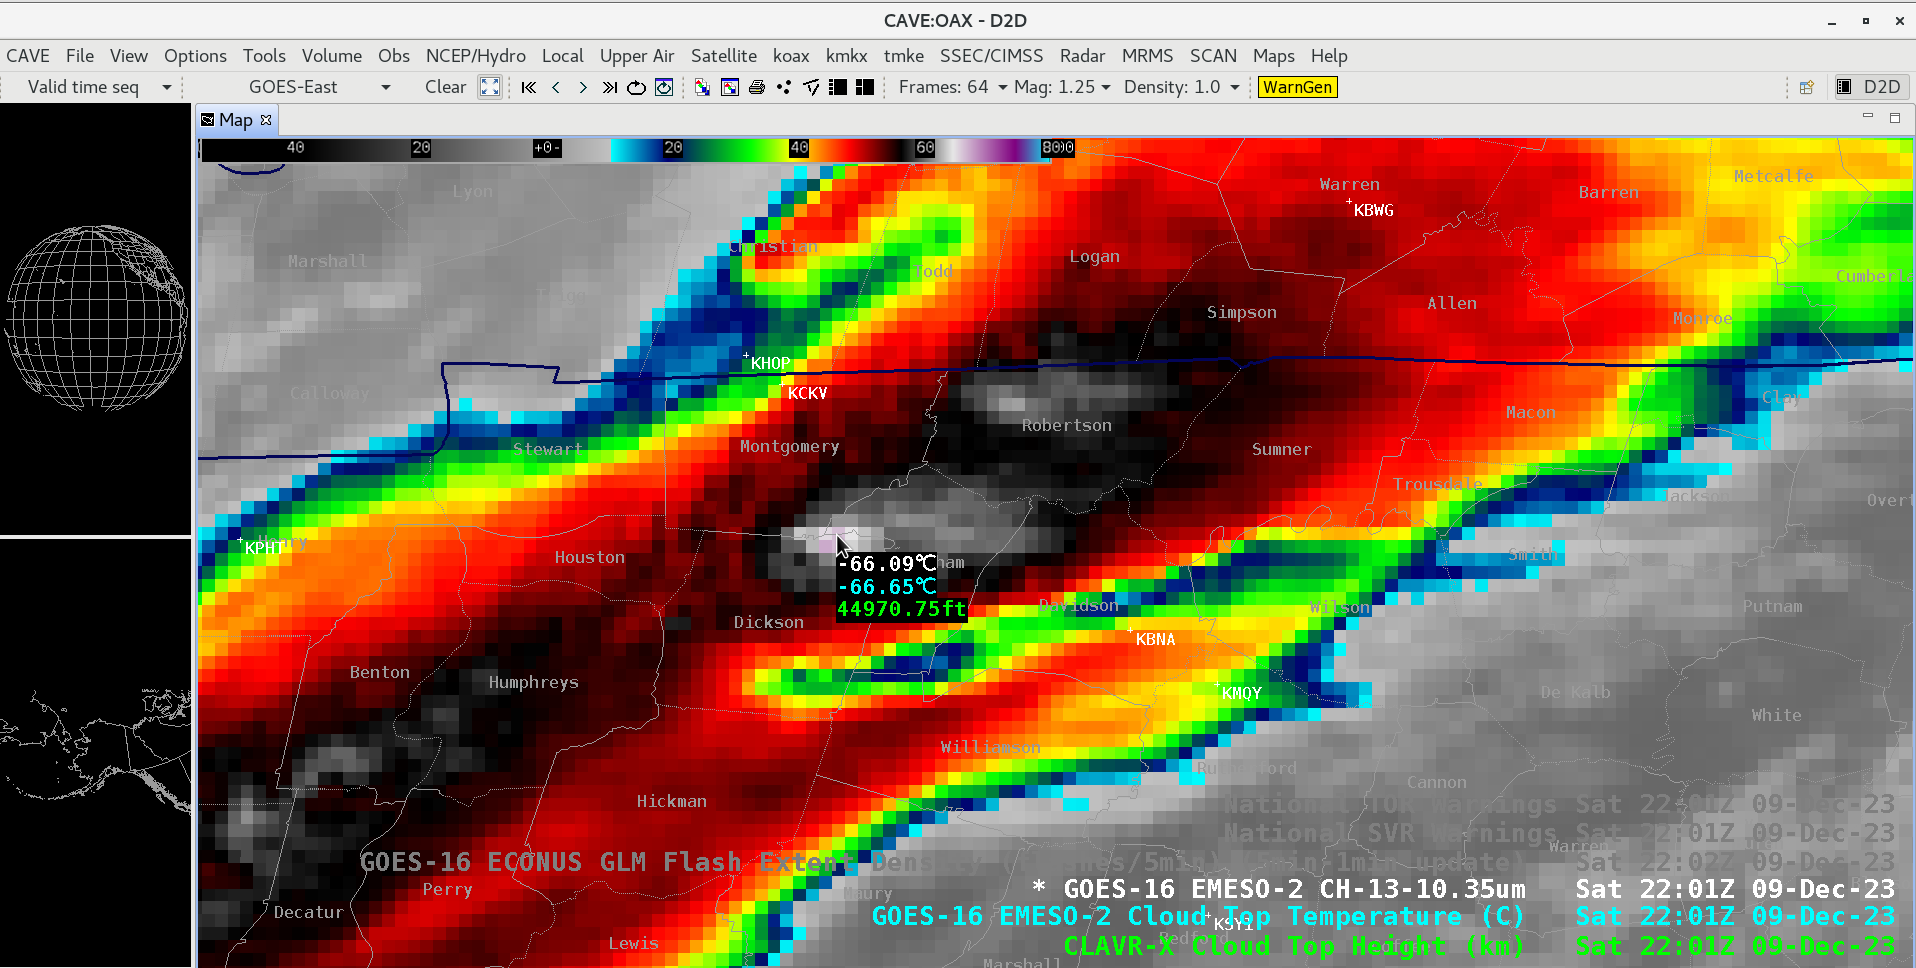
Cursor sample of GOES-16 10.3 µm brightness temperature, Cloud Top Temperature derived product and CLAVR-x Cloud Top Height derived product for the Madison TN tornadic thunderstorm at 2201 UTC on 09 December [click to enlarge]
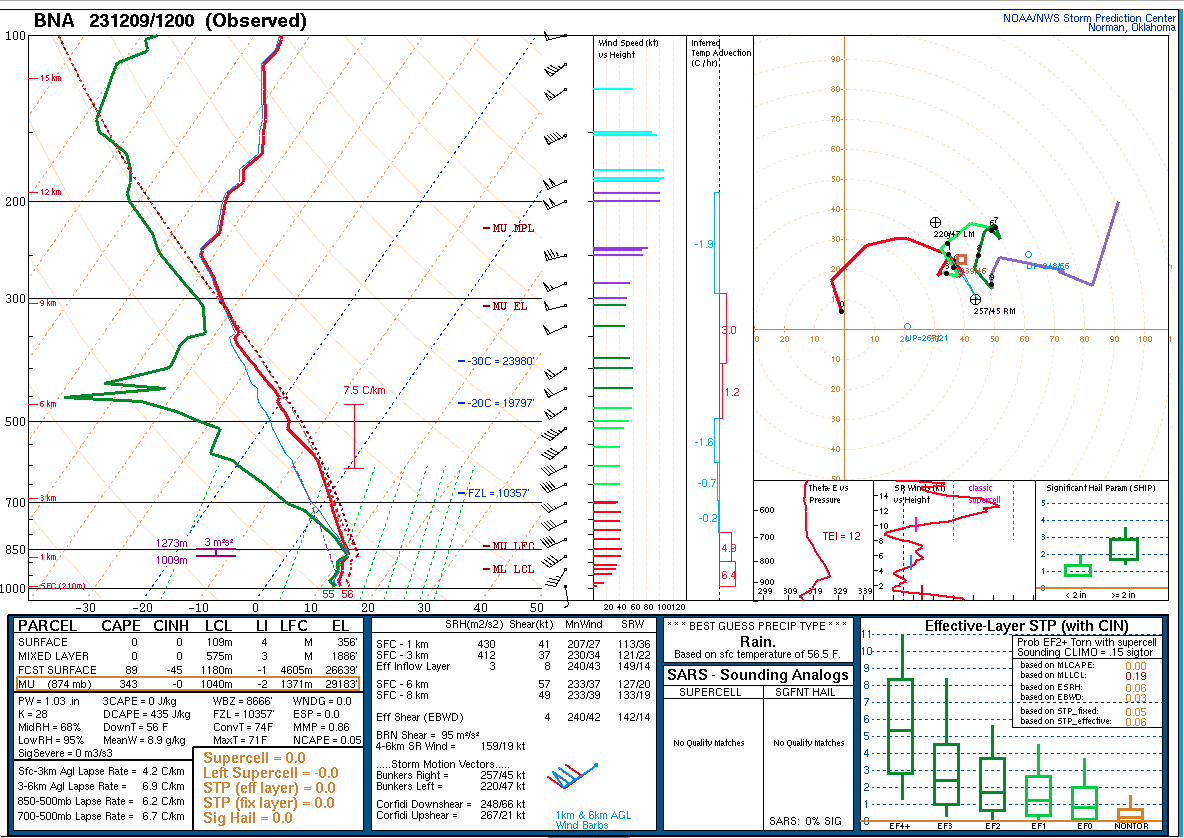
Plot of Nashville, Tennessee rawinsonde data at 1200 UTC on 09 December [click to enlarge]
30-second GOES-16 “Clean” Infrared Window (10.3 µm) images, with time-matched (+/- 3 minutes) plots of SPC Storm Reports, from 1900 UTC to 0752 UTC on 10 December [click to play MP4 animation]

5-minute GOES-16 Visible images, combined with Total Precipitable Water, Lifted Index and CAPE derived products (in cloud-free skies) [click to play animated GIF | MP4]