This website works best with a newer web browser such as Chrome, Firefox, Safari or Microsoft
Edge. Internet Explorer is not supported by this website.
CSPP Geosphere imagery (Night Microphysics RGB), above, shows baroclinic leaf over the Hawaiian islands that is suggestive of the early stages of a developing mid-latitude cyclone. Air Mass RGB over roughly the same time, below (source), is also suggestive of a developing cyclone. The orange values in the RGB to the west... Read More
Night MIcrophysics RGB, 0910-1140 UTC on 11 March 2024
CSPP Geosphere imagery (Night Microphysics RGB), above, shows baroclinic leaf over the Hawaiian islands that is suggestive of the early stages of a developing mid-latitude cyclone. Air Mass RGB over roughly the same time, below (source), is also suggestive of a developing cyclone. The orange values in the RGB to the west and south of Hawai’i can denote air that is rich in Potential Vorticity,
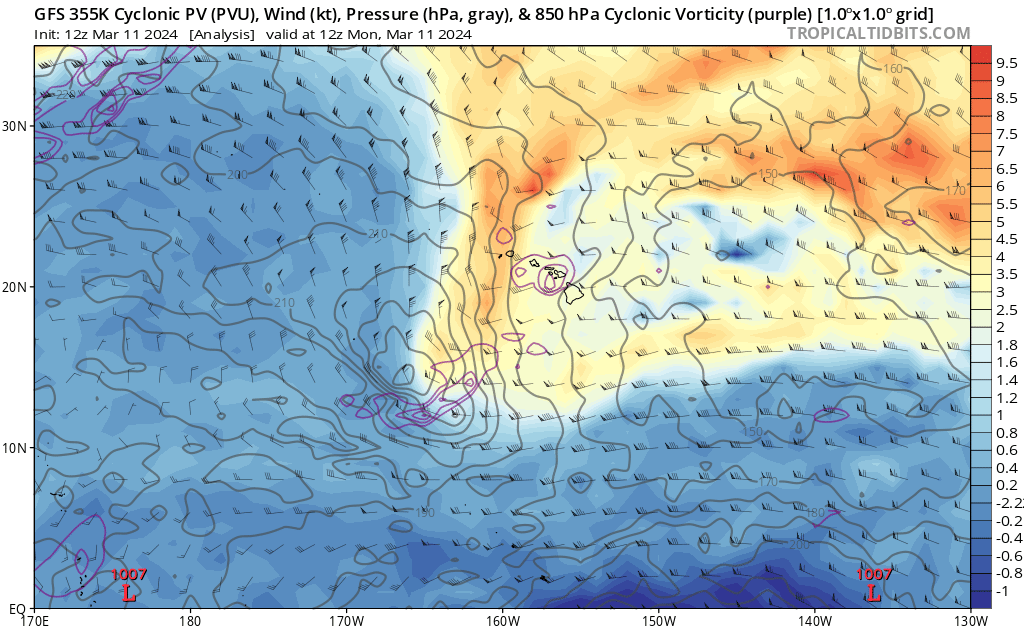
GOES-West airmass RGB imagery 0820 – 1640 UTC on 11 March 2024 (Click to enlarge)Cyclonic PV Units on the 355K Isentropic surface, 1200 UTC on 11 March 2024 (Click to enlarge)
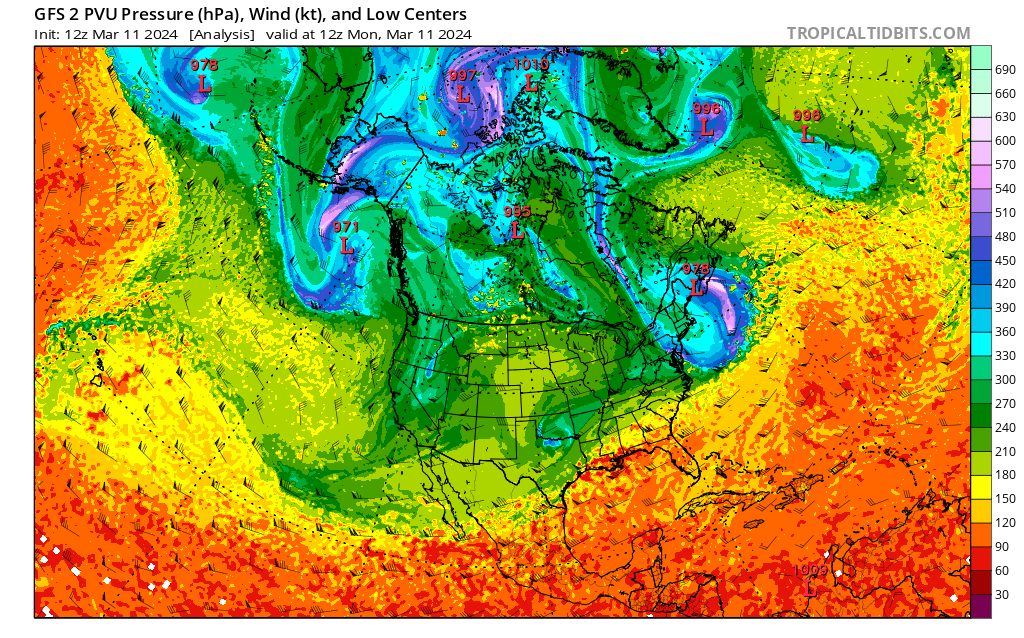
Imagery from the handy TropicalTidbits website, above and below at 1200 UTC on 11 March 2024, show signatures consistent with air rich in Potential Vorticity to the west of the Hawai’ian Islands.
Pressure on the 2 PVU surface, 1200 UTC on 11 March 2024 (Click to enlarge)
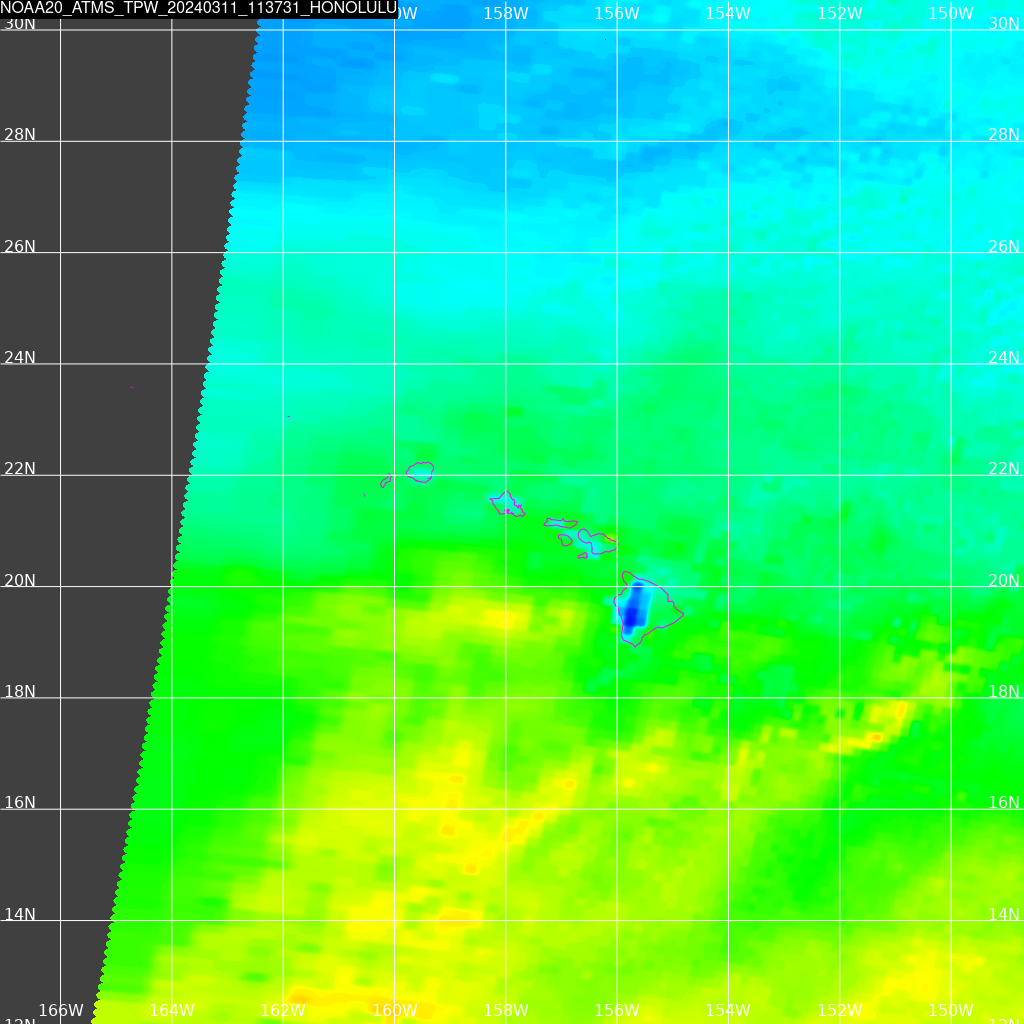
How much precipitation is associated with this extensive cirrus shield? Direct Broadcast data from this site includes VIIRS imagery and MIRS RainRates, and the microwave data can show you the TPW distribution, and the Rain Rates. NOAA-20 overflew the region at 1137 UTC on 11 March. Rain was primarily over and south of the islands, where the moisture-rich atmosphere was. Microwave data gives important information about rain in regions where cirrus clouds might prevent an accurate determination of rains. Suomi-NPP overflew the region at 1227 UTC (imagery shown at bottom) and gives similar information.
NOAA-20 I05 (11.45) imagery as well as ATMS estimates of Total Precipitable Water and Rain Rates, 1137 UTC on 11 March 2024 (click to enlarge)Suomi-NPP I05 (11.45) imagery as well as ATMS estimates of Total Precipitable Water and Rain Rates, 1227 UTC on 11 March 2024 (click to enlarge)
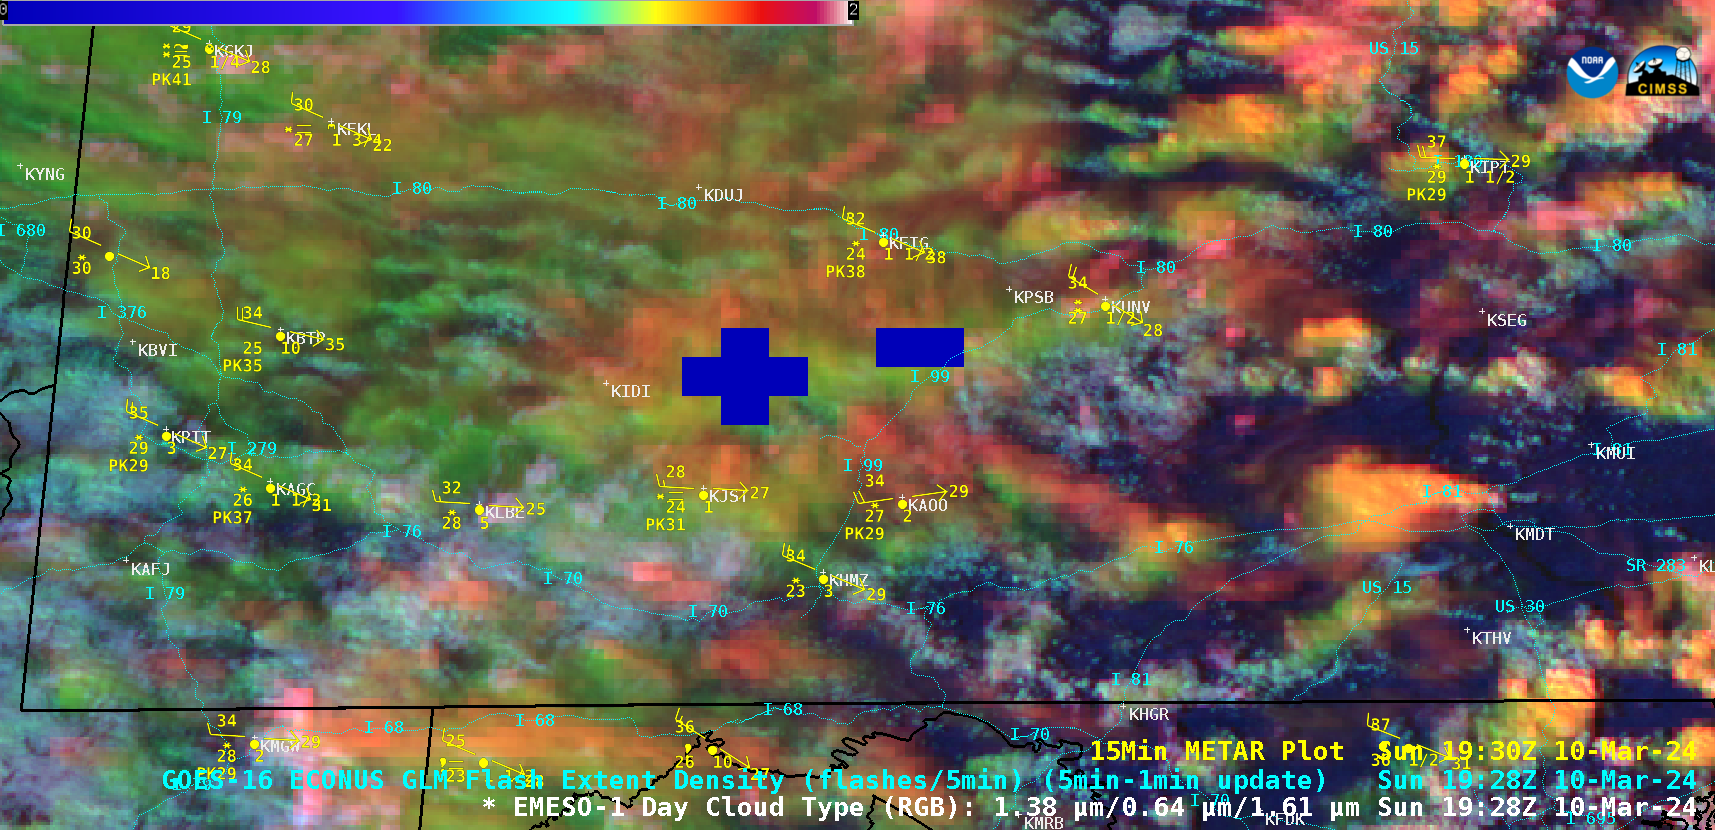
1-minute Mesoscale Domain Sector GOES-16 (GOES-East) Day Cloud Type RGB images (above) displayed narrow bands of mixed phase to glaciated (brighter shades of green to yellow) clouds that produced snow squalls as they moved eastward across western and central Pennsylvania in the wake of a cold frontal passage on 10 March 2024. Periodic lightning activity — denoted... Read More
1-minute GOES-16 Day Cloud Type RGB images, with an overlay of GLM Flash Extent Density [click to play animated GIF| MP4]
1-minute Mesoscale Domain Sector GOES-16 (GOES-East) Day Cloud Type RGB images (above) displayed narrow bands of mixed phase to glaciated (brighter shades of green to yellow) clouds that produced snow squalls as they moved eastward across western and central Pennsylvania in the wake of a cold frontal passage on 10 March 2024. Periodic lightning activity — denoted by blue GLM Flash Extent Density pixels — was seen with some of these snow squall bands. These snow squalls briefly reduced the surface visibility to 1/4 mile at some sites.
GOES-16 Day Cloud Type RGB image at 1519 UTC — with/without an overlay of GLM Flash Extent Density — with cursor displays of the corresponding Cloud Top Phase (red), Cloud Top Temperature (blue) and Cloud Top Height (green) derived products [click to enlarge]
The Pittsburgh and State College NWS forecast offices issued numerous Snow Squall Warnings for these features.
Every Spring and Fall Equinox season, a brief period of solar Radio Frequency Interference (RFI) occurs whenever the Sun passes into the beam of a GOES ground station receiving antenna (2023 NOAA ESPC Notification). This RFI can cause a temporary degradation or even a complete loss of data reception. The exact time of... Read More
GOES-16 “Clean” Infrared Window images, from 1650-1730 UTC on 01-06 March [click to play animated GIF | MP4]
Every Spring and Fall Equinox season, a brief period of solar Radio Frequency Interference (RFI) occurs whenever the Sun passes into the beam of a GOES ground station receiving antenna (2023 NOAA ESPC Notification). This RFI can cause a temporary degradation or even a complete loss of data reception. The exact time of RFI will vary somewhat on a given day, depending on where the GOES receiving antenna is located.
During the Spring of 2024, Full Disk images showed that the time of maximum RFI signal loss was 1700 UTC on 01-05 March for GOES-16 (GOES-East)(above), and 2140 UTC on 02-05 March for GOES-18 (GOES-West) (below).
GOES-18 “Clean” Infrared Window images, from 2130-2150 UTC on 02-06 March [click to play animated GIF | MP4]
Parts of the Hawaiian Islands have been placed under Flood Warnings on 4 March 2024 (Link). Part of the reason for these heavy rains is unusually cold air aloft, at 500 mb. The animation above (from the CSPP Geosphere site — a direct link to the animation is here) shows a... Read More
GOES-West PACUS sector Night Microphysics RGB over the Hawai’ian Islands, 1121 – 1556 UTC on 4 March 2024
Parts of the Hawaiian Islands have been placed under Flood Warnings on 4 March 2024 (Link). Part of the reason for these heavy rains is unusually cold air aloft, at 500 mb. The animation above (from the CSPP Geosphere site — a direct link to the animation is here) shows a characteristic color change in the Night Microphysics around the Hawai’ian islands as convective showers develop, from light pinks/whites to red. How cold are the temperatures at 500 mb that are helping support this convection?
Upper-air sounding at Lihue, 0000 UTC on 2 March and 1200 UTC on 4 March 2024 (Click to enlarge)
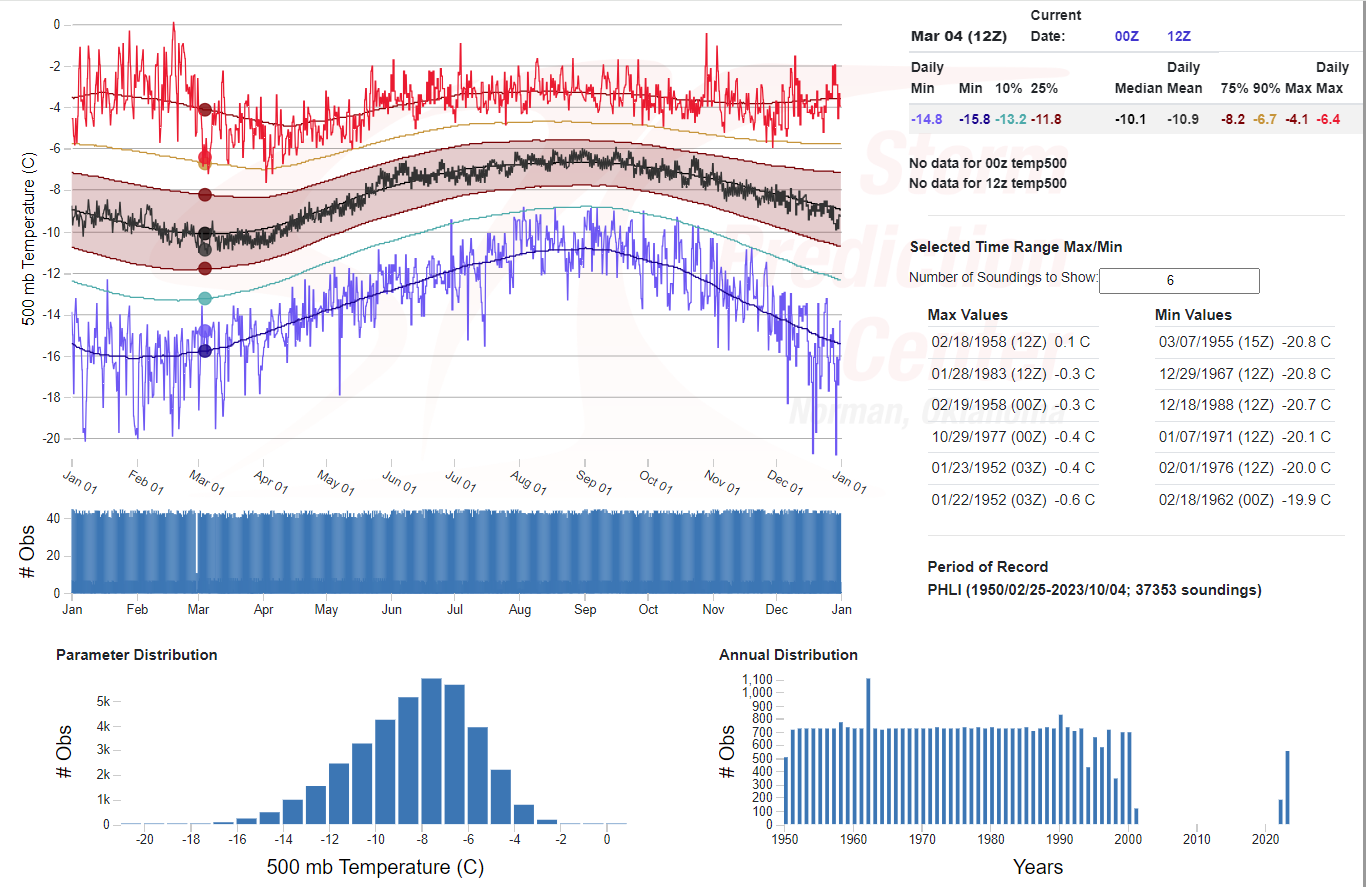
Soundings at Lihue at 0000 UTC on 2 March and 1200 UTC 4 March (above, from the University of Wyoming sounding site) show consistenly cold temperatures, at -14.7oC, although temperatures were warmer on 3 March, closer to -11oC. The 500-mb temperatures on 4 March at 1200 UTC were colder than all but <10% of the observations per the analysis below from the SPC Sounding analysis site.
Sounding statistics of 500-mb Temperatures at Lihue, Hawaii (Click to enlarge)
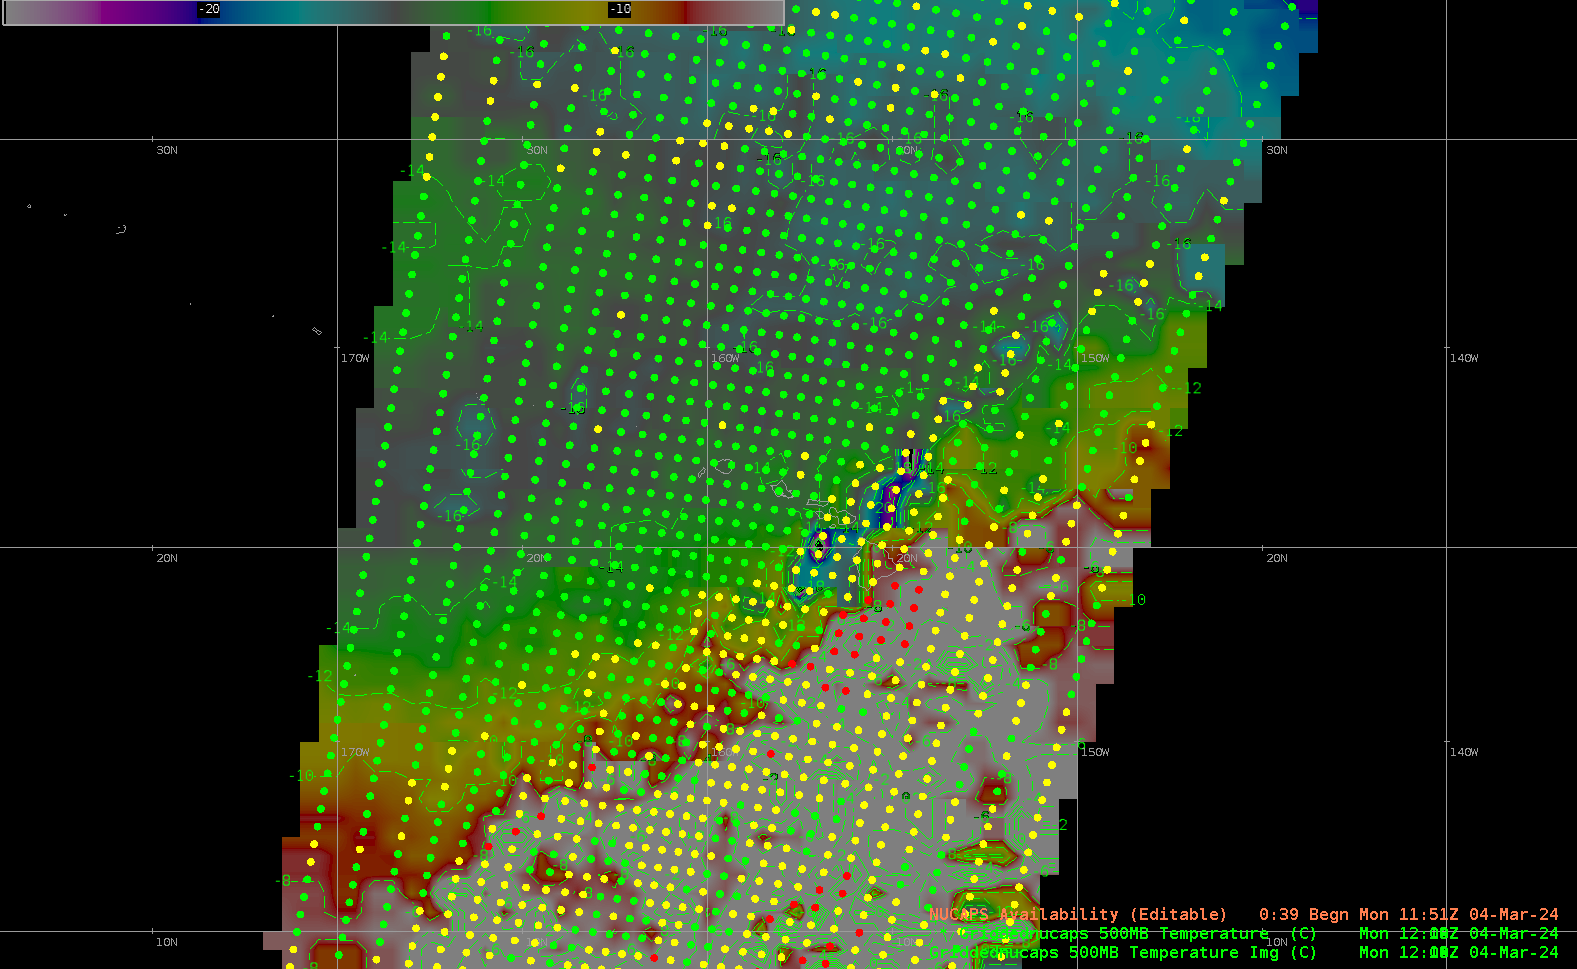
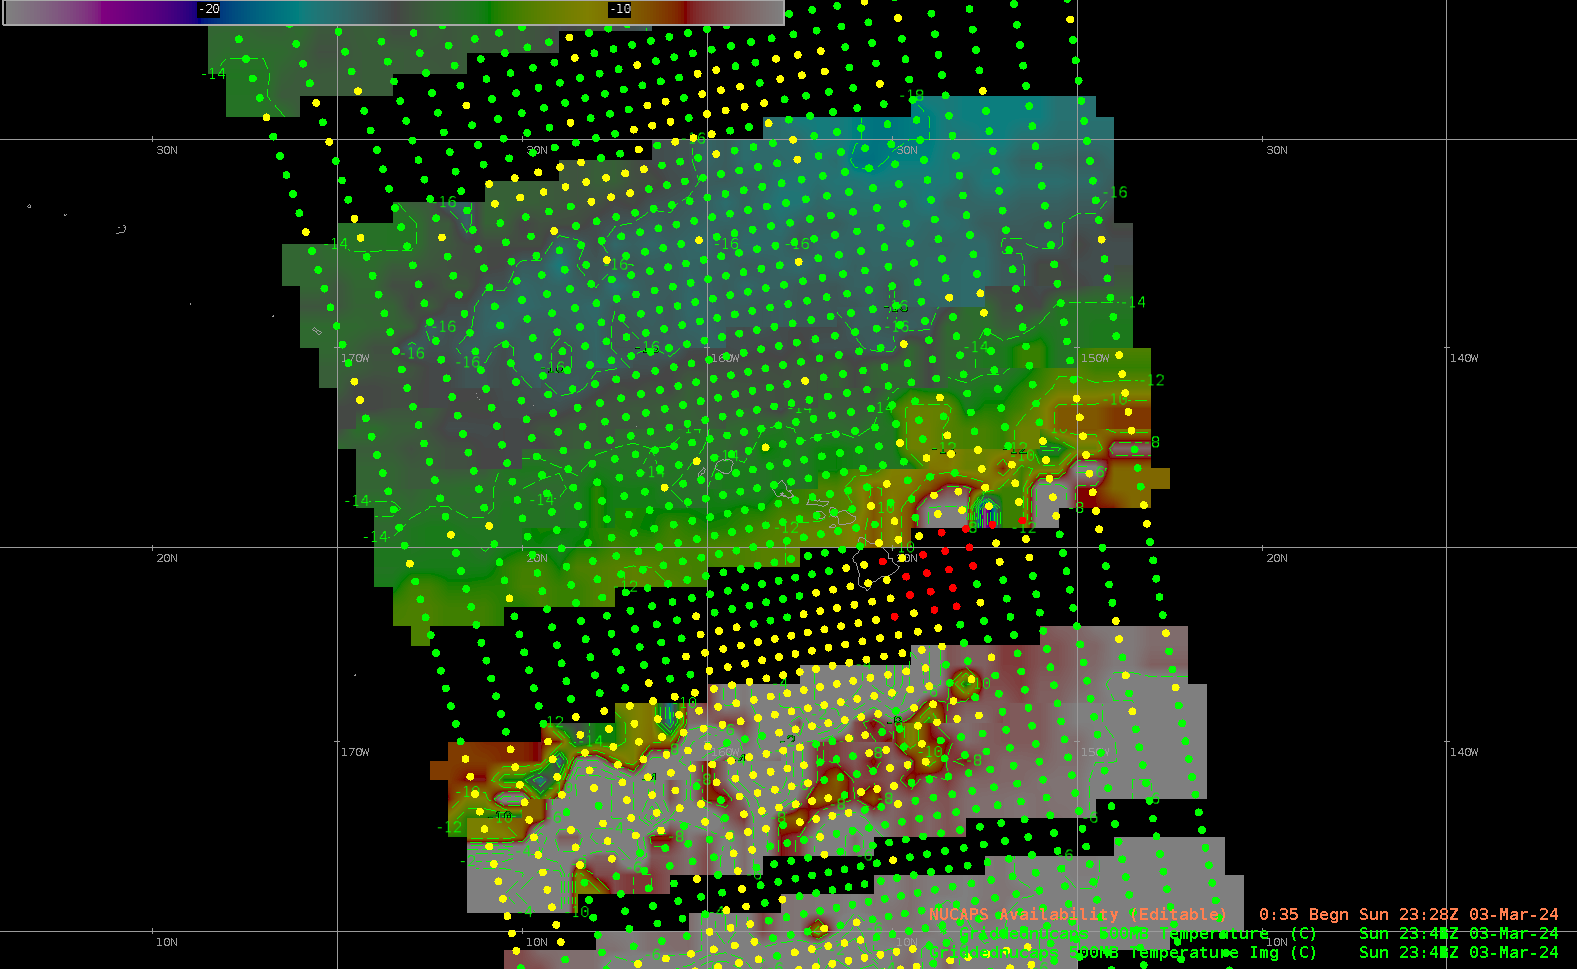
NOAA-20 NUCAPS profiles give twice-daily estimates of thermodynamic variables over the Hawai’ian islands. These profiles are an important data source over ocean regions where conventional data are otherwise rare. The analyses near 0000 and 1200 UTC on 4 March 2024, below, show the large extent of cold temperatures at 500 mb, with temperatures between -14 and -16oC just north of Kauai. Temperatures are warmer over the big Island of Hawai’i. Use NUCAPS profiles to monitor cold temperatures at 500 mb when unusual cold is ongoing.
Gridded NUCAPS temperatures at 500 mb, ca. 2340 UTC on 3 March 2024 (Click to enlarge)Gridded NUCAPS temperatures at 500 mb, ca. 1200 UTC on 4 March 2024 (Click to enlarge)
The gridded NUCAPS fields above are from AWIPS. You can also access them at this RealEarth site, and at this site maintained by SPoRT. The animation below of imagery from the SPoRT site shows values from 1200 UTC 2 March through 1200 UTC 4 March. Colder air overspread the western Hawaiian islands on the 4th.
Gridded NUCAPS temperatures at 500 mb, 1206 UTC on 2 March – 1110 UTC on 5 March 2024 (Click to enlarge)

