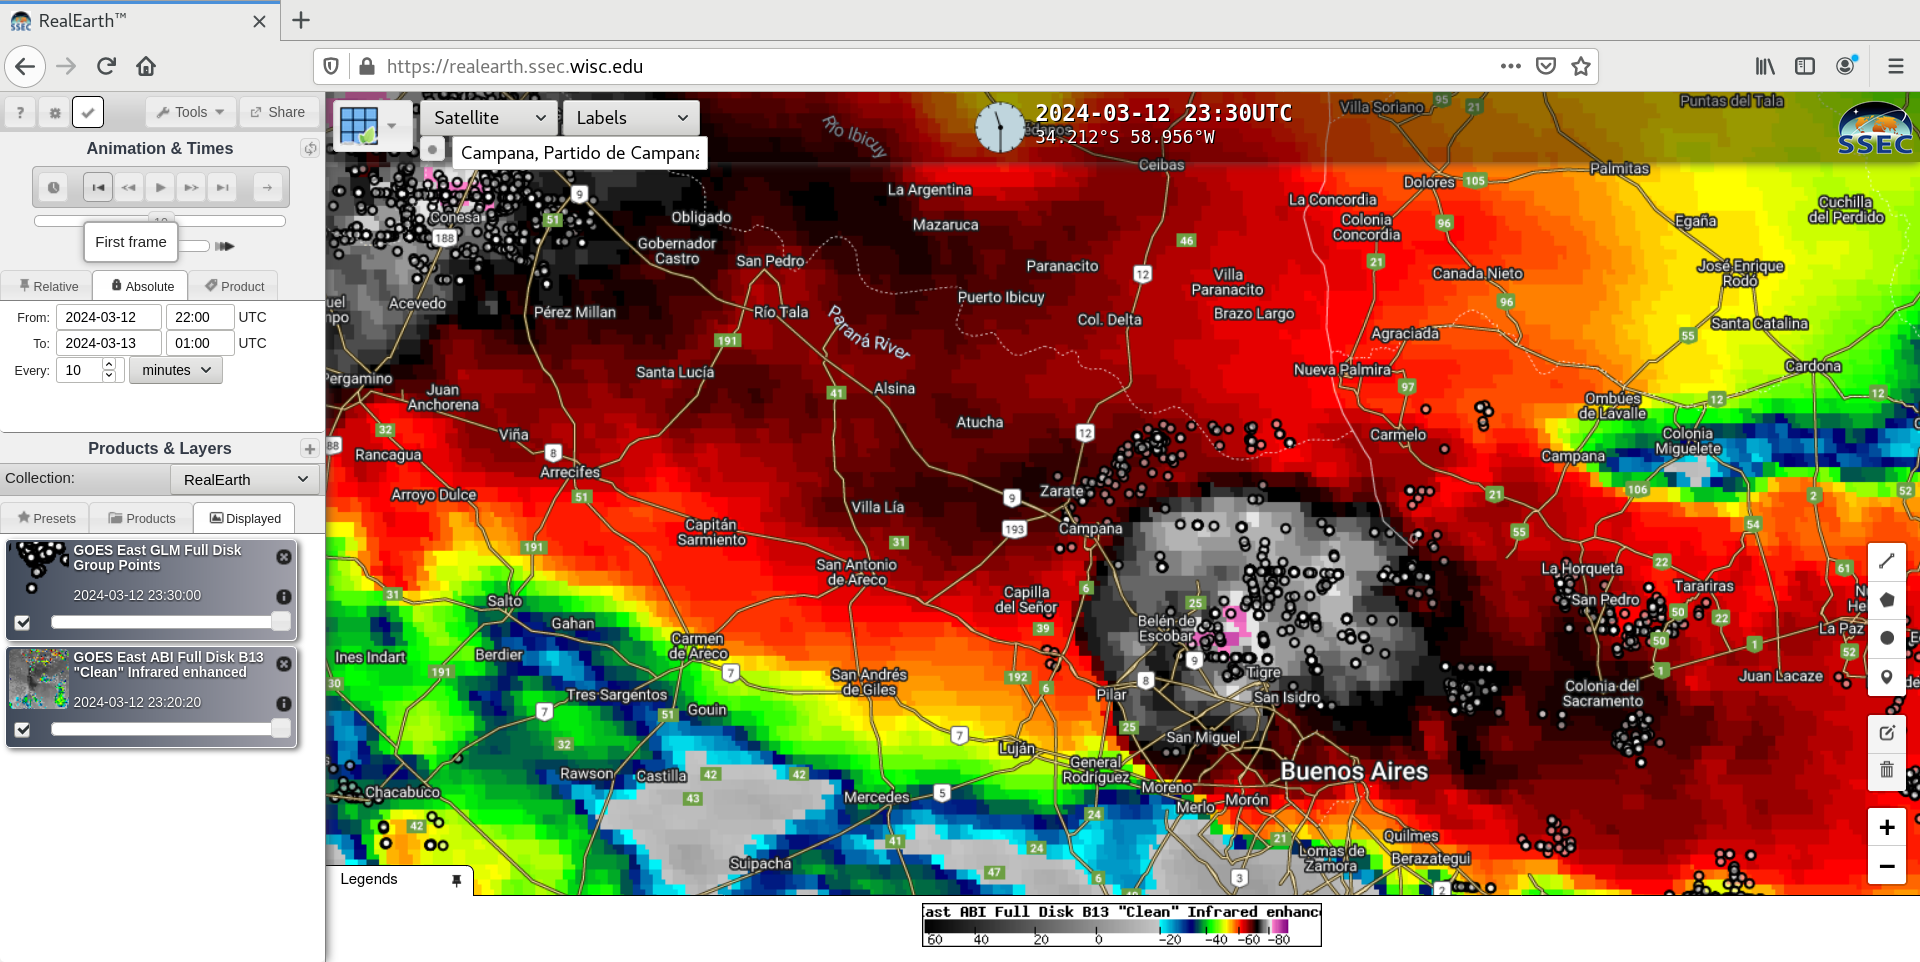
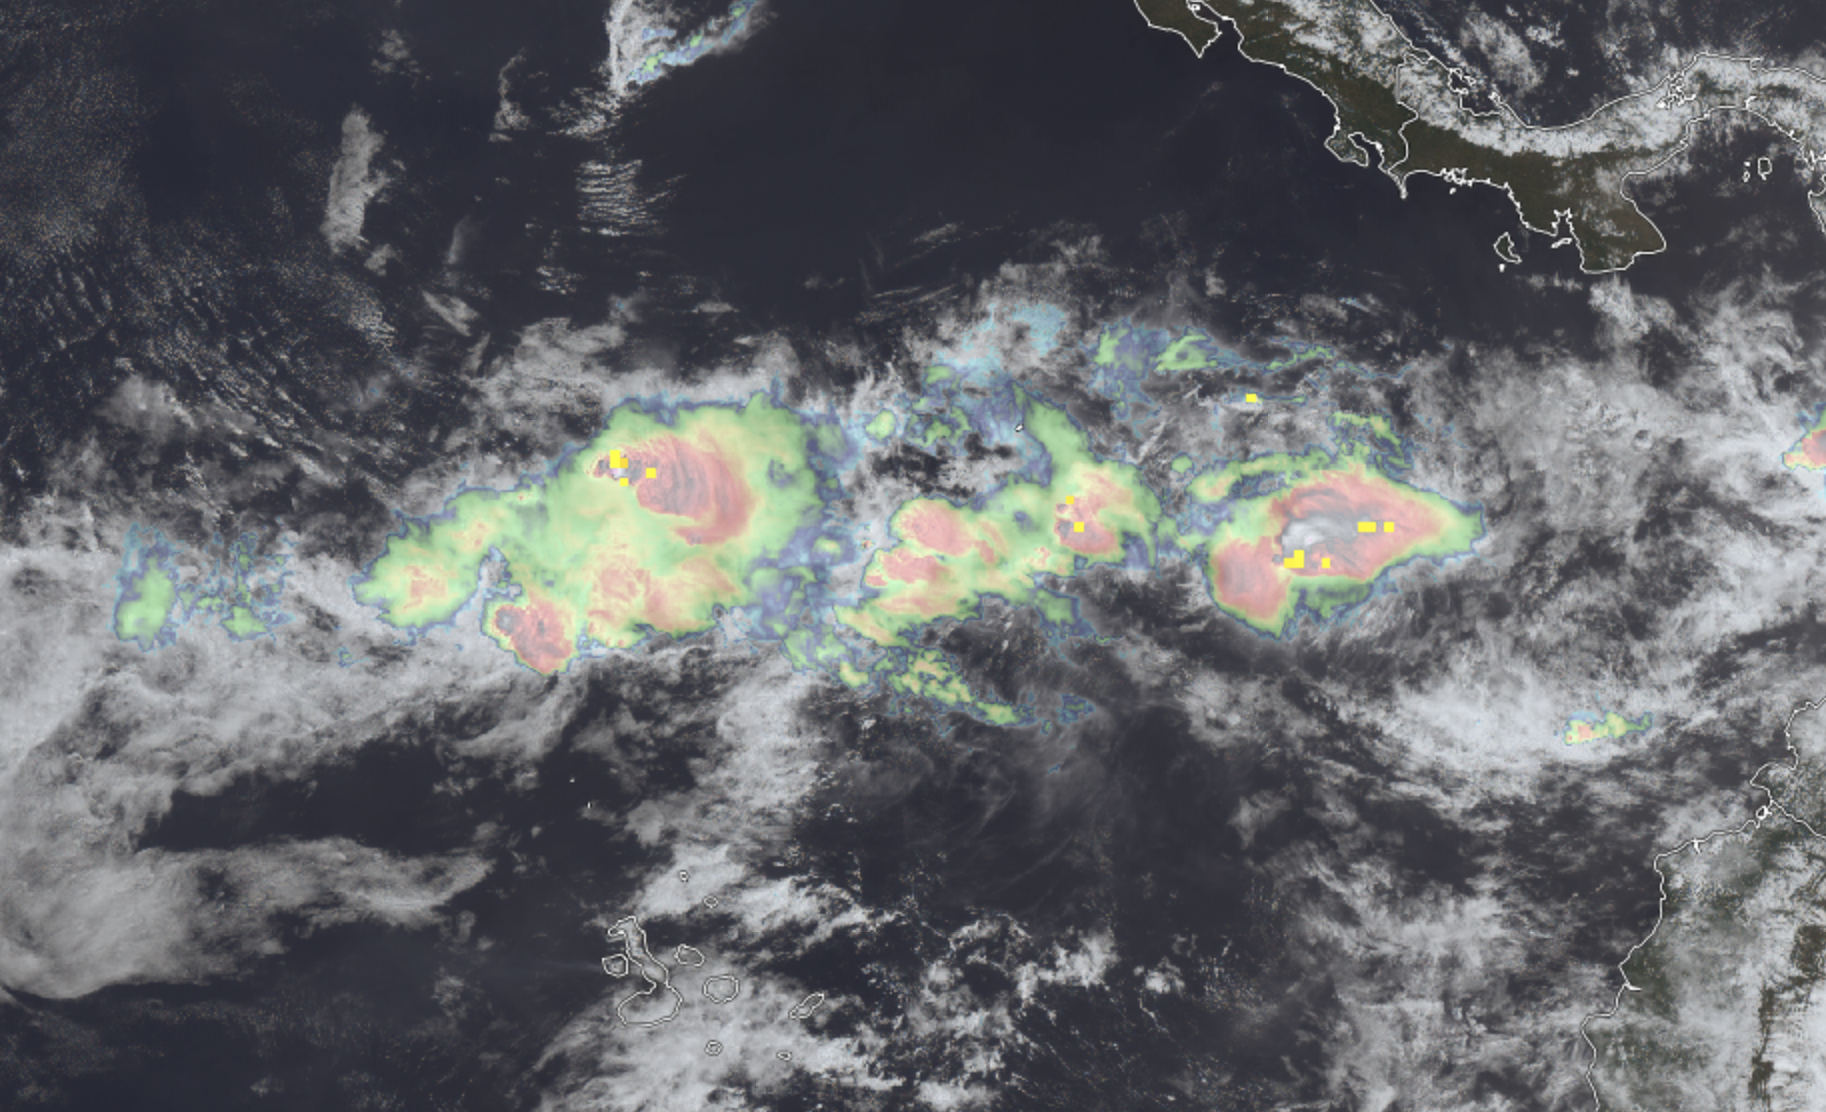
GOES-16 “Clean” Infrared Window (10.3 µm) images with plots of GLM Group Points, from 2200 UTC on 12 March to 0100 UTC on 13 March [click to play animated GIF | MP4]
10-minute Full Disk scan GOES-16 (GOES-East) “Clean” Infrared Window (10.3 µm) images displayed using RealEarth (above) showed the development of a thunderstorm that produced giant hail in Campana, Argentina during the evening hours (local time) on 12 March 2024. An overlay of GLM Group Points depicted a good deal of lightning activity associated with that particular storm. This thunderstorm activity occurred in advance of a cold front that was moving northward toward the area (surface analyses).
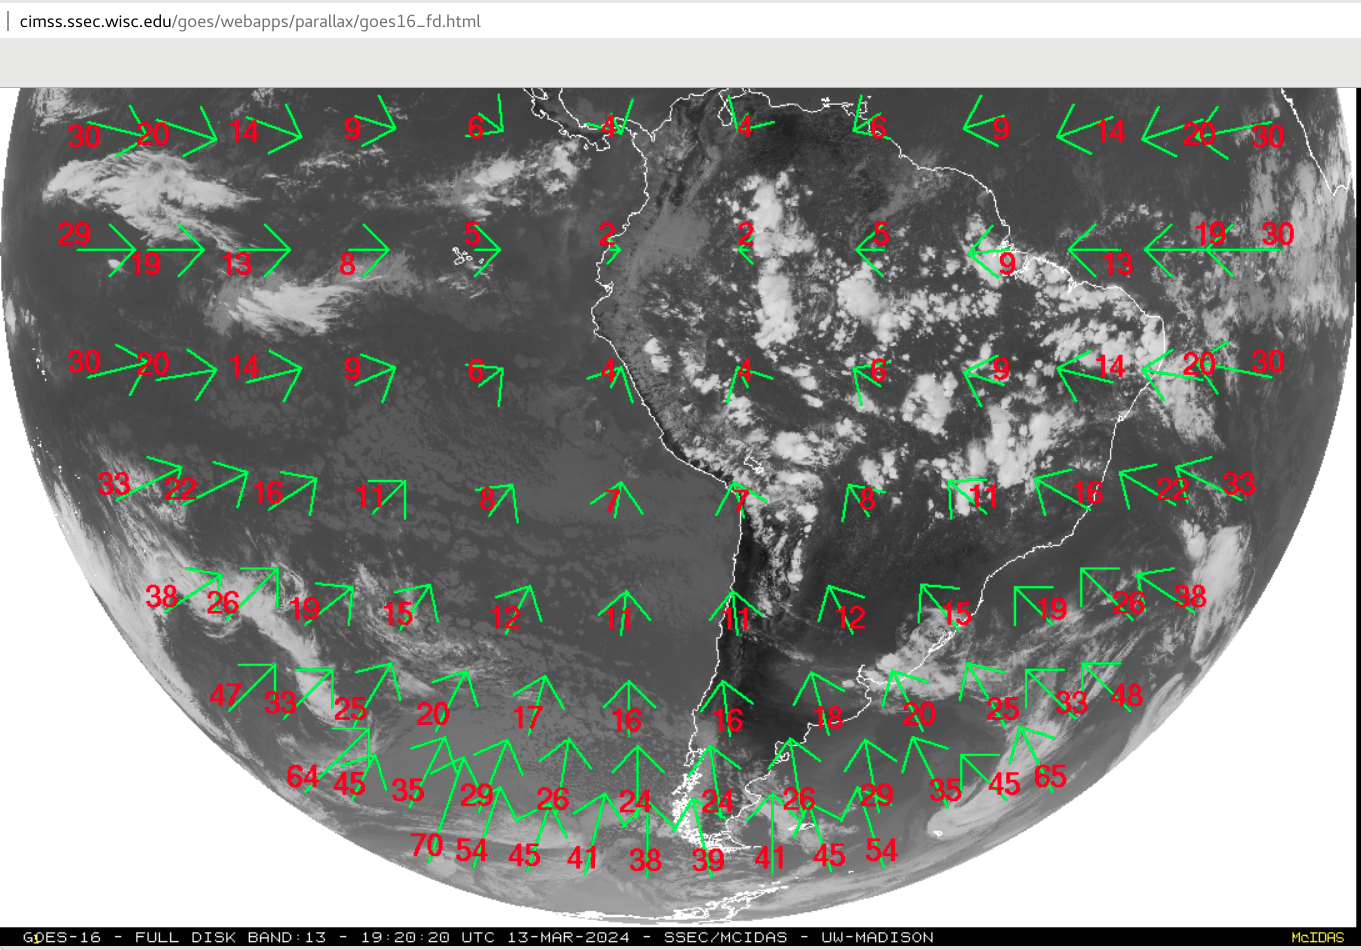
Note that the thunderstorm appeared to pass southeast of Campana — but a parallax correction of about 18 km to the northwest is necessary for a tall cloud top at that location, as shown at this site.
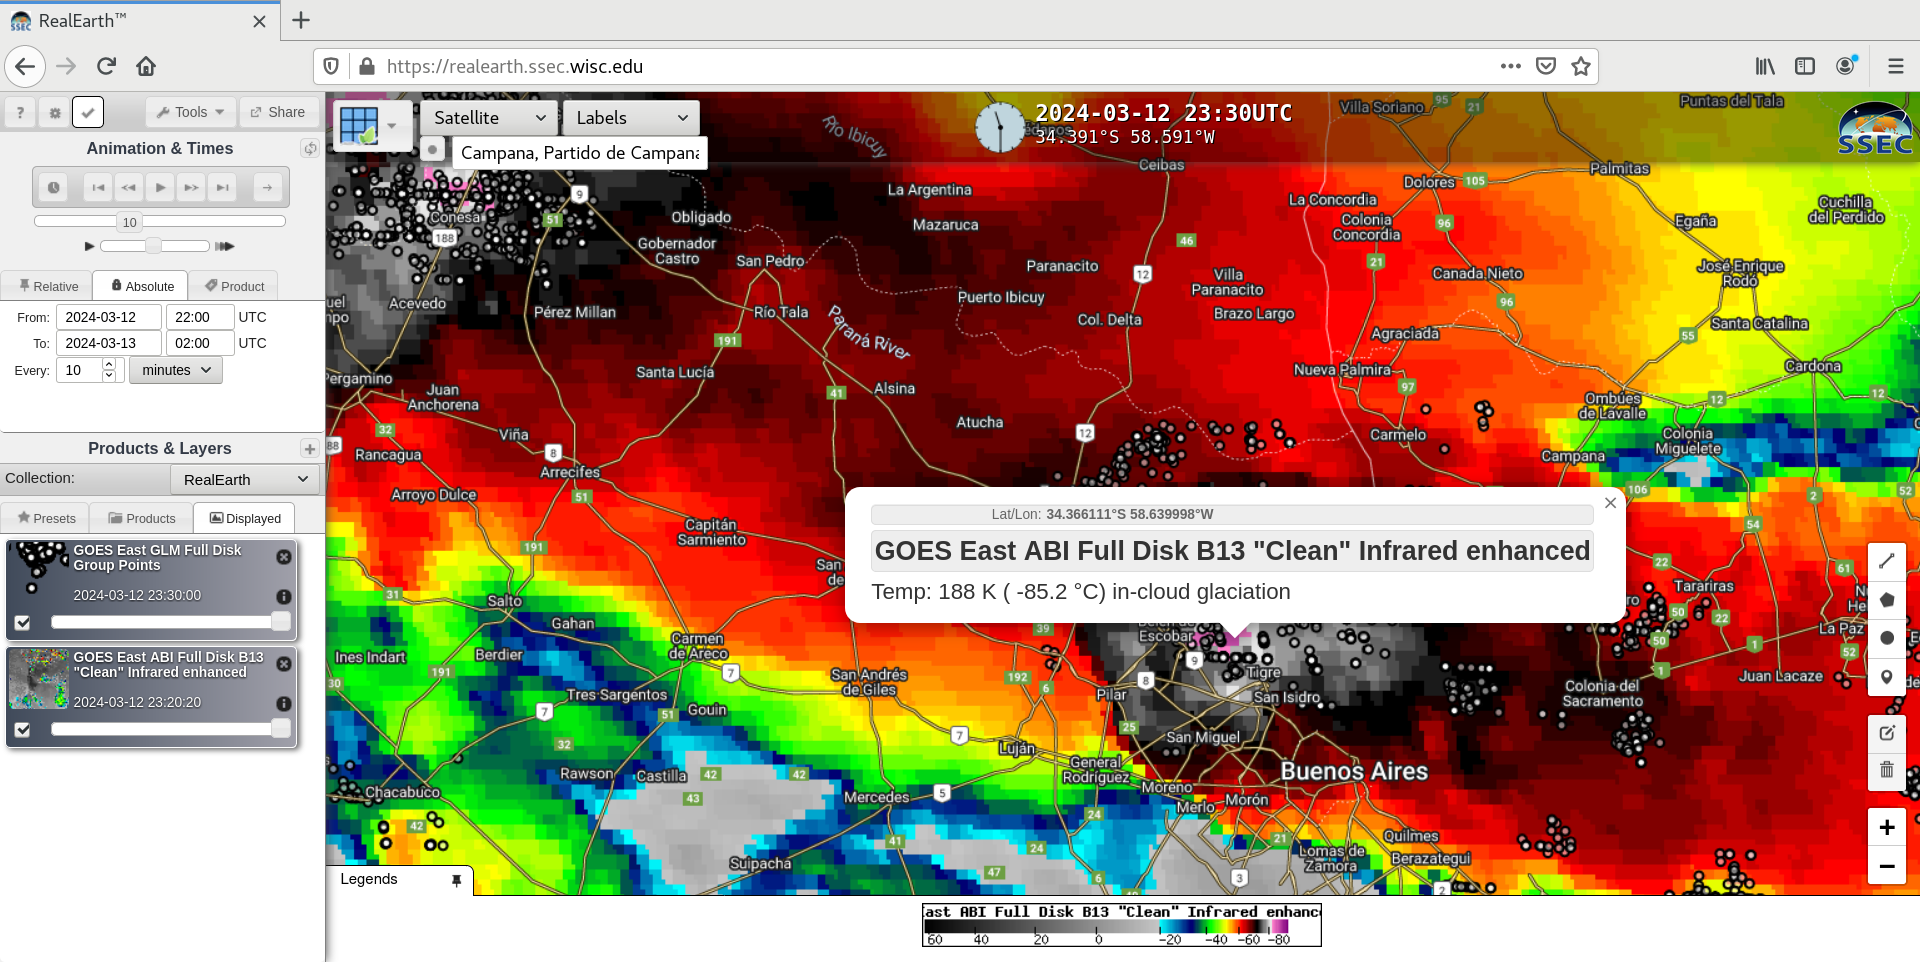
GOES-16 “Clean” Infrared Window (10.3 µm) image at 2330 UTC on 12 March, with a probe of the coldest infrared brightness temperature [click to enlarge]
A probe of the coldest 10.3 µm infrared brightness temperature at 2330 UTC (above) showed -85.2ºC — which was several degrees colder than that of the tropopause (-80.7ºC) in 1200 UTC rawinsonde data at Santa Rosa (below).
Plot of rawinsonde data from Santa Rosa at 1200 UTC on 12 March [click to enlarge]
View only this post Read Less

