This website works best with a newer web browser such as Chrome, Firefox, Safari or Microsoft
Edge. Internet Explorer is not supported by this website.
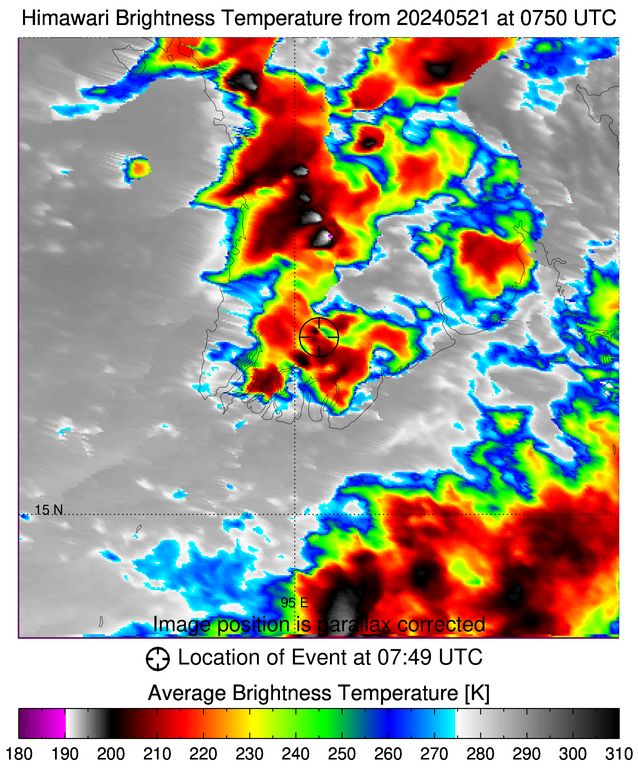
This blog post shows satellite imagery with a Singapore Airlines Boeing 777-300ER that encountered severe turbulence while flying over southern Myanmar (information from flightradar) at 0749 UTC on 21 May 2024. This graphic from Sarah Griffin, CIMSS, shows the turbulence location/time; other graphics/animations from this event are in this directory that Sarah Griffin created.LightningCast probabilities... Read More
This blog post shows satellite imagery with a Singapore Airlines Boeing 777-300ER that encountered severe turbulence while flying over southern Myanmar (information from flightradar) at 0749 UTC on 21 May 2024. This graphic from Sarah Griffin, CIMSS, shows the turbulence location/time; other graphics/animations from this event are in this directory that Sarah Griffin created.
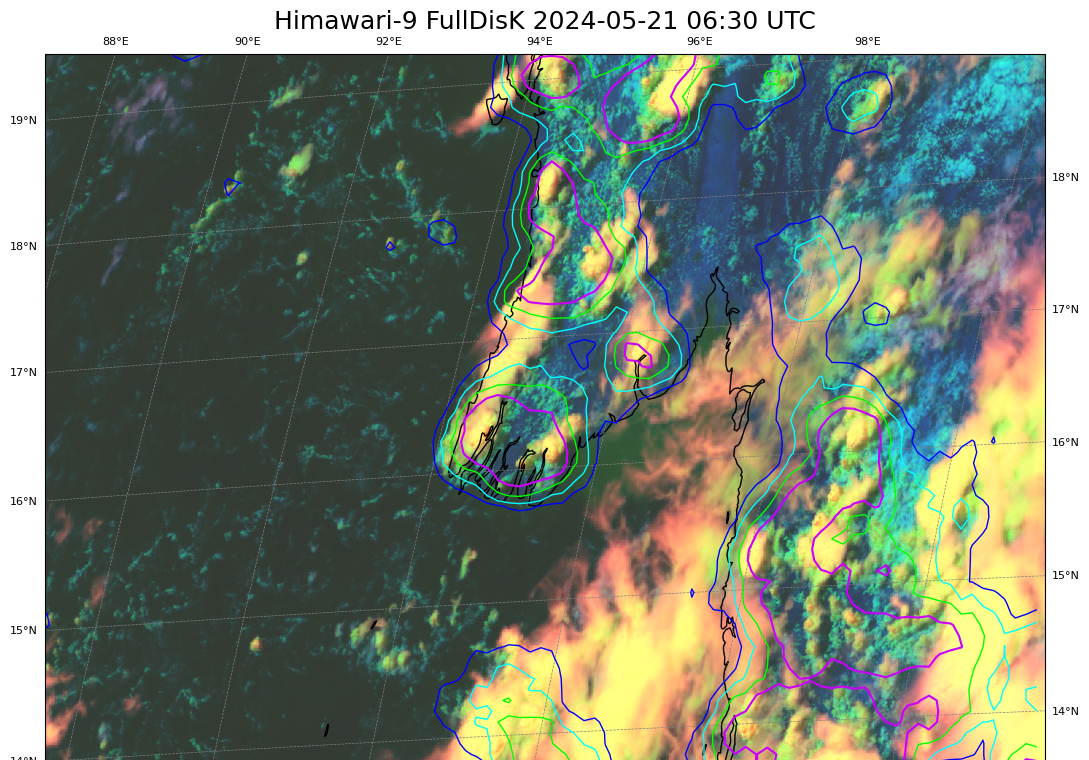
Himawari-9 LightningCast probabilities over Day Cloud Phase Distinction RGB, 0630 UTC on 21 May 2023 (Click to enlarge)
LightningCast probabilities predict where an (in this case, hypothetical) GLM instrument would detect a lightning flash in the next 60 minutes based on current ABI or AHI imagery at 0.64 µm, 1.61 µm, 10.3 µm and 12.3 µm. Although this machine-learning tool was trained on GOES-East ABI and GLM imagery, it is being applied to the similar AHI instrument that flies on Himawari-9. (Real-time Himawari-9 LightningCast imagery is available at this RealEarth instance under the ‘Guam’ sector). The LightningCast contours shown in this blog post were created using a CSPP Geo software package in development/testing at CIMSS, with a Beta release on the horizon. More than an hour before the turbulence that affected the Boeing 777, LightningCast is suggesting the region is very likely to have lightning. The animation below shows how the LightningCast contours (and satellite imagery) changed between 0630 and 0800 UTC on 21 May. Diagnosed probabilities of lightning remain high over the region throughout the 80-90 minutes prior to the turbulent encounter.
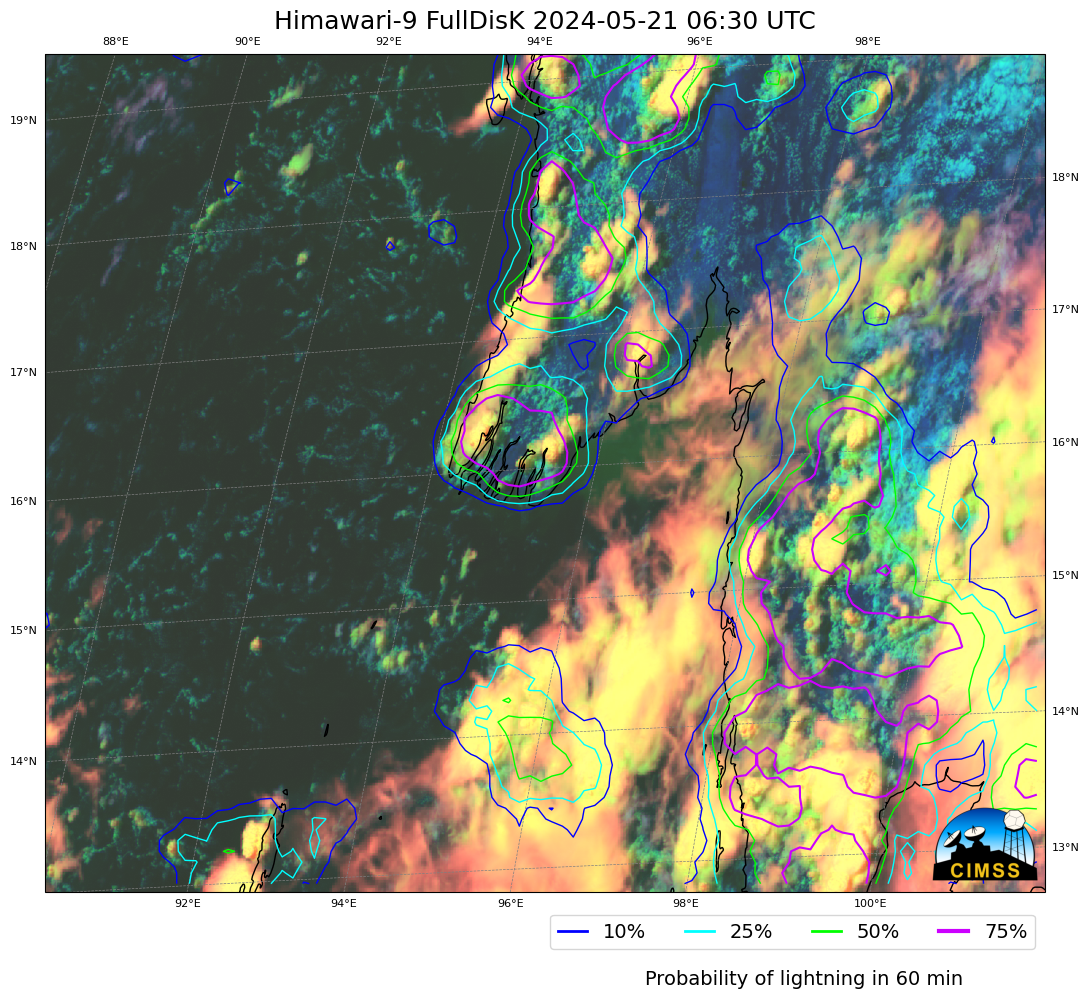
LightningCast probability contours on top of Himawari-9 Day Cloud Phase Distinction RGB, every 10 minutes from 0630 – 0800 UTC on 21 May 2024 (Click to enlarge)
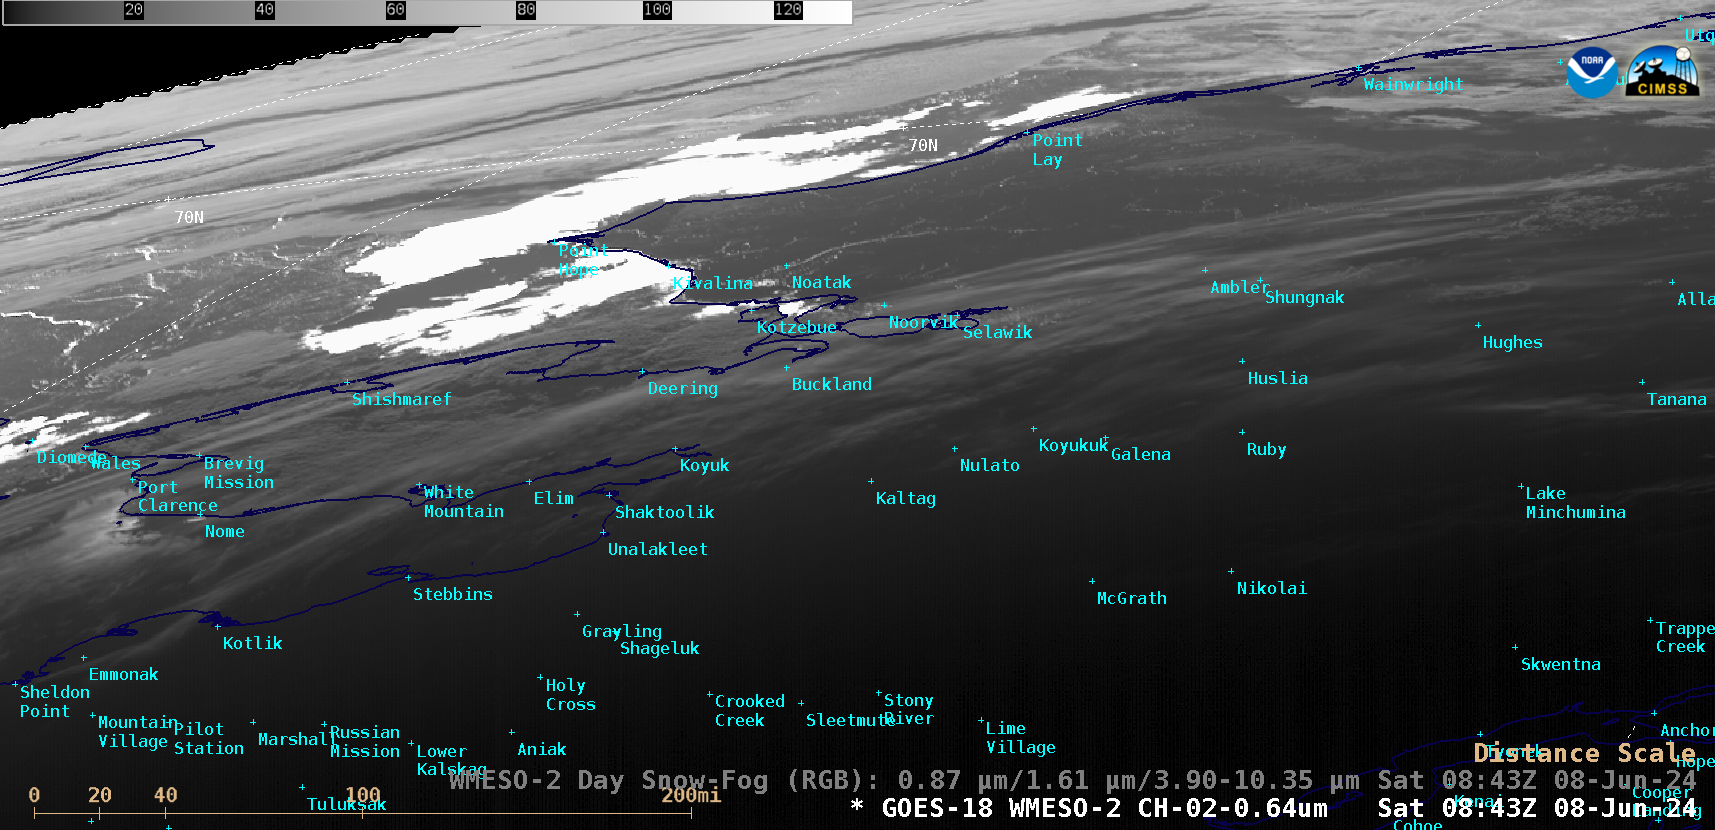
1-minute Mesoscale Domain Sector GOES-18 (GOES-West) “Red” Visible (0.64 µm) images (above) showed areas of bright sun glint off the open (ice-free) water in the Chukchi Sea — just off the coast of Alaska, from the Bering Strait to near Utqiagvik (formerly Barrow) — around 1 AM local time on 08 June 2024.... Read More
1-minute GOES-18 “Red” Visible (0.64 µm) images, from 0800-0930 UTC on 08 June [click to play animated GIF | MP4]
1-minute Mesoscale Domain Sector GOES-18 (GOES-West) “Red” Visible (0.64 µm) images (above) showed areas of bright sun glint off the open (ice-free) water in the Chukchi Sea — just off the coast of Alaska, from the Bering Strait to near Utqiagvik (formerly Barrow) — around 1 AM local time on 08 June 2024. Note how there was also sun glint off the open water of leads within the sea ice, as well as inland rivers/lakes across northern Alaska.
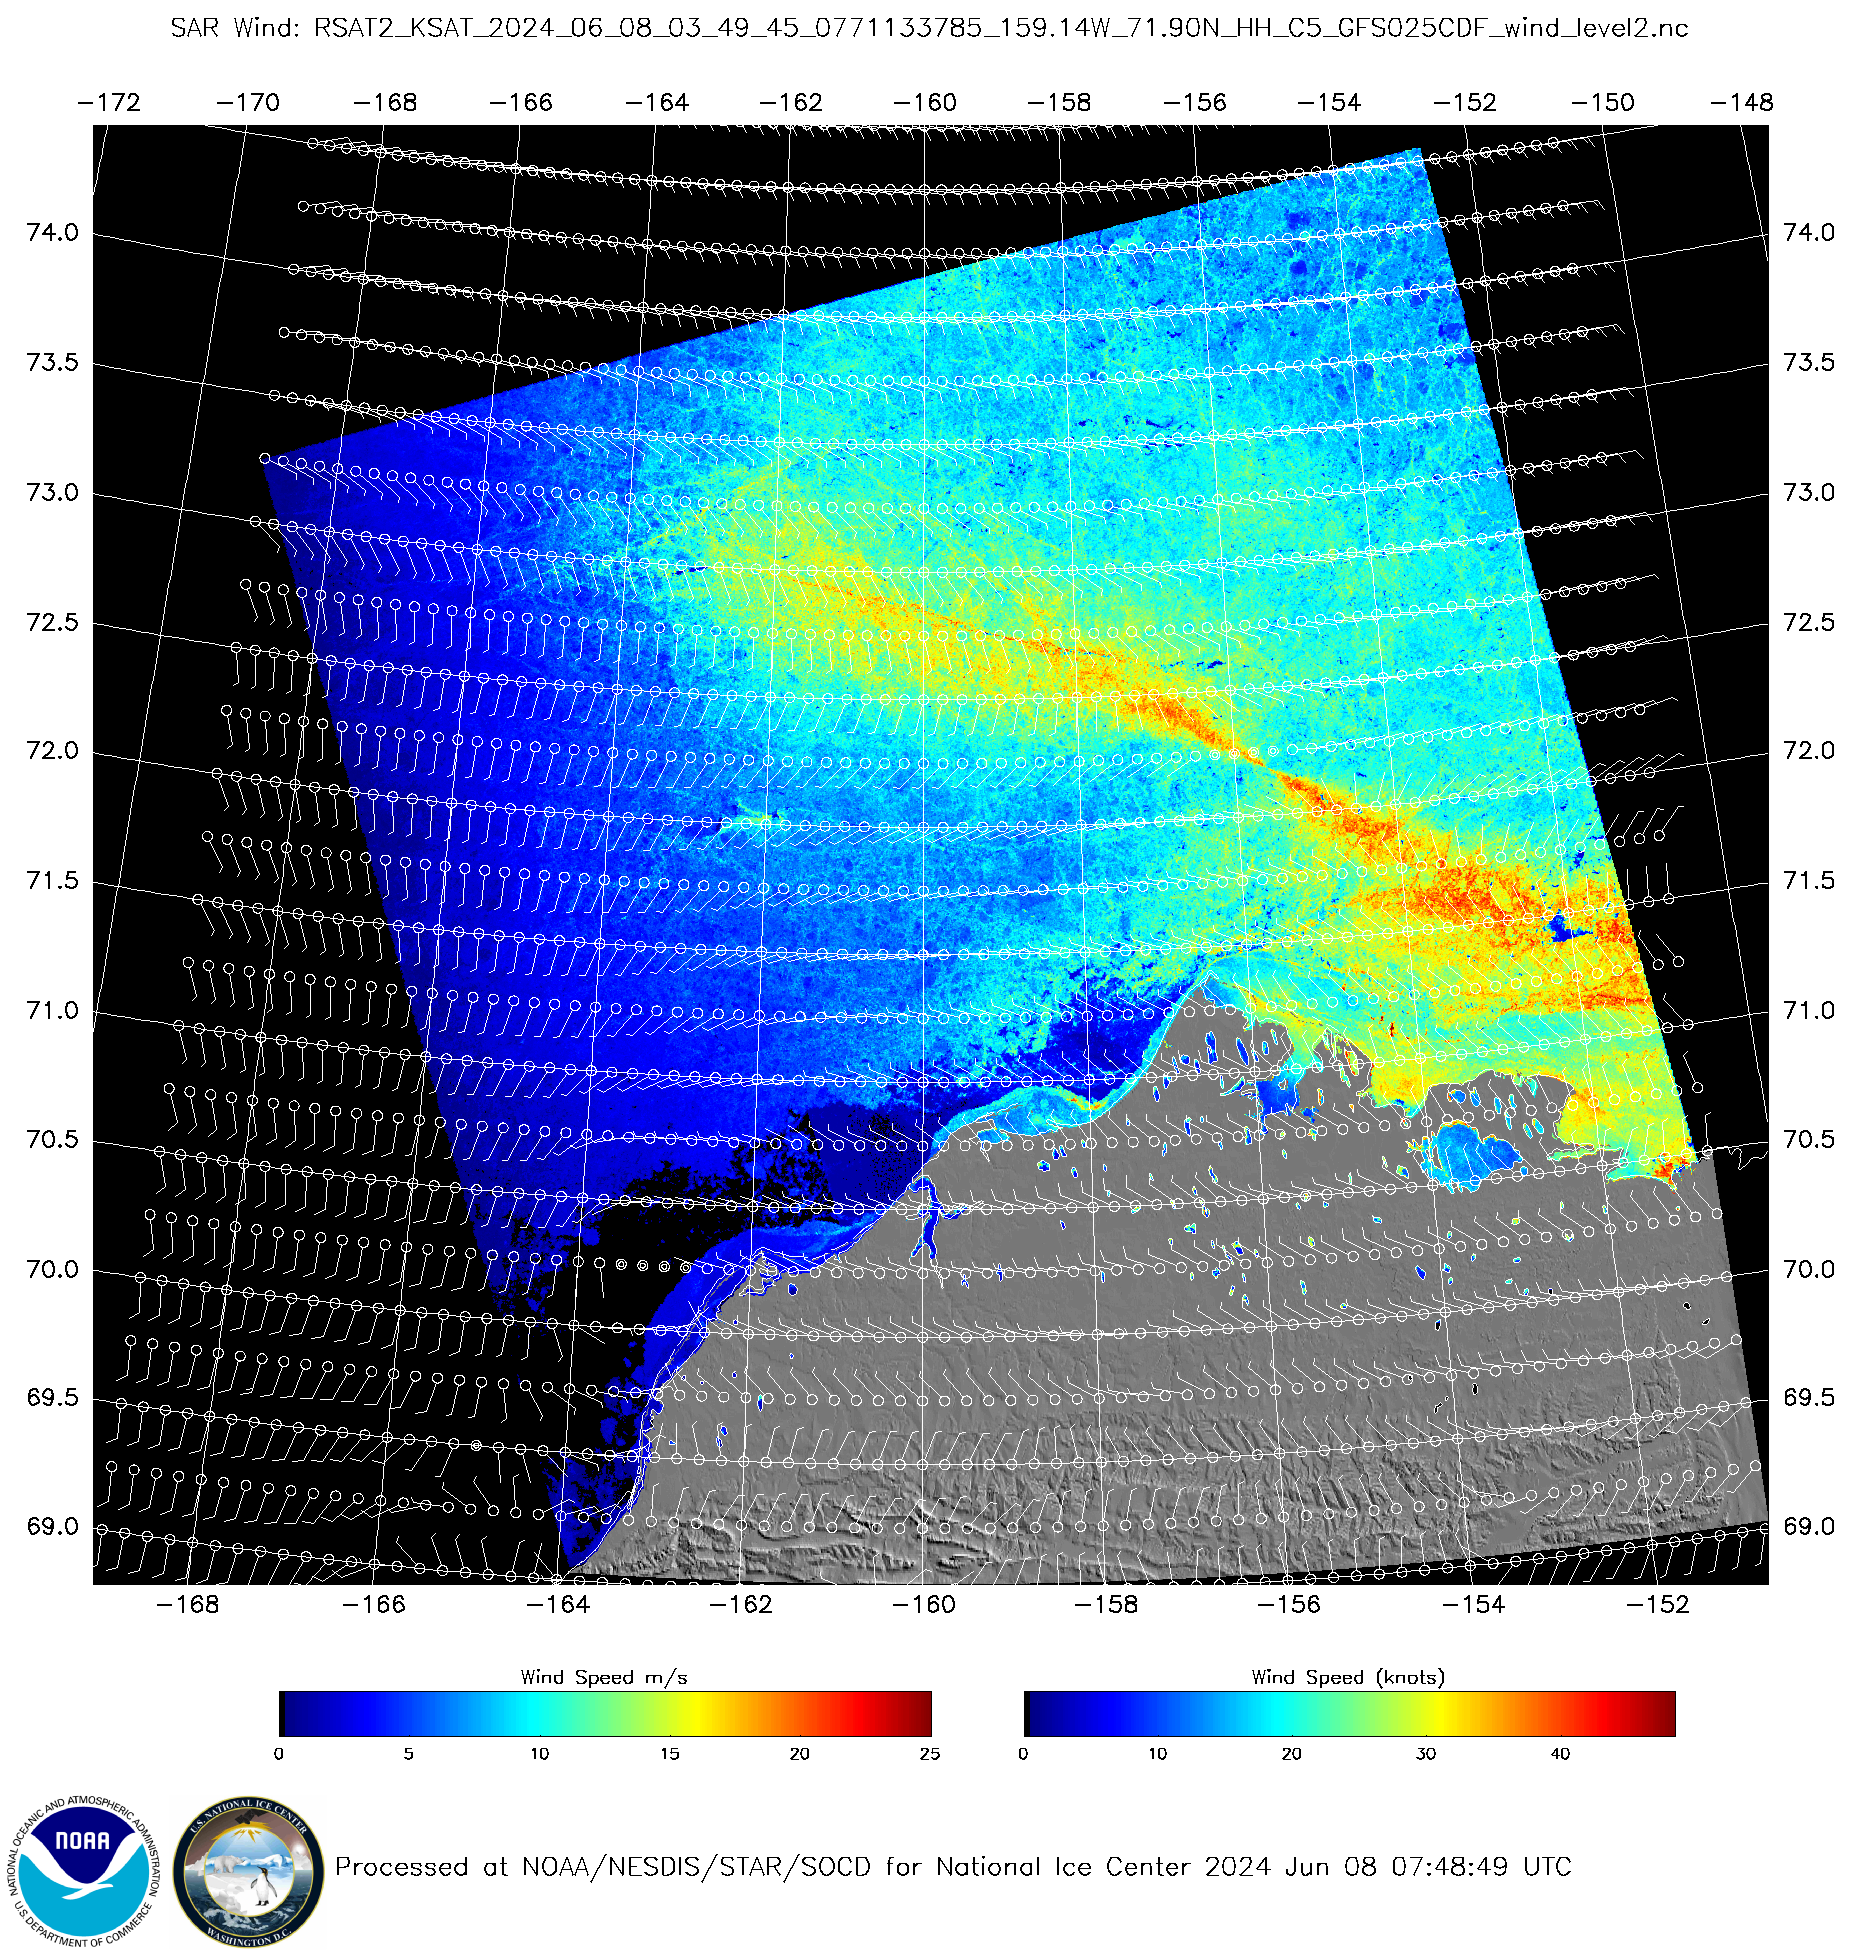
Synthetic Aperture Radar (SAR) wind speed (source) derived from an overpass of RADARSAT-2 at 0349 UTC on 08 June (below) showed that winds were generally light (or even calm) across the nearshore waters off the northwest coast of Alaska — which would be conducive to a sea surface with minimal wave height (that would more easily reflect incoming late-day sunlight arriving at a very oblique angle, enhancing sun glint).
Synthetic Aperture Radar (SAR) wind speed derived from an overpass of RADARSAT-2 at 0349 UTC on 08 June [click to enlarge]
ASCAT and OSCAT surface scatterometer winds (source) confirmed the presence of light wind speeds over a portion of the open water north of the Bering Strait, where the sun glint was seen (below).
ASCAT and OSCAT surface scatterometer winds, from 0557-0917 UTC on 08 June
During the subsequent daytime hours, a sequence of VIIRS Snowmelt RGB images sourced from GINA and displayed using RealEarth(below) provided a more detailed view of the sea ice and the areas of inland snow cover (shades of cyan to light blue), in contrast to the areas of open water (dark blue) near the Alaskan coast.
VIIRS Snowmelt RGB images, from 1923 UTC on 08 June to 0049 UTC on 09 June [click to play animated GIF | MP4]
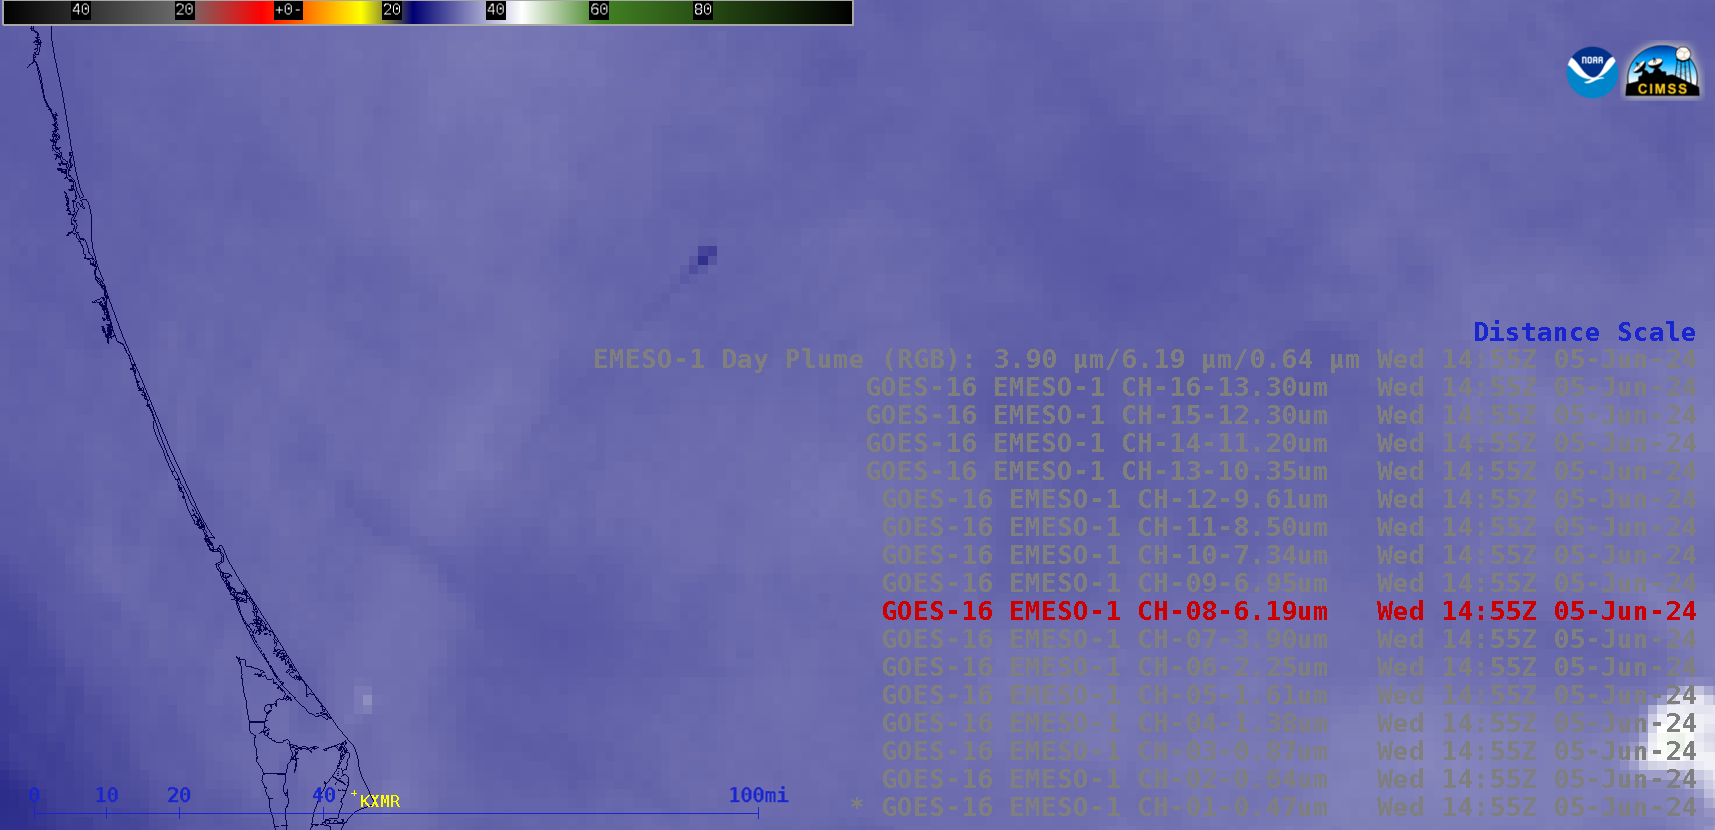
30-second Mesoscale Domain Sector GOES-16 (GOES-East) images from all 16 of the ABI spectral bands along with a Rocket Plume RGB (above) displayed signatures of a Boeing Starliner’s Atlas V rocket booster that was launched from Cape Canaveral Space Force Station in Florida at 1552 UTC (11:52 AM EST) on 05 June 2024. The... Read More
Stepped sequence of 30-second GOES-16 images from all 16 ABI spectral bands, plus a Rocket Plume RGB; KXMR denotes the location of the Cape Kennedy rawinsonde launch site [click to play animated GIF | MP4]
30-second Mesoscale Domain Sector GOES-16 (GOES-East) images from all 16 of the ABI spectral bands along with a Rocket Plume RGB(above) displayed signatures of a Boeing Starliner’s Atlas V rocket booster that was launched from Cape Canaveral Space Force Station in Florida at 1552 UTC (11:52 AM EST) on 05 June 2024. The warm thermal signature of the rocket booster (moving rapidly to the northeast) and/or the relatively cold rocket condensation cloud (drifting slowly eastward just off the coast) were evident in all of the ABI spectral band images, as well as the Rocket Plume RGB imagery.
A larger-scale view of 30-second GOES-16 Rocket Plume RGB images created using Geo2Grid(below) spans an additional 2 minutes — showing the rocket booster signature extending even farther to the northeast.
30-second GOES-16 Rocket Plume RGB images (courtesy Tim Schmit, NOAA/NESDIS) [click to play MP4 animation]
A period of high-based convection to the east and northeast of Hawaii was producing occasional lighting on 3 June 2024, as shown in the animation above. LightningCast Probabilities plotted show values around 50%, and lightning is occurring. Note that the Flash Extent Density colorbar has been modified to have a... Read More
OES-18 PACUS Clean Window (Band 13, 10.3 µm) imagery, GOES-18 GLM Flash Extent Density, and GOES-18 LightningCast Probabilities, 1646-2031 UTC on 3 June 2024 (Click to enlarge)
A period of high-based convection to the east and northeast of Hawaii was producing occasional lighting on 3 June 2024, as shown in the animation above. LightningCast Probabilities plotted show values around 50%, and lightning is occurring. Note that the Flash Extent Density colorbar has been modified to have a maximum value of only 8.
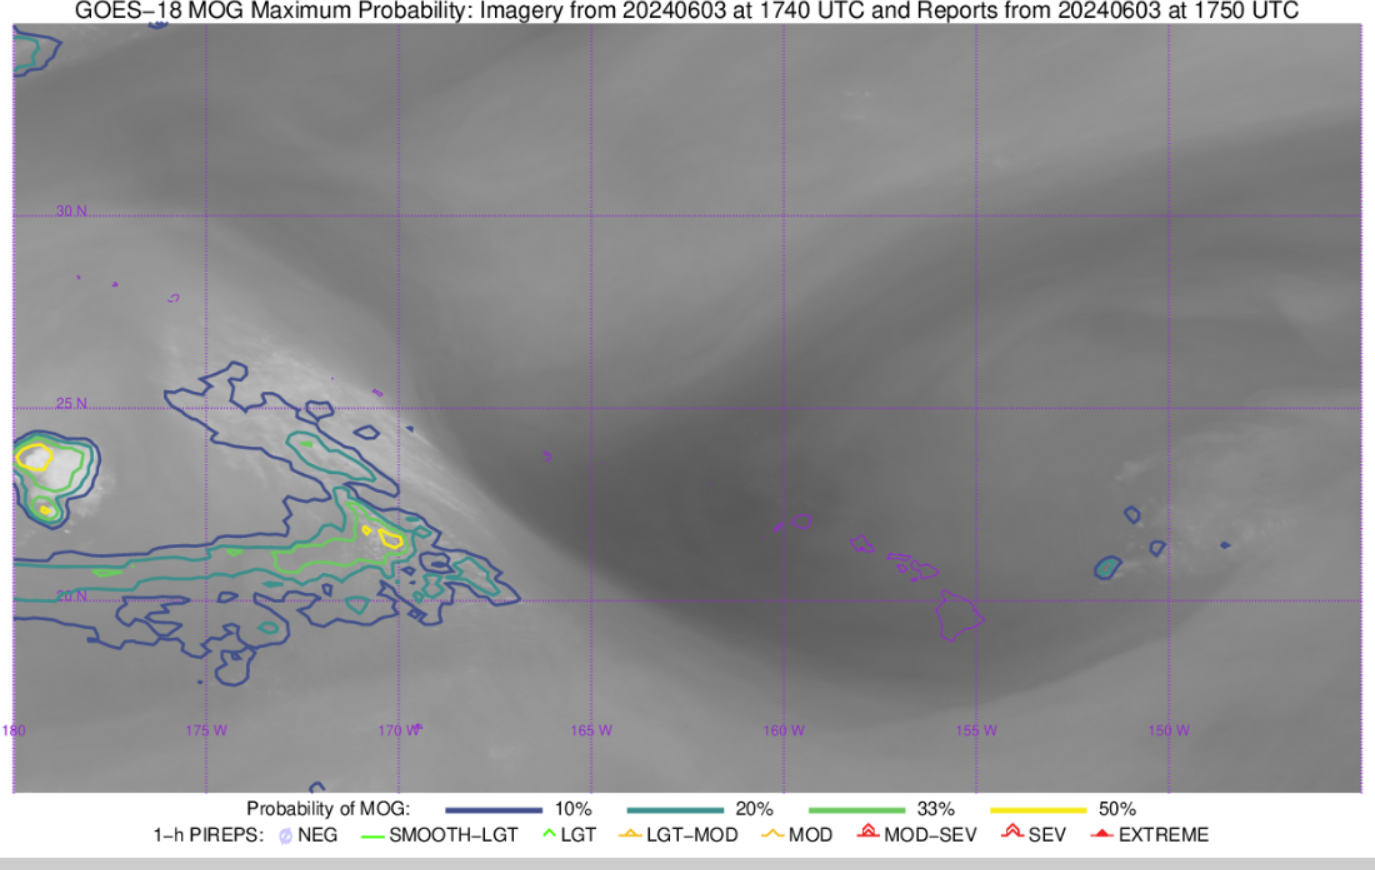
The convection is creating a signal in the CIMSS Turbulence product, shown below in imagery from this website. The animation below shows the contours of the probability of Moderate Or Greater (MOG) Turbulence to the northeast of Hawaii. The animation below also shows water vapor imagery as a greyscale, from which you can infer the upper-level low-pressure system over the Hawaiian Islands that is helping to force the thunderstorms.
CIMSS Turbulence Probability surrounding the Hawaiian Islands, 1630-1910 UTC on 3 June 2024 (click to enlarge)
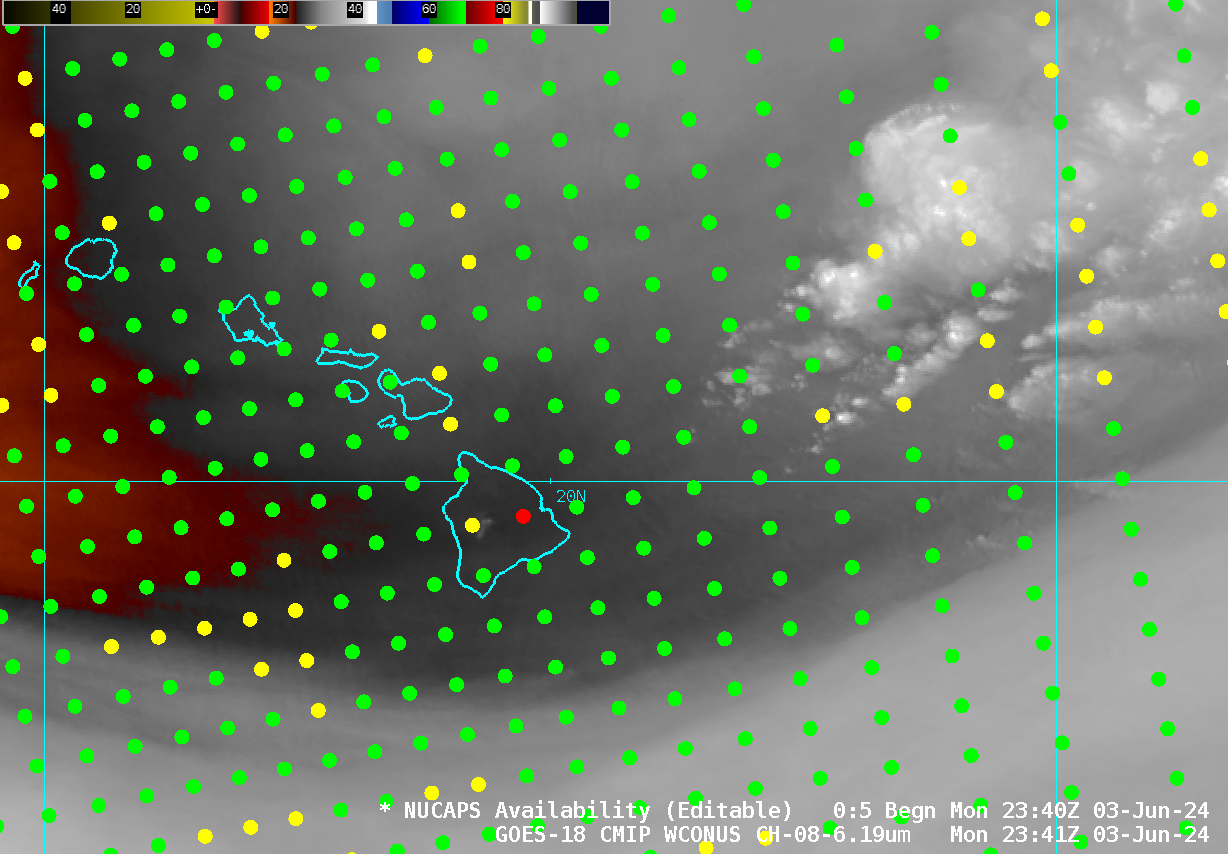
NOAA-20 overflew the region at around 1200 UTC on 3 June, and some NUCAPS soundings in the region are shown below. They uniformaly show a moist boundary layer capped by a stable layer. The mid-troposphere above that cap shows steep lapse rates and drying with height, that is, a convectively unstable atmosphere.
NOAA-20 NUCAPS Profiles, ca. 1140 UTC on 3 June 2024, location circled in Red; Background: GOES-18 6.19 µm (Upper Level Water Vapor, Blue/Yellow enhancement) (Click to enlarge)
High-based convection again developed between 0600 and 1200 UTC on 4 May 2024. The Hilo Sounding, below (source), showed a capped moist boundary layer with an unstable atmosphere above 700 mb.
Upper Air Sounding, Hilo Hawaii, 0000 UTC 4 June 2024 (Click to enlarge)
NOAA-21 overflew the islands just before 0000 UTC as shown below. The NUCAPS soundings along the north shore of the big island of Hawai’i, are shown below. The profile north of 20 N is from 234344 UTC, the one south of 20 N is from 234312 UTC. The structures of the smooth NUCAPS profiles are similar to those of the Hilo rawinsonde shown above.
GOES-18 Band 8 (Upper-level Water Vapor, 6.19 µm, Default AWIPS enhancement), 2341 UTC on 3 June 2024 along with NOAA-21 NUCAPS profiles (Click to enlarge)NUCAPS Profiles near 20 N along the north shore of the big island of Hawai’i, ca. 2343 UTC (Click to enlarge)
The animation below shows the LightningCast output (from this website) for the elevated convection between 0600 and 0800 UTC on 4 June 2024.
LightningCast probabilities and GLM Flash Extent Density and GOES-West ”PACUS’ domain clean windown infrared (Band 13, 10.3 µm,) imagery, 0600-0800 UTC on 4 June 2024 (Click to enlarge)
Thanks to Robert Ballard, Science and Operations Officer (SOO) at WFO Honolulu for alerting us to this event. He notes the similarity to an event back in the year 2000, mentioned in this AFD. High-based thunderstorms such as these are rare in the tropics. They are decoupled from the tradewind cumulus: the thunderstorms are moving northward as the lower clouds move towards the west.

![30-second GOES-16 Rocket Plume RGB images (courtesy Tim Schmit, NOAA/NESDIS) [click to play MP4 animation]](https://cimss.ssec.wisc.edu/satellite-blog/images/2024/06/Plume_GOES-16_ABI_RadM1_plume_2024157_145623Z.png)
