This website works best with a newer web browser such as Chrome, Firefox, Safari or Microsoft Edge. Internet Explorer is not supported by this website.

Bronco Fire in Arizona produces a pyrocumulonimbus cloud

5-minute PACUS sector GOES-18 (GOES-West) Clean Infrared Window (10.3 µm) images and Red Visible (0.64 µm) images with an overlay of the FDCA Fire Mask derived product (above) showed that the Bronco Fire in southeast Arizona produced a pyrocumulonimbus (pyroCb) cloud as it was experiencing very active to extreme fire behavior... Read More

5-minute GOES-18 Clean Infrared Window (10.3 µm, left) and Red Visible (0.64 µm right) images with overlays of the Fire Mask derived product (semi-transparent red areas), from 2001 UTC on 07 August to 0101 UTC on 08 August [click to play MP4 animation]

5-minute PACUS sector GOES-18 (GOES-West) Clean Infrared Window (10.3 µm) images and Red Visible (0.64 µm) images with an overlay of the FDCA Fire Mask derived product (above) showed that the Bronco Fire in southeast Arizona produced a pyrocumulonimbus (pyroCb) cloud as it was experiencing very active to extreme fire behavior on 07 August 2025. The pyroCb cloud exhibited cloud-top 10.3 µm infrared brightness temperatures (IRBTs) in the -40s C (denoted by shades of blue to cyan) — a necessary condition to be classified as a pyroCb — beginning at 2156 UTC on 07 August.

Note that smoke drifting north-northeastward from the Bronco Fire eventually reduced the surface visibility to 4 miles at Show Low (METAR identifier KSOW) by 0100 UTC on 08 August (below).

Time series of surface observation data at Show Low, Arizona [click to enlarge]

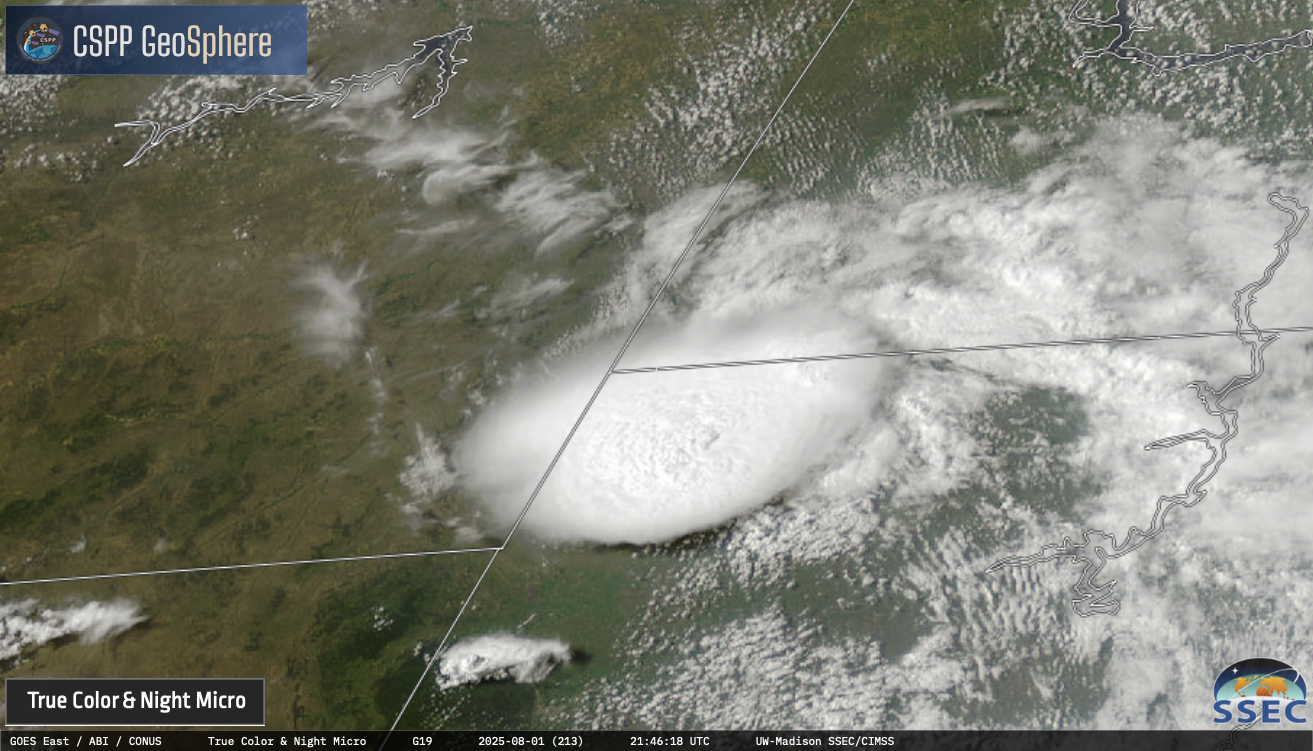
The hazy signature of northward-drifting smoke was apparent in GOES-18 True Color RGB images from the CSPP GeoSphere site (below).

5-minute GOES-18 True Color RGB images, from 2001 UTC on 07 August to 0101 UTC on 08 August [click to play MP4 animation]

____________

GOES-18 Infrared image at 0016 UTC on 08 August, with a cursor sample of the coldest pyroCb cloud-top infrared brightness temperature [click to enlarge]

The coldest pyroCb cloud-top IRBT was -51.59ºC at 0016 UTC on 08 August (above). On a plot of rawinsonde data from Tucson, Arizona (below) the air temperature of -51.59ºC occurred at an altitude around 11.3 km — not far below the Most Unstable (MU) air parcel’s Maximum Parcel Level (MPL) of 11.6 km.

Plot of rawinsonde data from Tucson, Arizona at 0000 UTC on 08 August [click to enlarge]

The Bronco Fire burned very hot, intermittently exhibiting 3.9 µm infrared brightness temperatures as high as 137.88ºC — which is the saturation temperature of the GOES-18 ABI Band 7 detectors — from 2111 UTC on 07 August to 0016 UTC on 08 August (below).

GOES-18 Shortwave Infrared (3.9 µm) image at 2111 UTC on 07 August, with a cursor sample of the hottest brightness temperature over the Bronco Fire [click to enlarge]

GOES-18 Shortwave Infrared (3.9 µm) image at 0016 UTC on 08 August, with a cursor sample of the hottest brightness temperature over the Bronco Fire [click to enlarge]

View only this post Read Less

Severe thunderstorms produce large hail and hurricane-force wind gusts across eastern South Dakota

1-minute Mesoscale Domain Sector GOES-19 (GOES-East) Clean Infrared Window (10.3 µm) images (above) showed a cluster of thunderstorms that eventually congealed into a large Mesoscale Convective System, producing a tornado, hail as large as 2.75″ in diameter and wind gusts as high as 99 mph (SPC Storm Reports) across parts of eastern... Read More

1-minute GOES-19 Clean Infrared Window (10.3 µm) images, with time-matched (+/- 3 minutes) SPC Storm Reports plotted in white, from 2330 UTC on 05 August to 0507 UTC on 06 August [click to play animated GIF | MP4]

1-minute Mesoscale Domain Sector GOES-19 (GOES-East) Clean Infrared Window (10.3 µm) images (above) showed a cluster of thunderstorms that eventually congealed into a large Mesoscale Convective System, producing a tornado, hail as large as 2.75″ in diameter and wind gusts as high as 99 mph (SPC Storm Reports) across parts of eastern South Dakota on 05 August 2025. Frequent pulses of overshooting tops were apparent with these thunderstorms.

View only this post Read Less

First recorded eruption of Krasheninnikov on the Kamchatka Peninsula of Russia

A radiometrically retrieved Himawari-9 Ash Height product from the NOAA/CIMSS Volcanic Cloud Monitoring site (above) showed the volcanic cloud produced by the first recorded eruption of Krasheninnikov on the Kamchatka Peninsula of Russia, which began around 1650 UTC on 02 August 2025 (KVERT advisory). The Ash Height reached the 7-8 km range (darker shade... Read More

Himawari-9 Ash Height derived product [click to play MP4 animation]

A radiometrically retrieved Himawari-9 Ash Height product from the NOAA/CIMSS Volcanic Cloud Monitoring site (above) showed the volcanic cloud produced by the first recorded eruption of Krasheninnikov on the Kamchatka Peninsula of Russia, which began around 1650 UTC on 02 August 2025 (KVERT advisory). The Ash Height reached the 7-8 km range (darker shade of green) at times.

A Himawari-9 Ash Loading product (below) indicated that portions of the volcanic cloud occasionally contained fairly high levels of ash loading (shades of red).

Himawari-9 Ash Loading derived product [click to play MP4 animation]

Himawari-9 Ash RGB images produced using Geo2Grid (below) suggested that the volcanic cloud was composed of both primarily ash (shades of red/pink) and a mixture of ash and SO2 (shades of yellow).

Himawari-9 Ash RGB images [click to play animated GIF | MP4]

View only this post Read Less

Mesoscale Convective Vortex helps to force the development of a Mesoscale Convective System over northwest South Dakota

5-minute CONUS Sector GOES-19 (GOES-East) Nighttime Microphysics RGB + daytime True Color images from the CSPP GeoSphere site (above) showed a remnant Mesoscale Convective Vortex (MCV) that migrated eastward from southeastern Montana to northwestern South Dakota — where it helped to force the rapid development of a slow-moving Mesoscale Convective System (MCS) during the afternoon... Read More

5-minute GOES-19 Nighttime Microphysics RGB + daytime True Color RGB images, from 1201 UTC on 01 August to 0051 UTC on 02 August [click to play MP4 animation]

5-minute CONUS Sector GOES-19 (GOES-East) Nighttime Microphysics RGB + daytime True Color images from the CSPP GeoSphere site (above) showed a remnant Mesoscale Convective Vortex (MCV) that migrated eastward from southeastern Montana to northwestern South Dakota — where it helped to force the rapid development of a slow-moving Mesoscale Convective System (MCS) during the afternoon hours on 01 August 2025.

1-minute GOES-19 Red Visible (0.64 µm) images with time-matched (+/- 3 minutes) SPC Storm Reports plotted in red, from 2045 UTC on 01 August to 0127 UTC on 02 August [click to play animated GIF]

The MCS eventually began to produce periodic hail and damaging winds after 2100 UTC, as shown by 1-minute Mesoscale Domain Sector GOES-19 Visible images (above) and Infrared images (below) that included time-matched plots of SPC Storm Reports. The visible imagery revealed numerous pulses of overshooting tops, as well as intricate patterns of cloud-top gravity waves.

1-minute GOES-19 Clean Infrared Window (10.3 µm) images with time-matched (+/- 3 minutes) SPC Storm Reports plotted in blue, from 2045 UTC on 01 August to 0127 UTC on 02 August [click to play animated GIF]

View only this post Read Less