Blowing dust prompts the issuance of the first Dust Storm Warning on record for the Chicago metro area

1-minute daytime GOES-19 True Color RGB images + nighttime Dust RGB images, from 2130 UTC on 16 May to 0200 UTC on 17 May [click to play animated GIF | MP4]
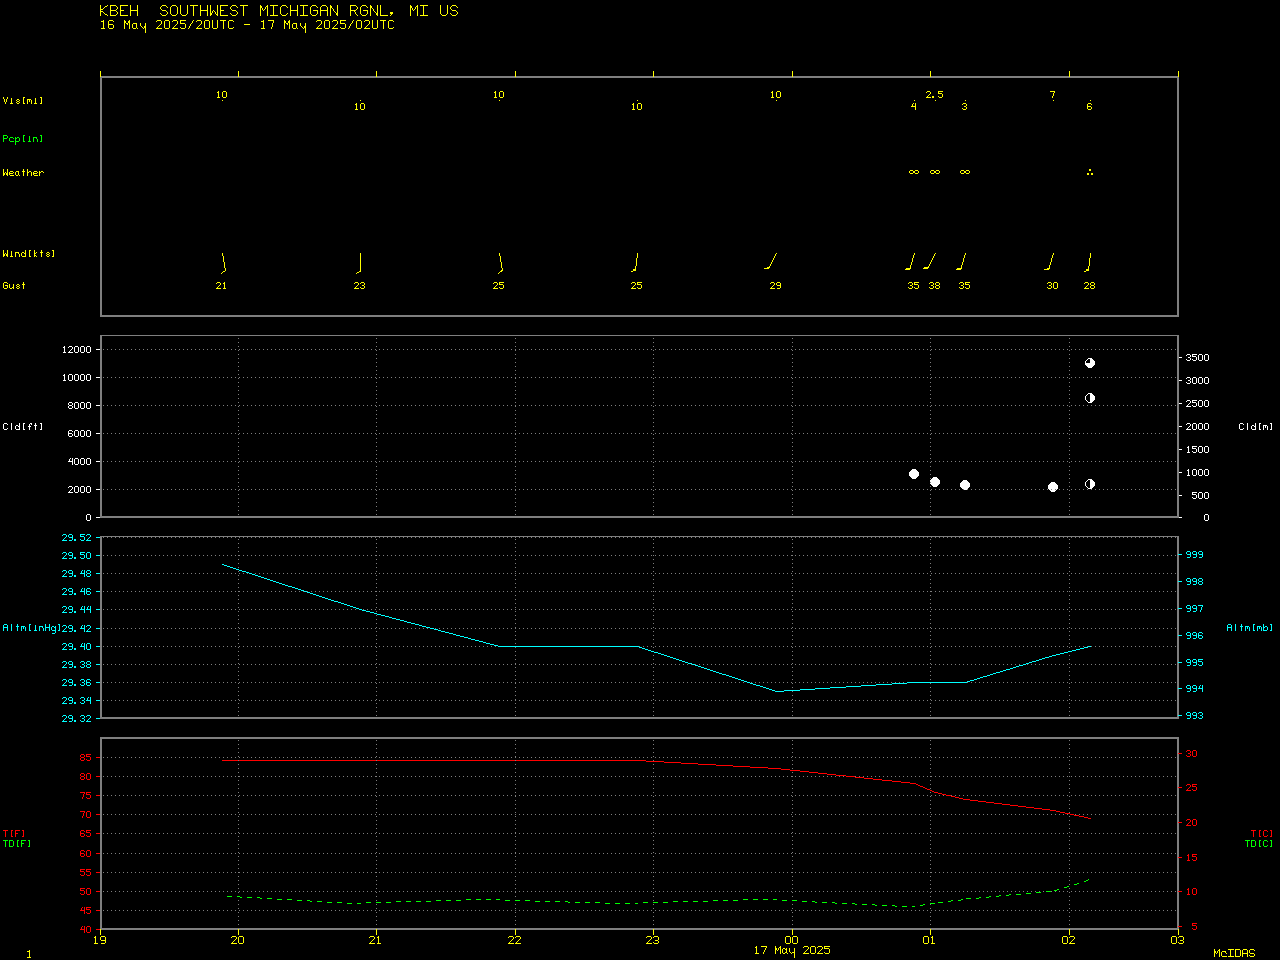
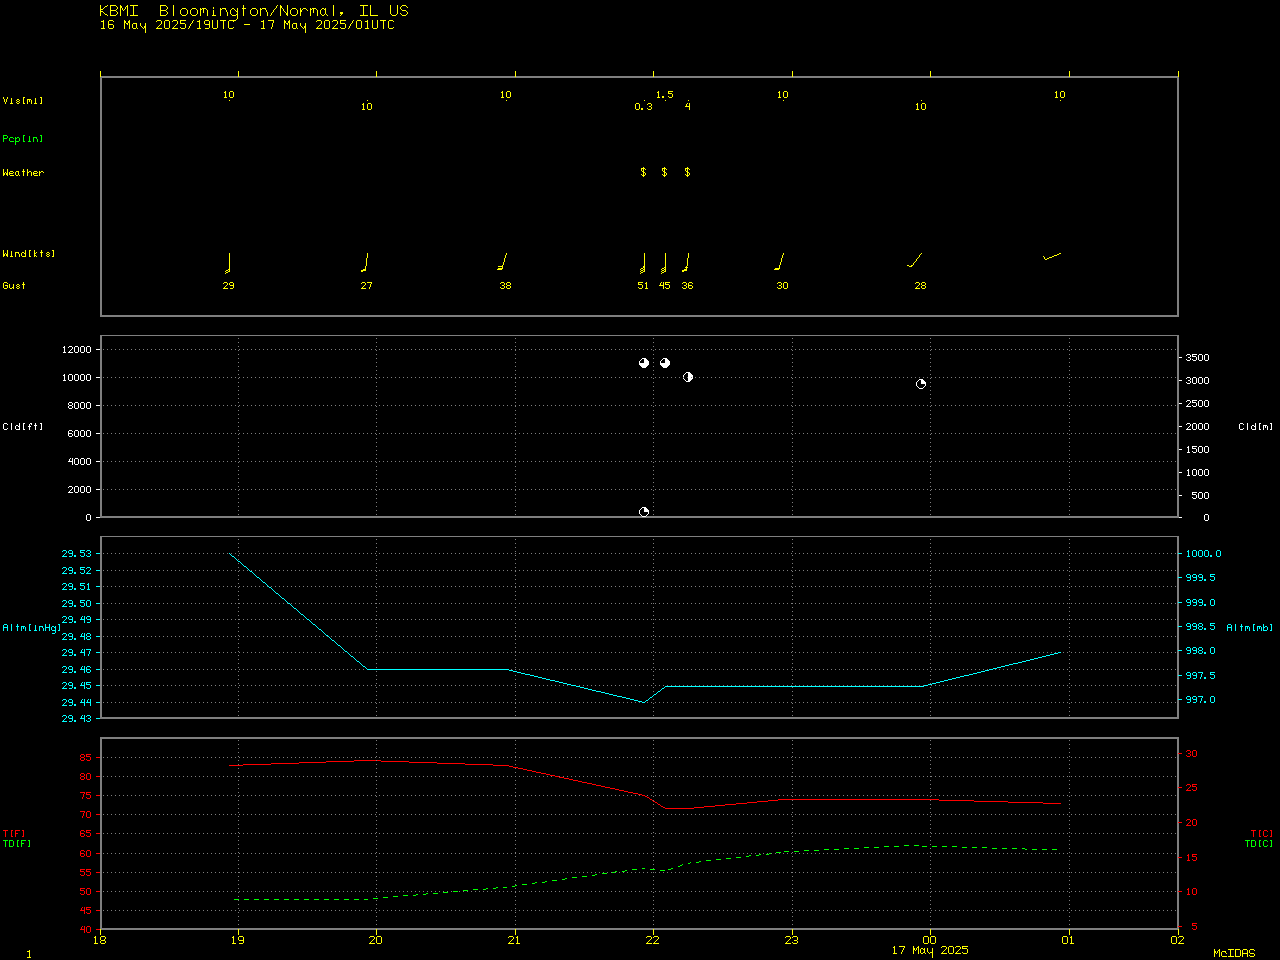
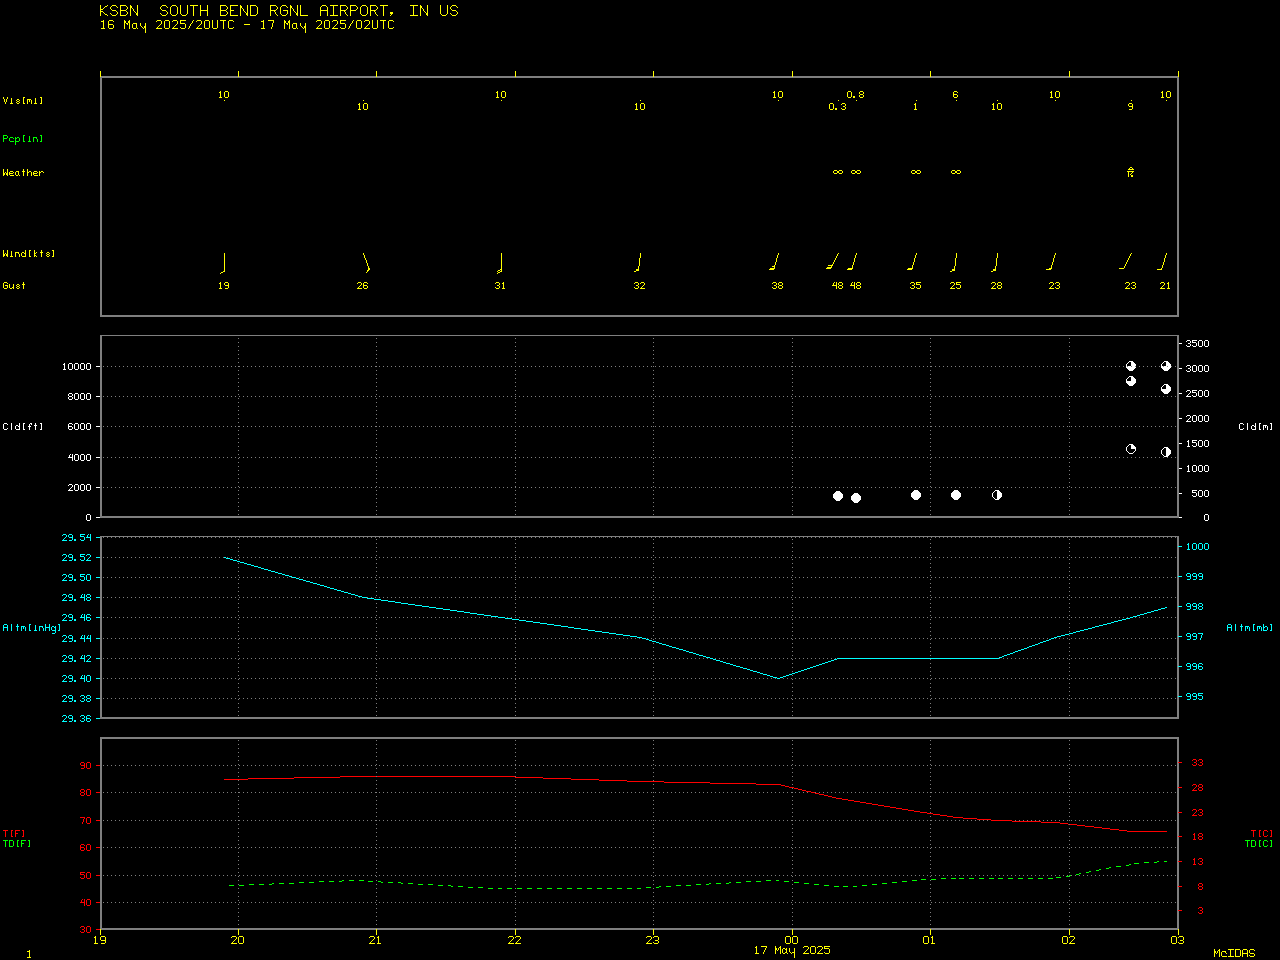
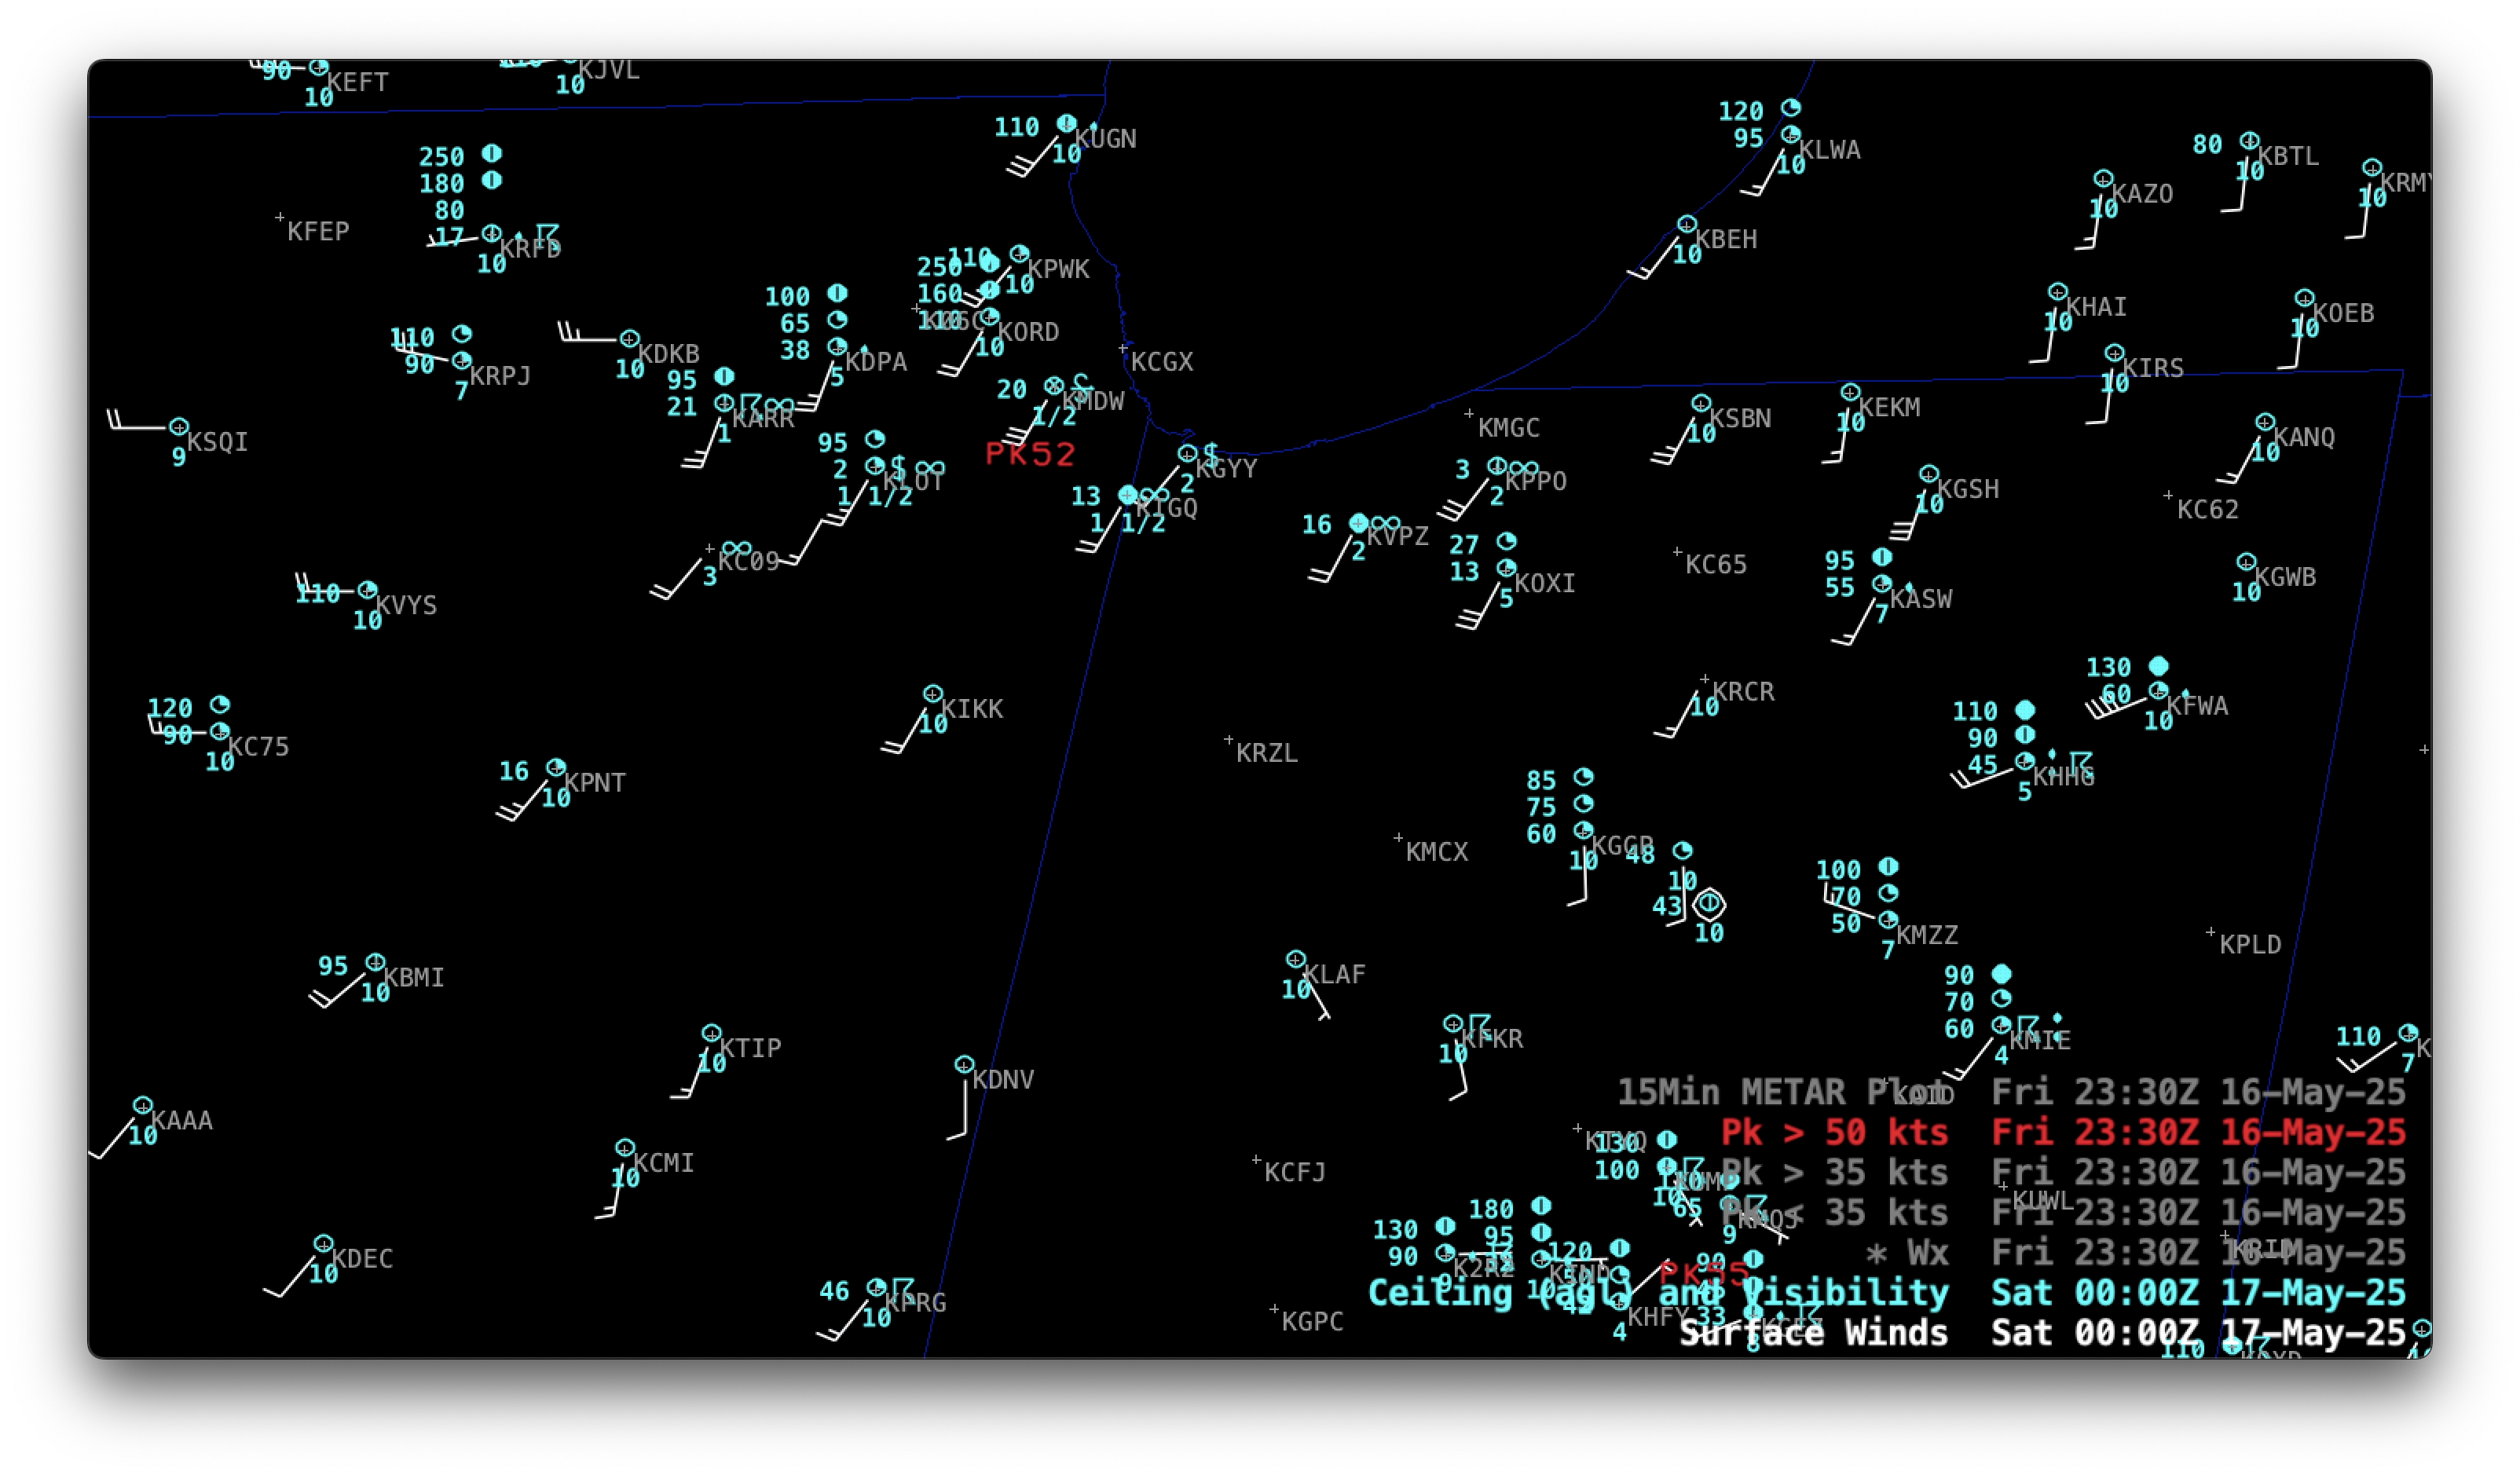
Plots of Wind Barbs and Peak Wind Gusts greater than 50 kts along with Ceiling/Visibility (below) showed the northward progression of strongest winds — which began around 2100-2200 UTC with thunderstorm outflow peak gusts of 60 kts at Champaign (KCMI) at 2104 UTC, 53 kts at Decatur (KDEC) at 2055 UTC and 51 kts at Bloomington/Normal (KBMI) at 2153 UTC — and lower visibility (1/4 mi at KBMI from 2153-2200 UTC, and later dropping to 1/4 mi at Chicago/Midway KMDW from 2340-2345 UTC and then 1/4 mi at South Bend, Indiana KSBN at 0020 UTC).
Hourly plots of Surface Wind Barbs (white) and Ceiling/Visibility (cyan), along with 30-minute Peak Wind Gusts greater than 50 kts (red) [click to play MP4 animation]
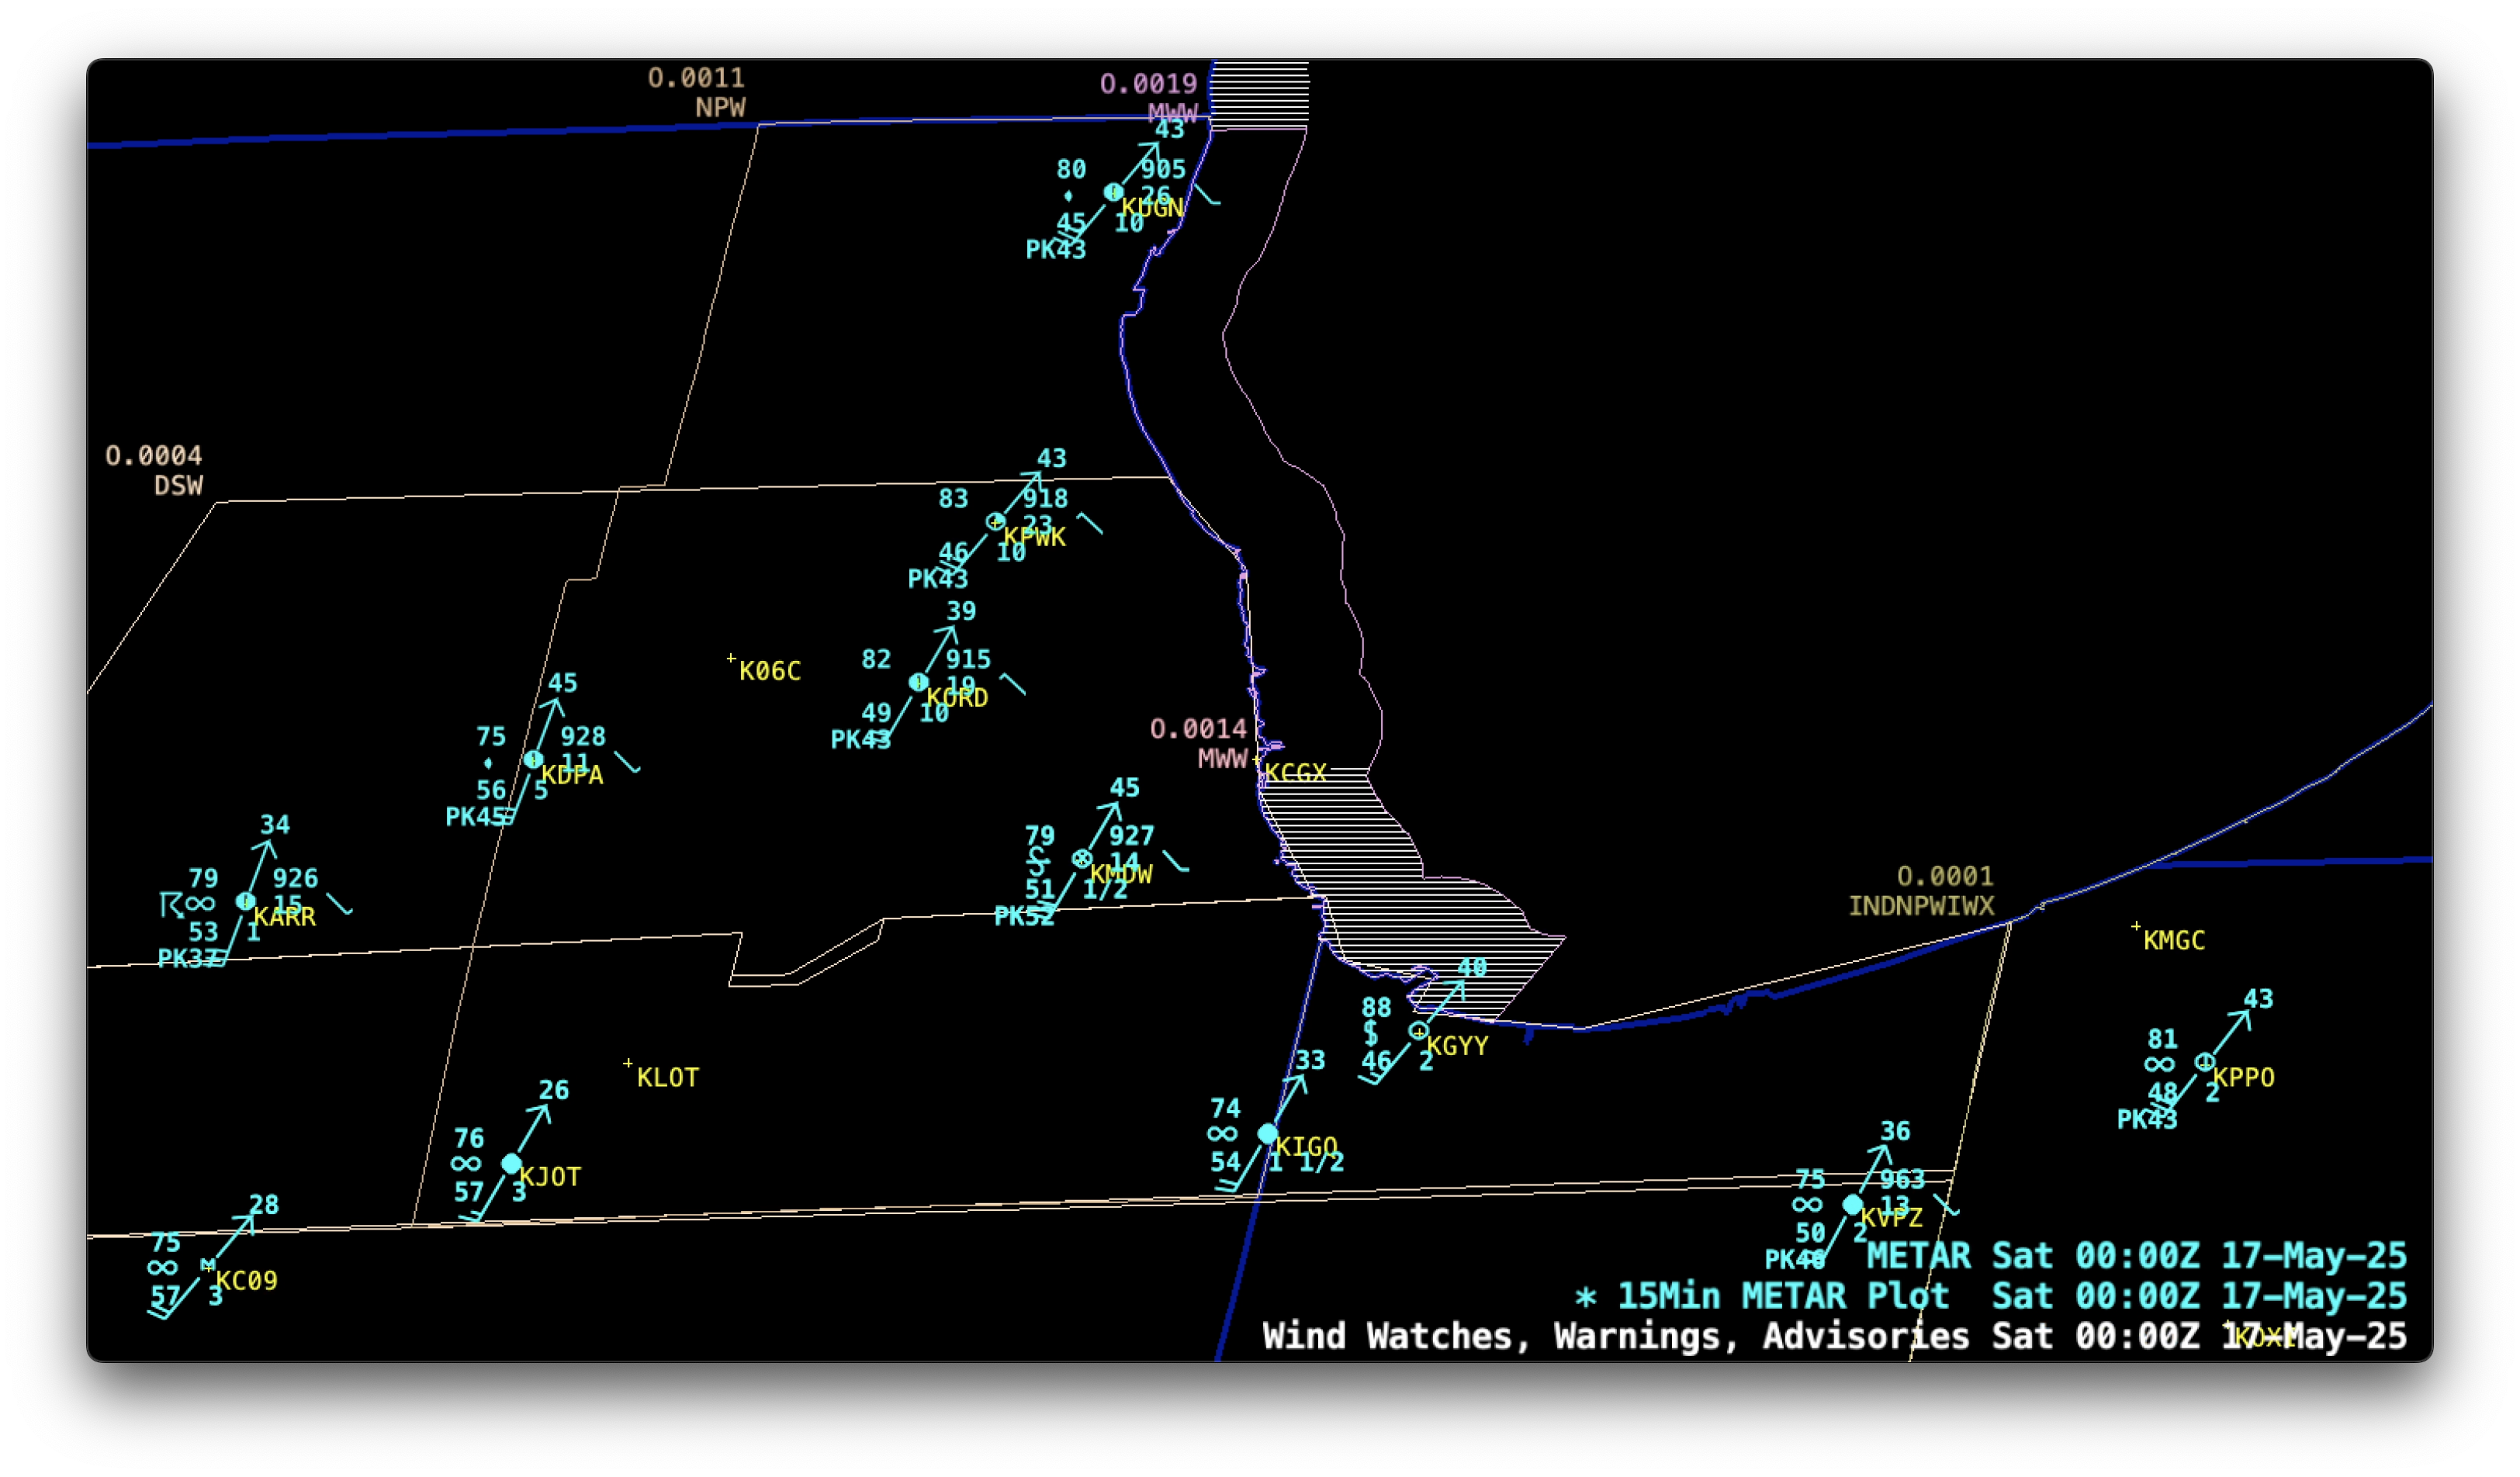
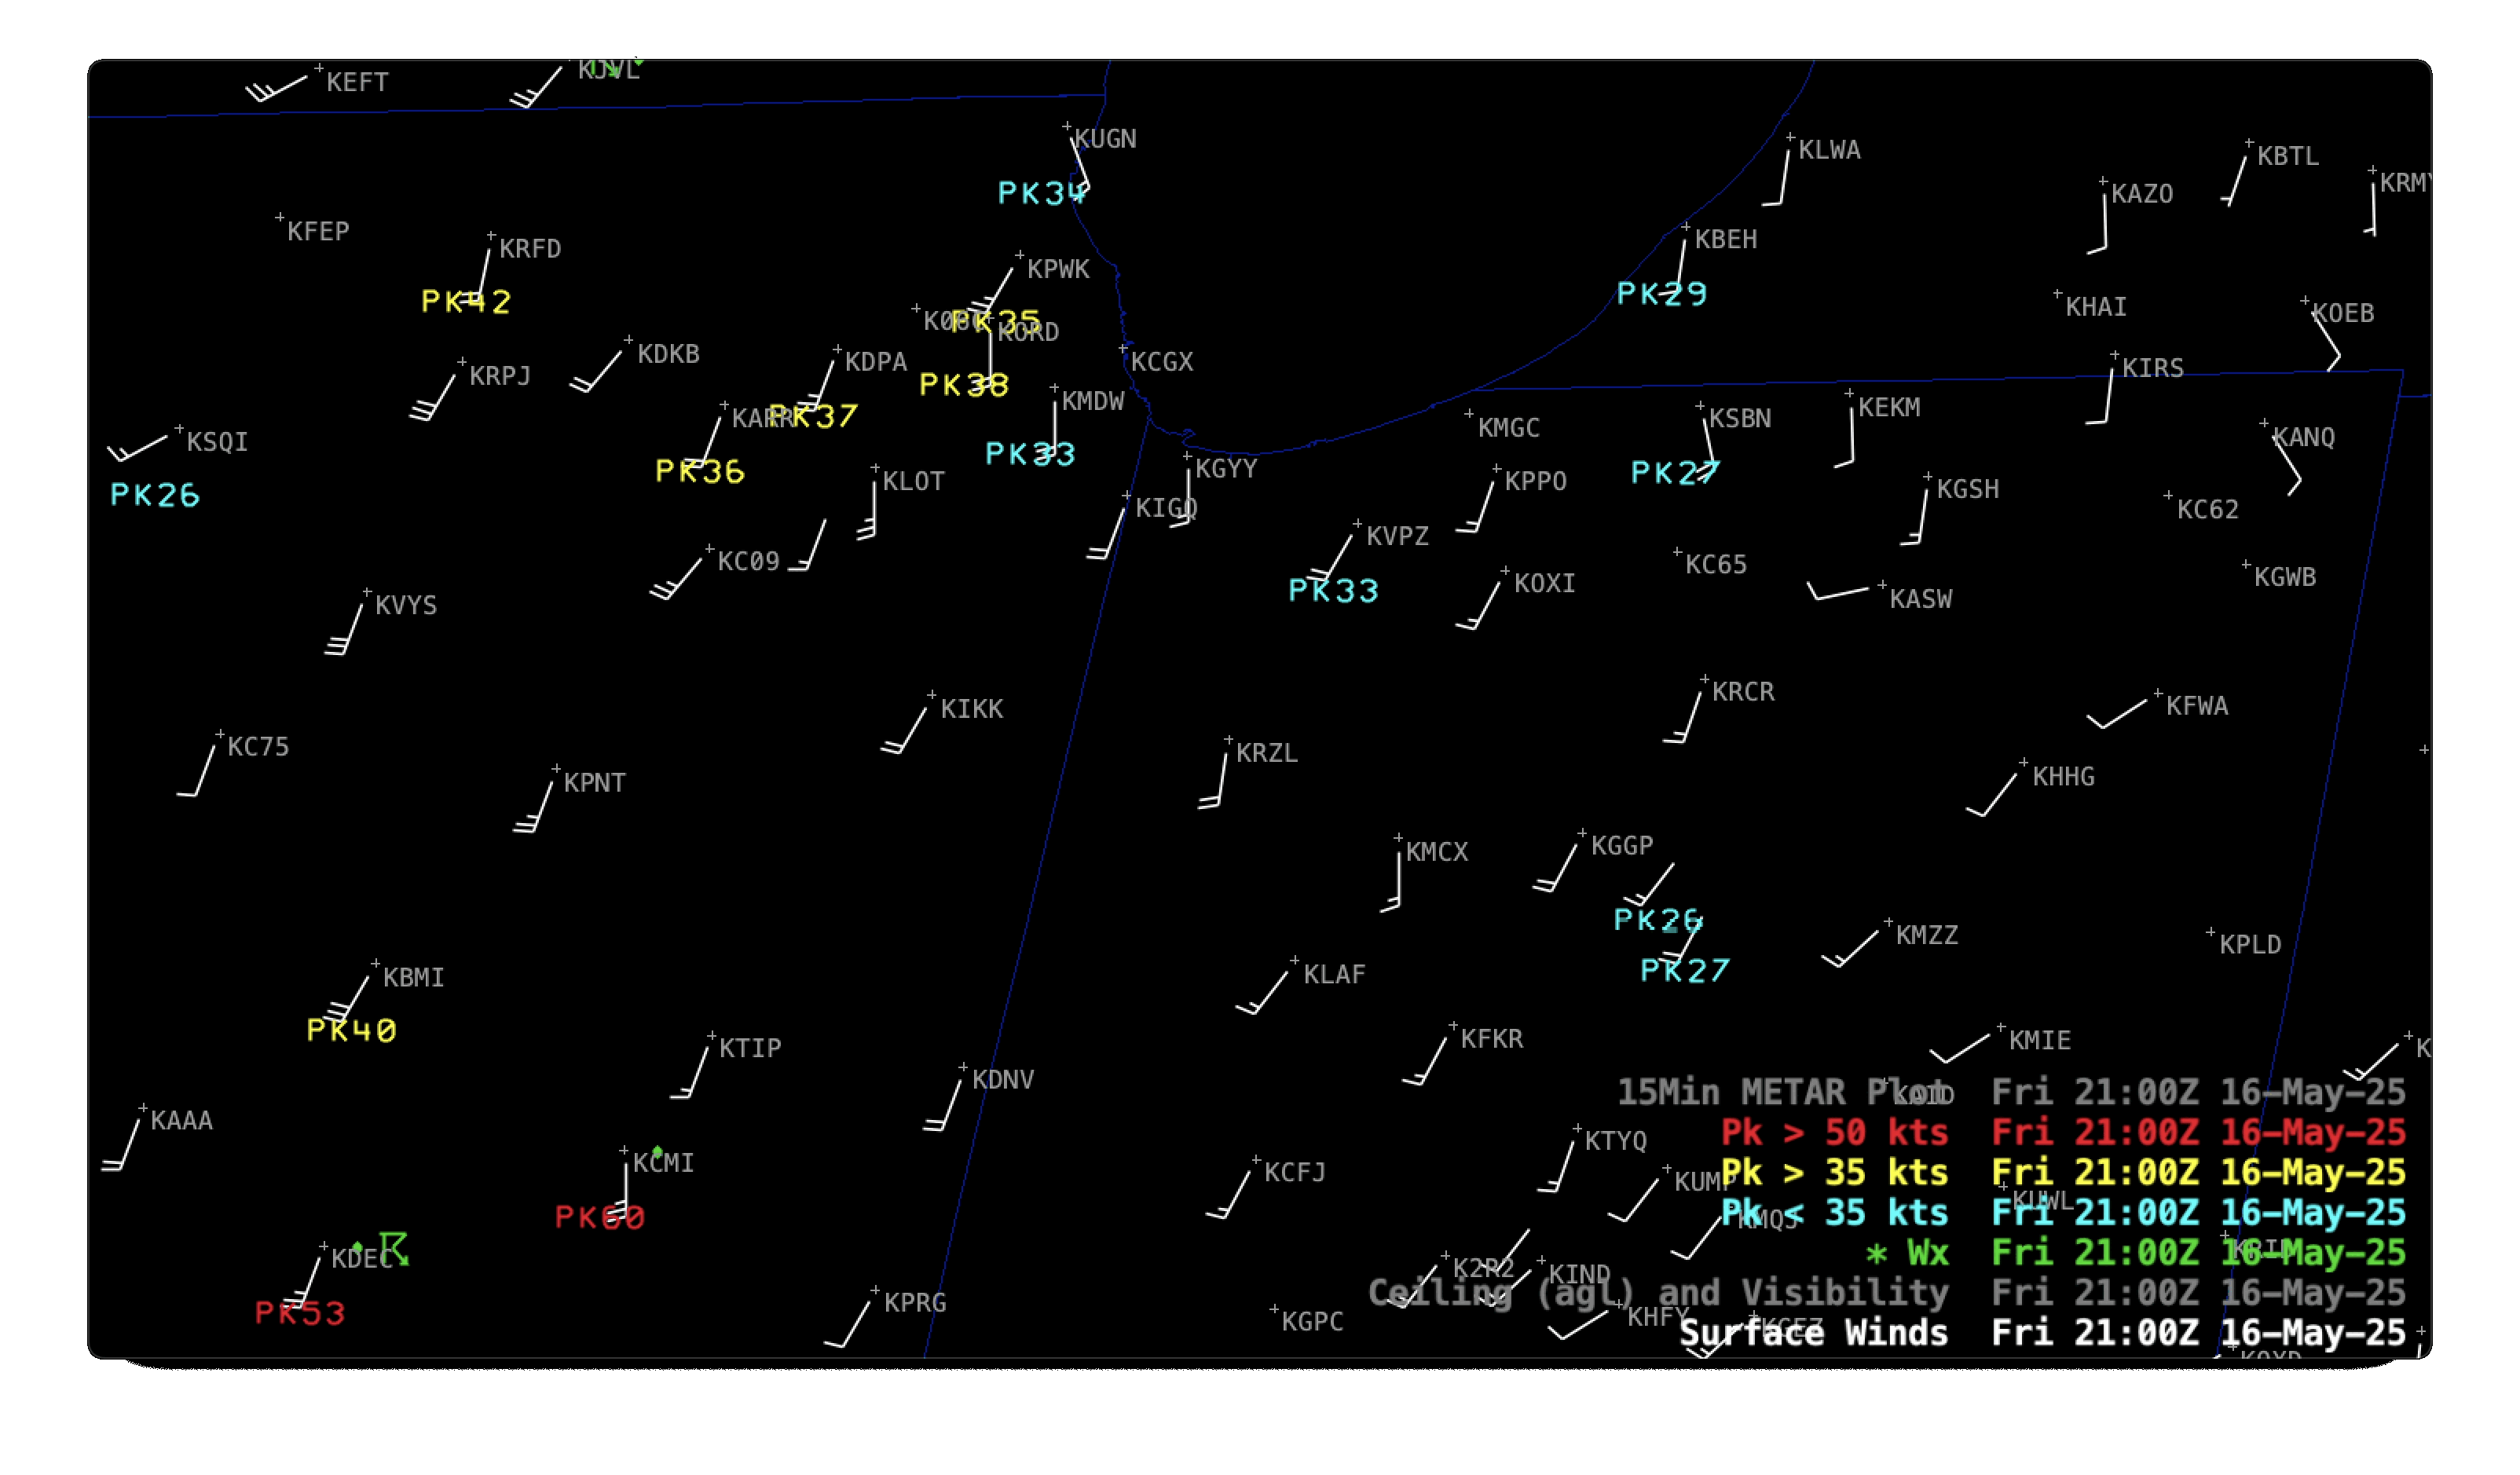
Plots of 15-minute METAR Surface Reports, along with Dust Storm Warning polygons (light beige) and nearshore Gale Warning polygons (magenta) across the greater Chicago area [click to play MP4 animation]
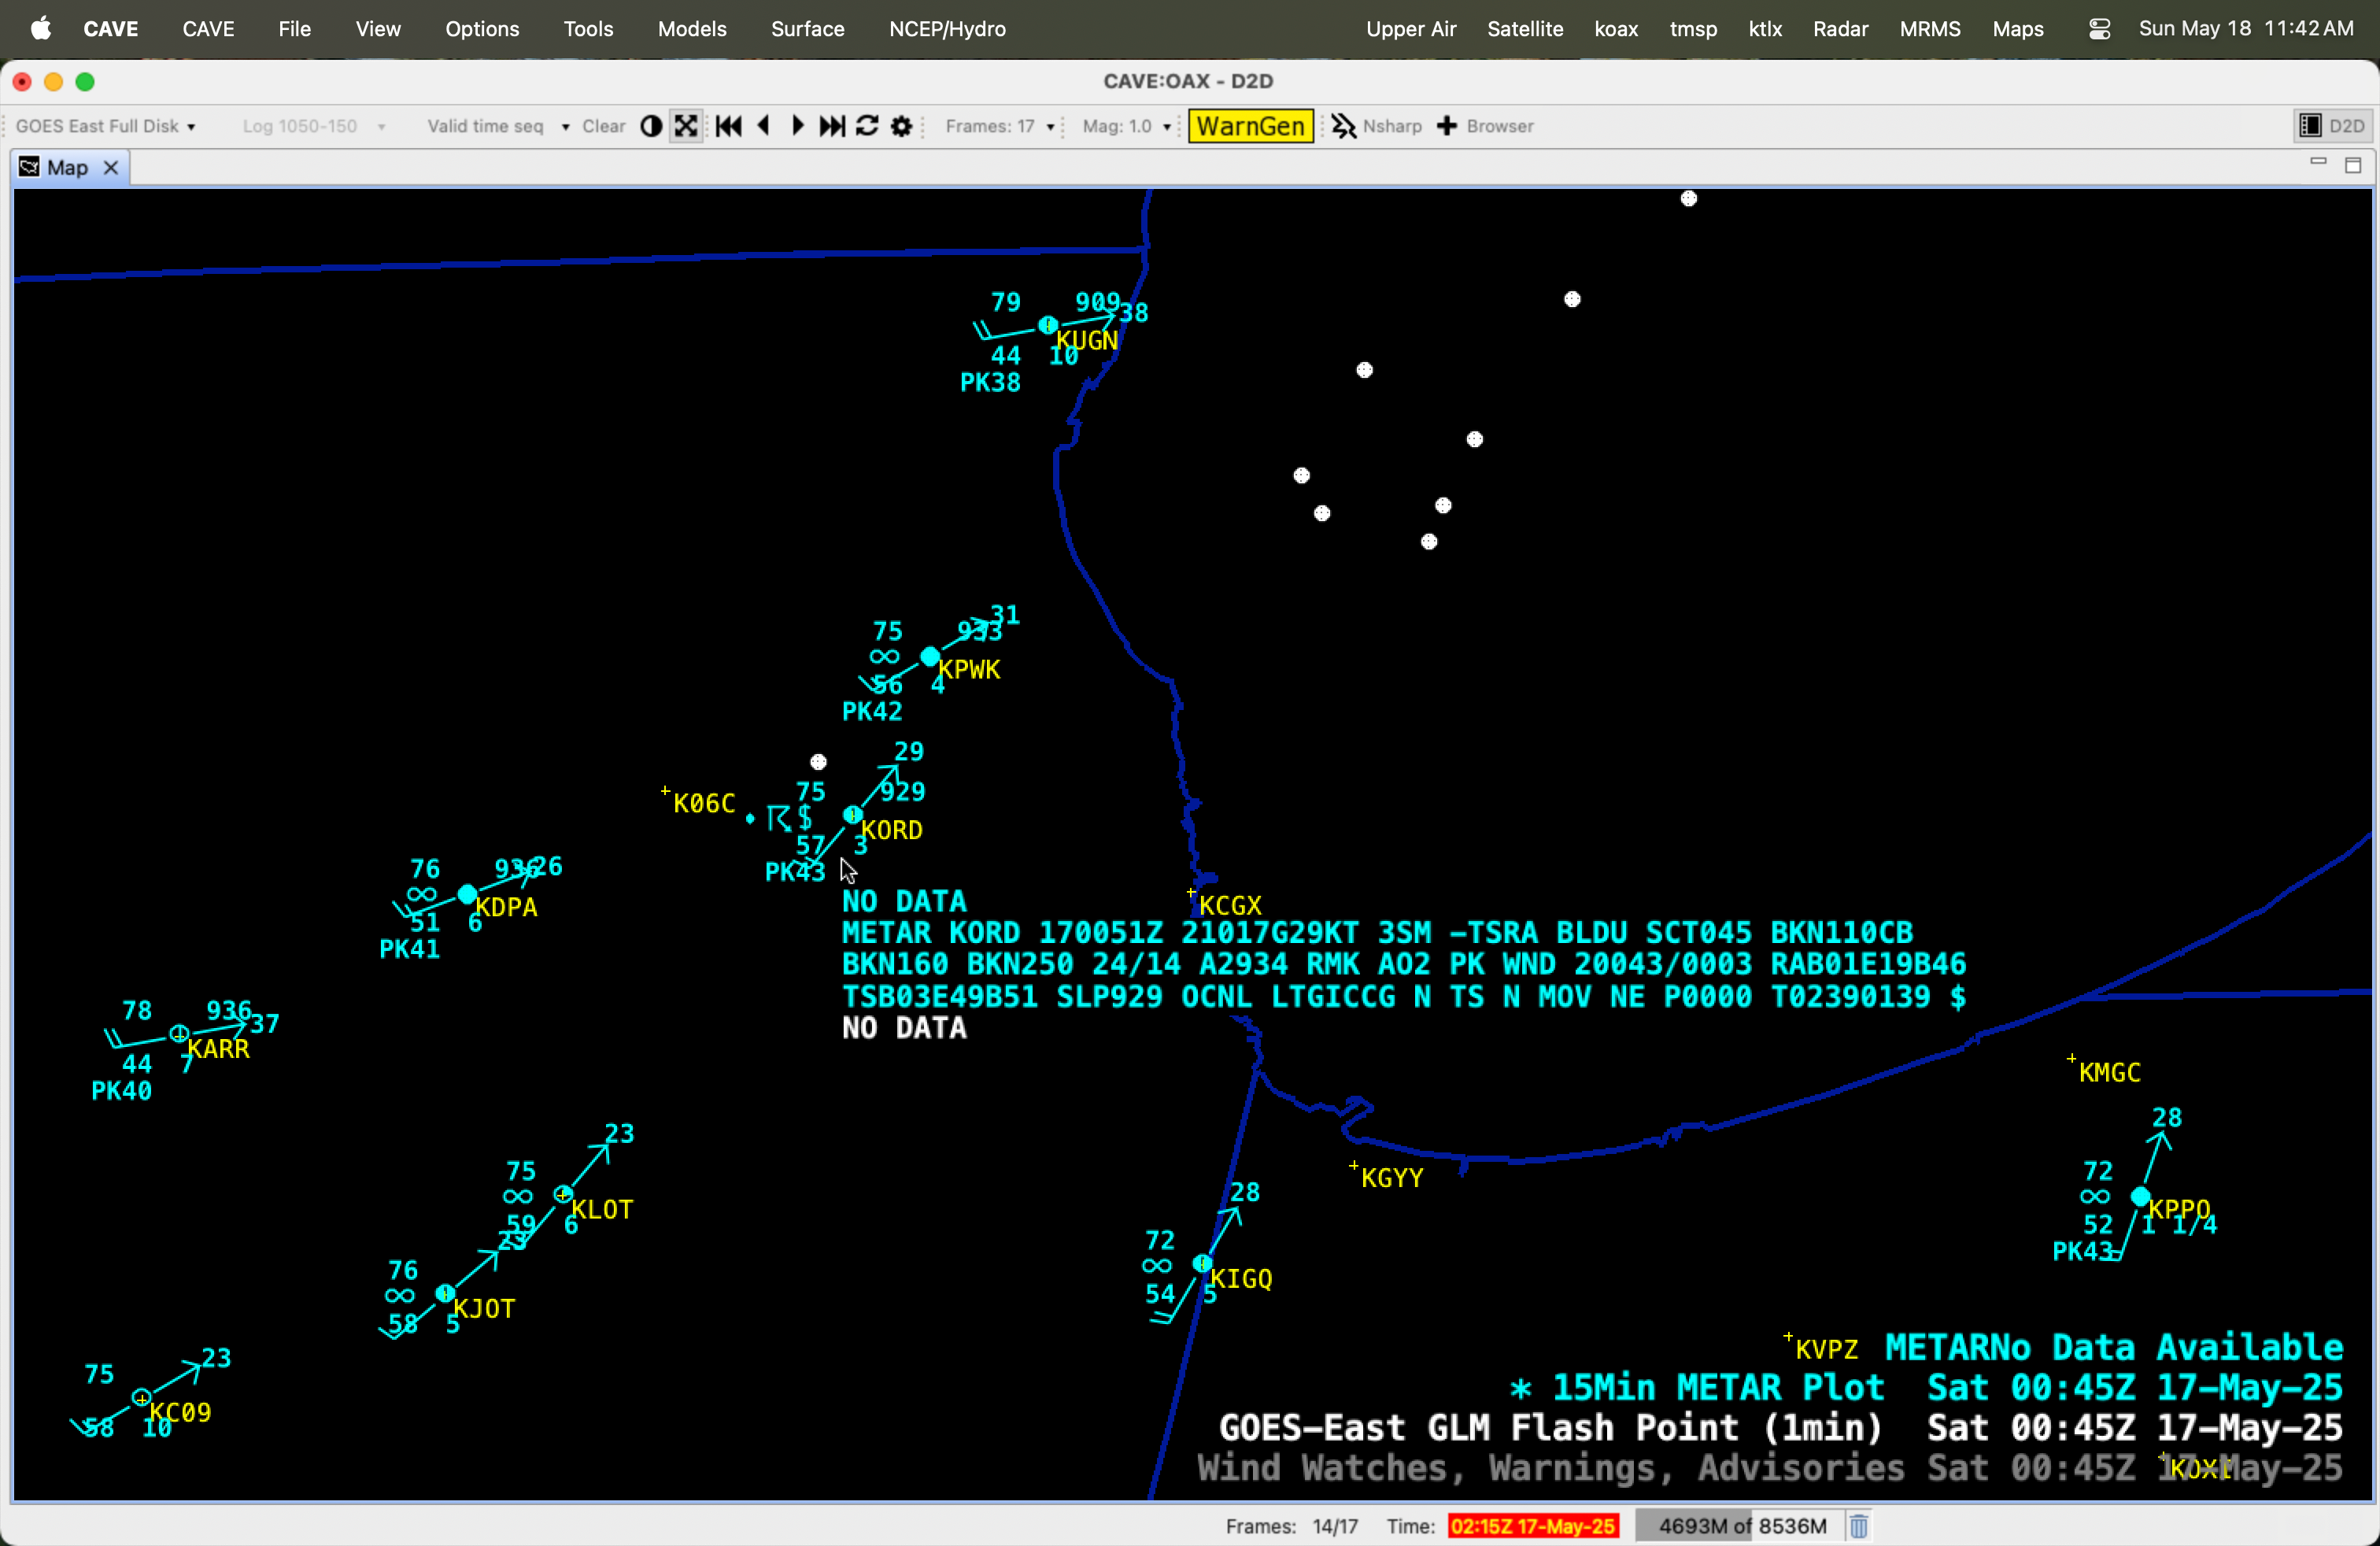
Cursor sample of the Chicago O’Hare (KORD) METAR Surface Report (cyan) at 0051 UTC, along with GLM Flash Points (white) at 0045 UTC on 17 May [click to enlarge]
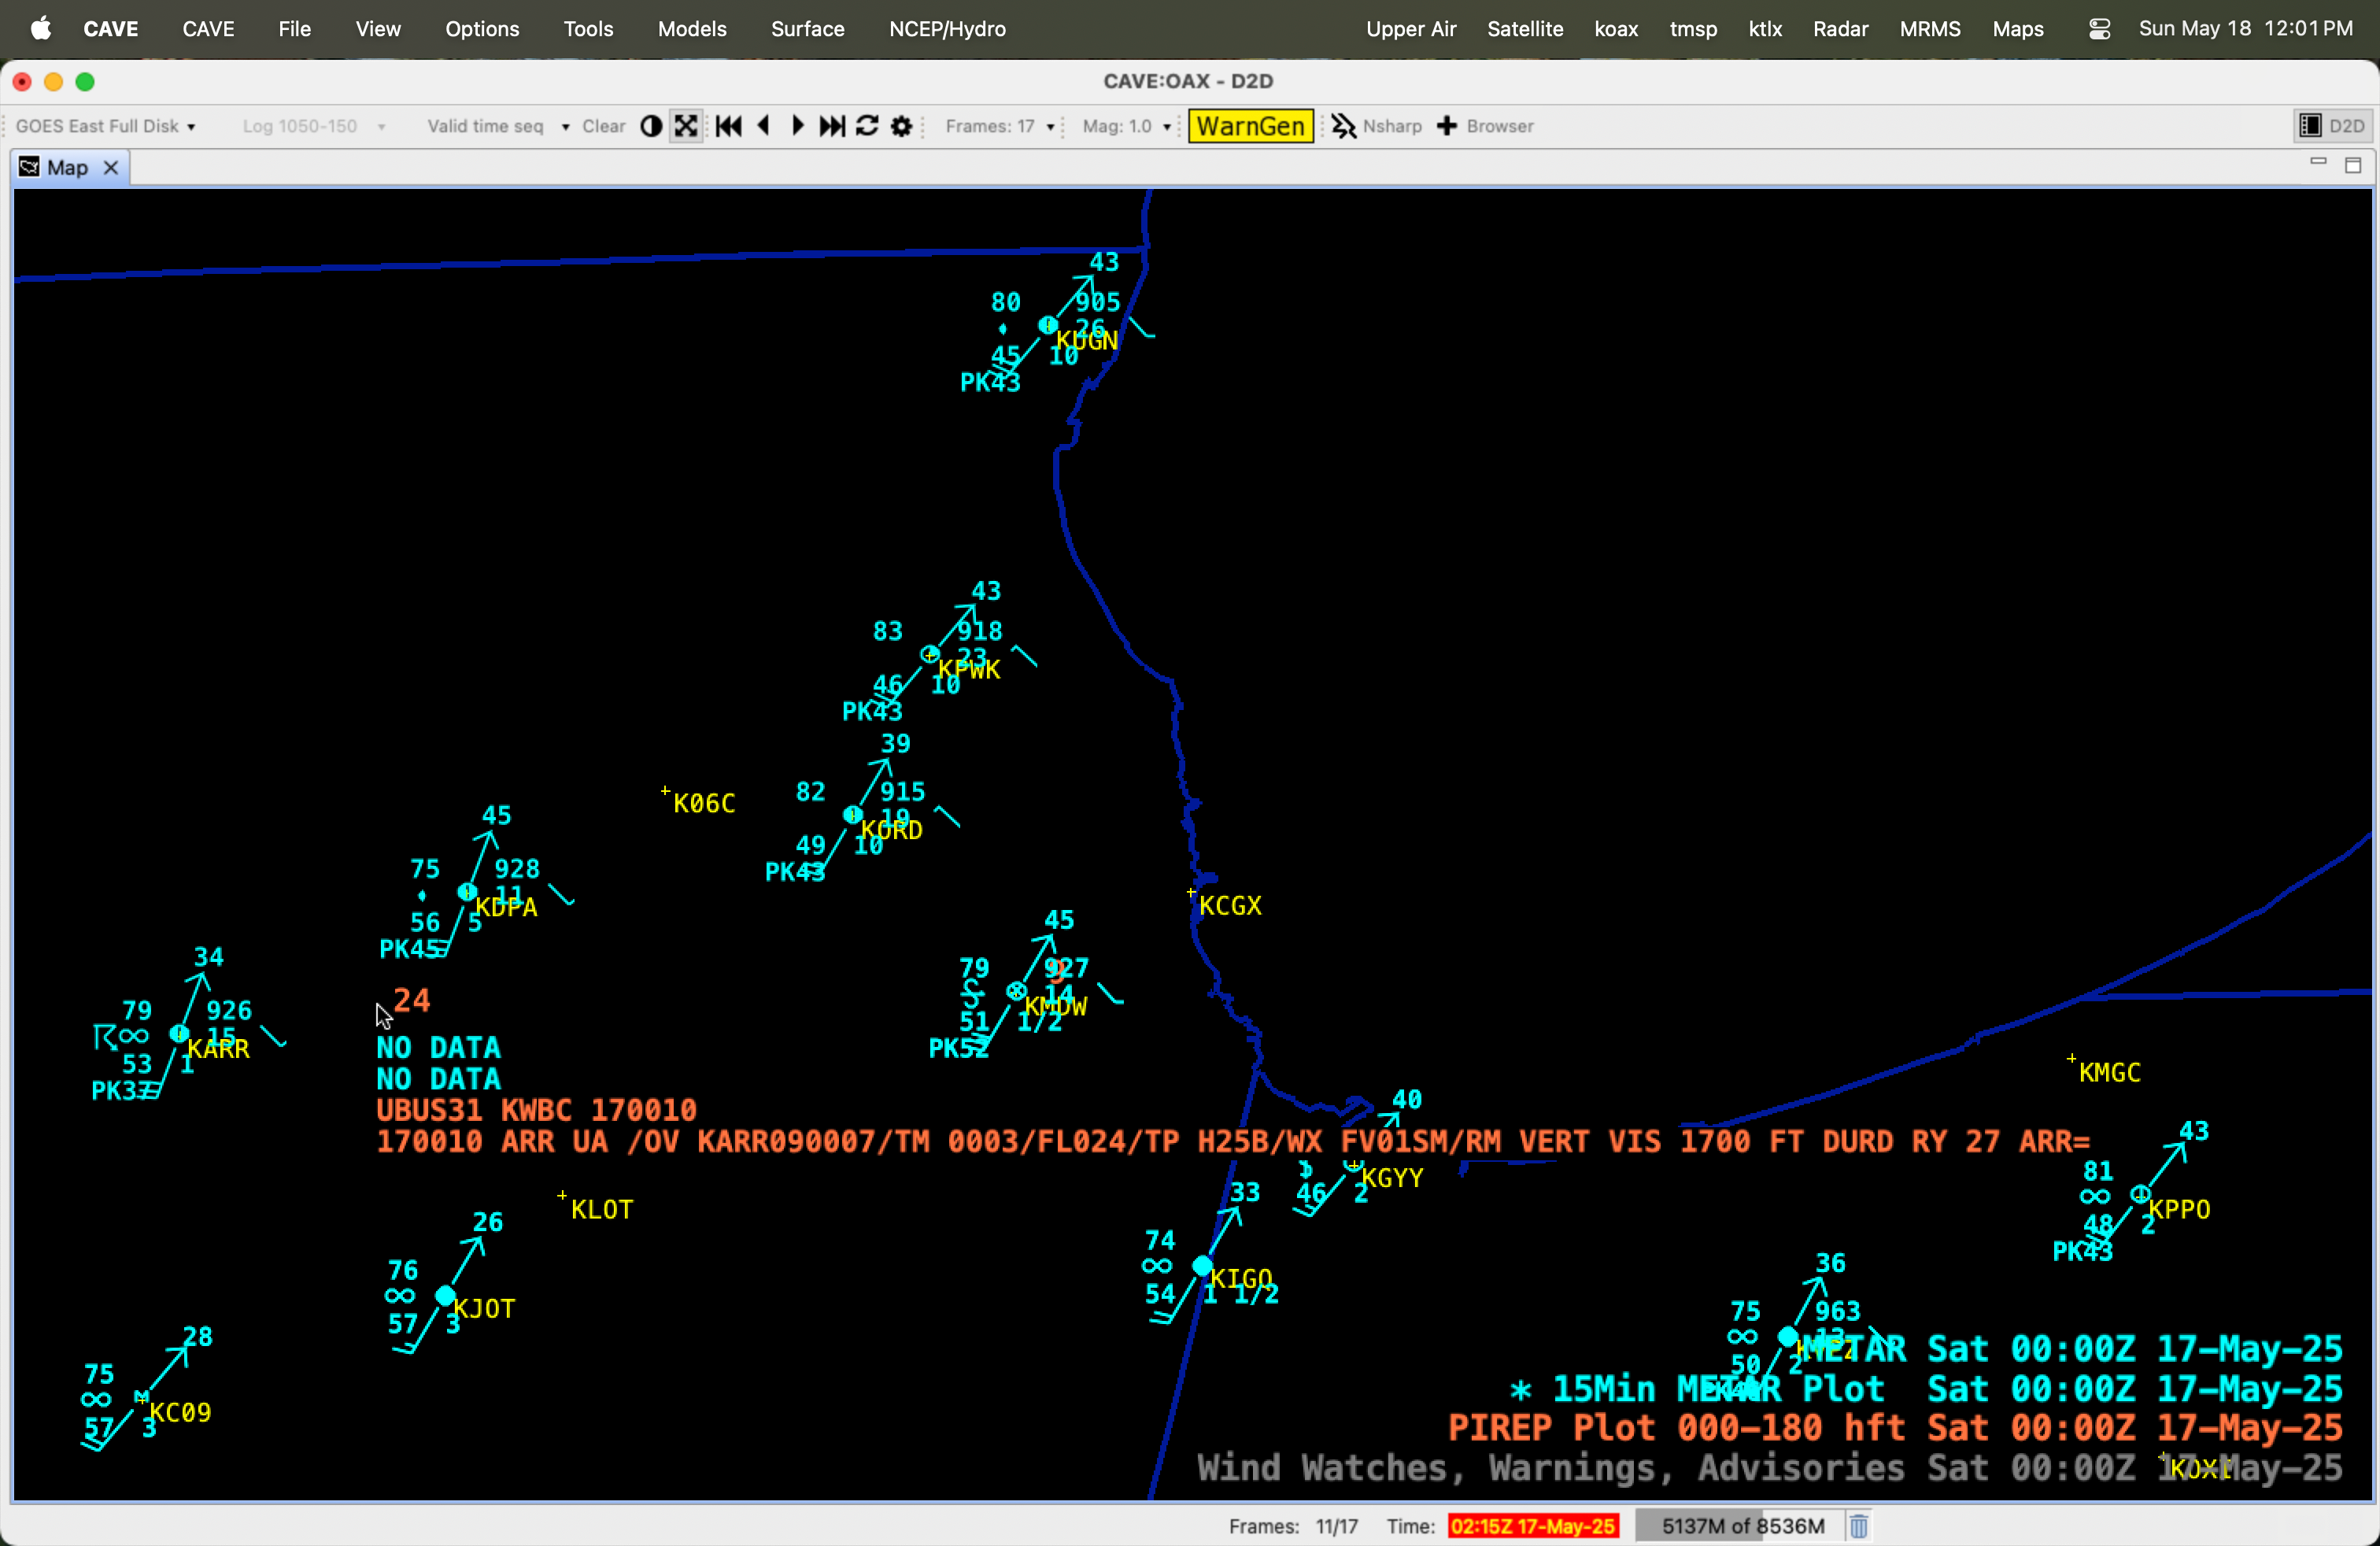
Cursor sample of a Pilot Report (orange) over Illinois at 0003 UTC on 17 May [click to enlarge]
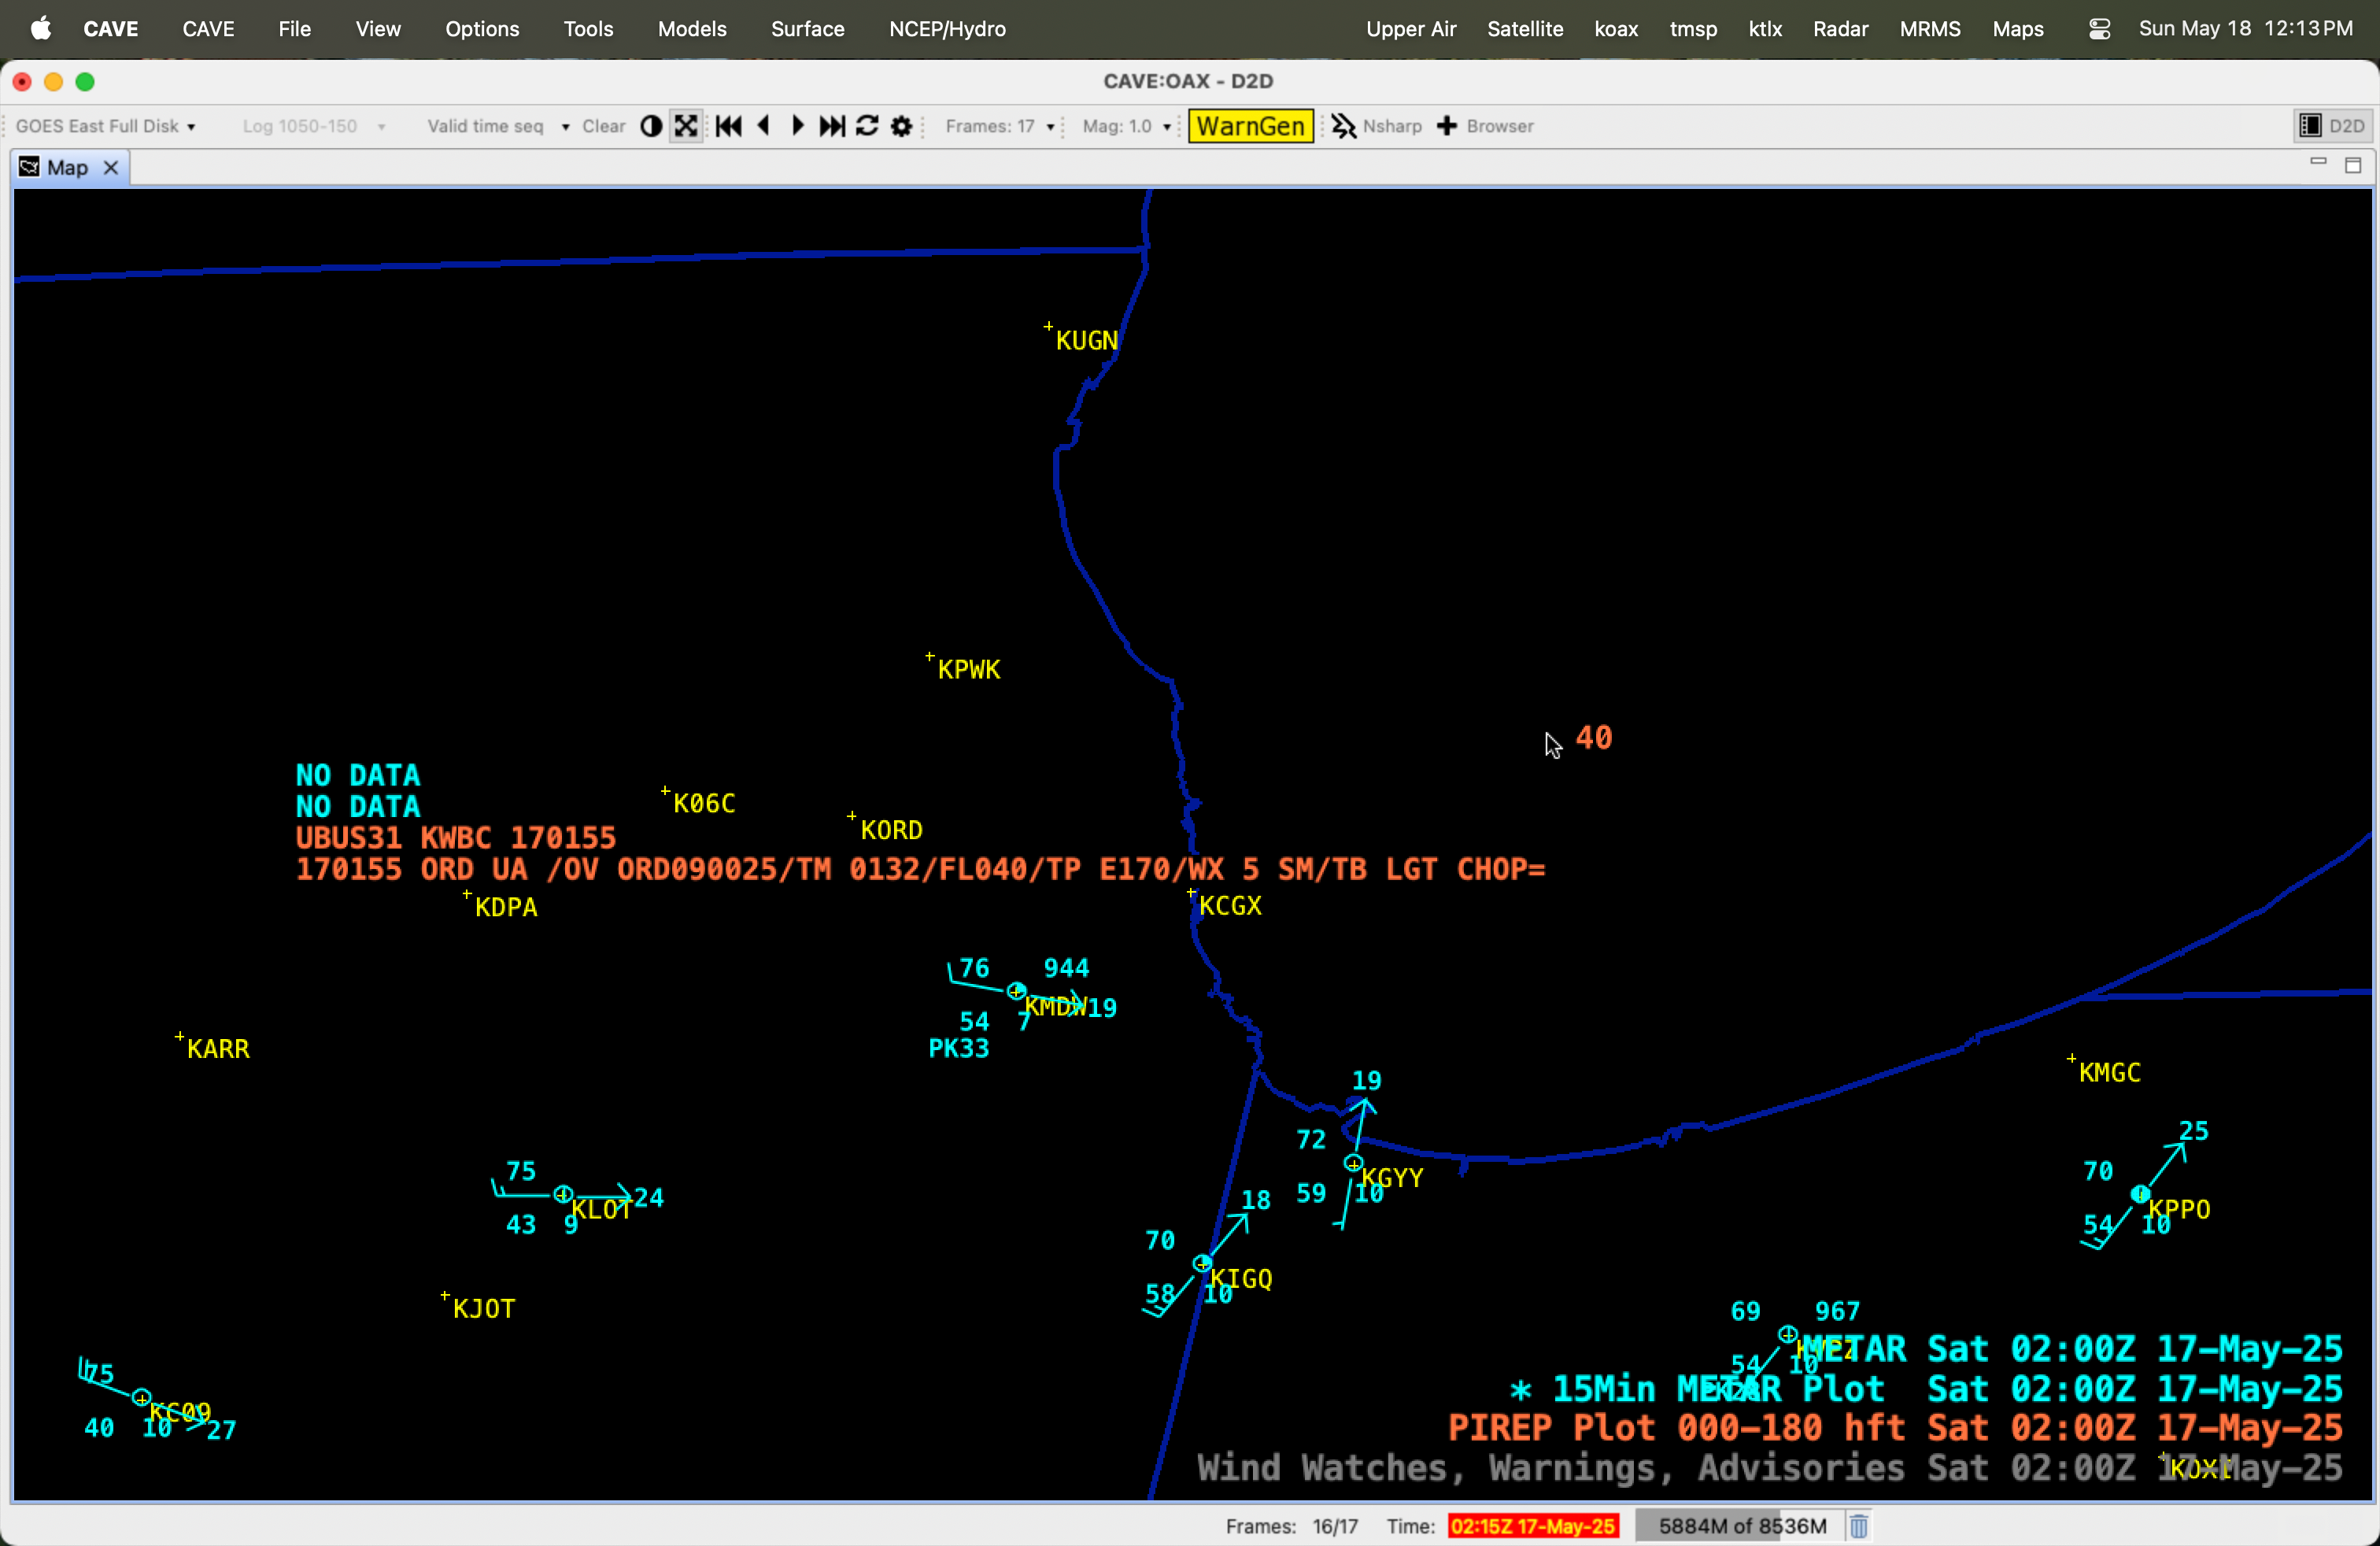
Cursor sample of a Pilot Report (orange) over Lake Michigan at 0132 UTC on 17 May [click to enlarge]