Rain development across the Samoan Islands
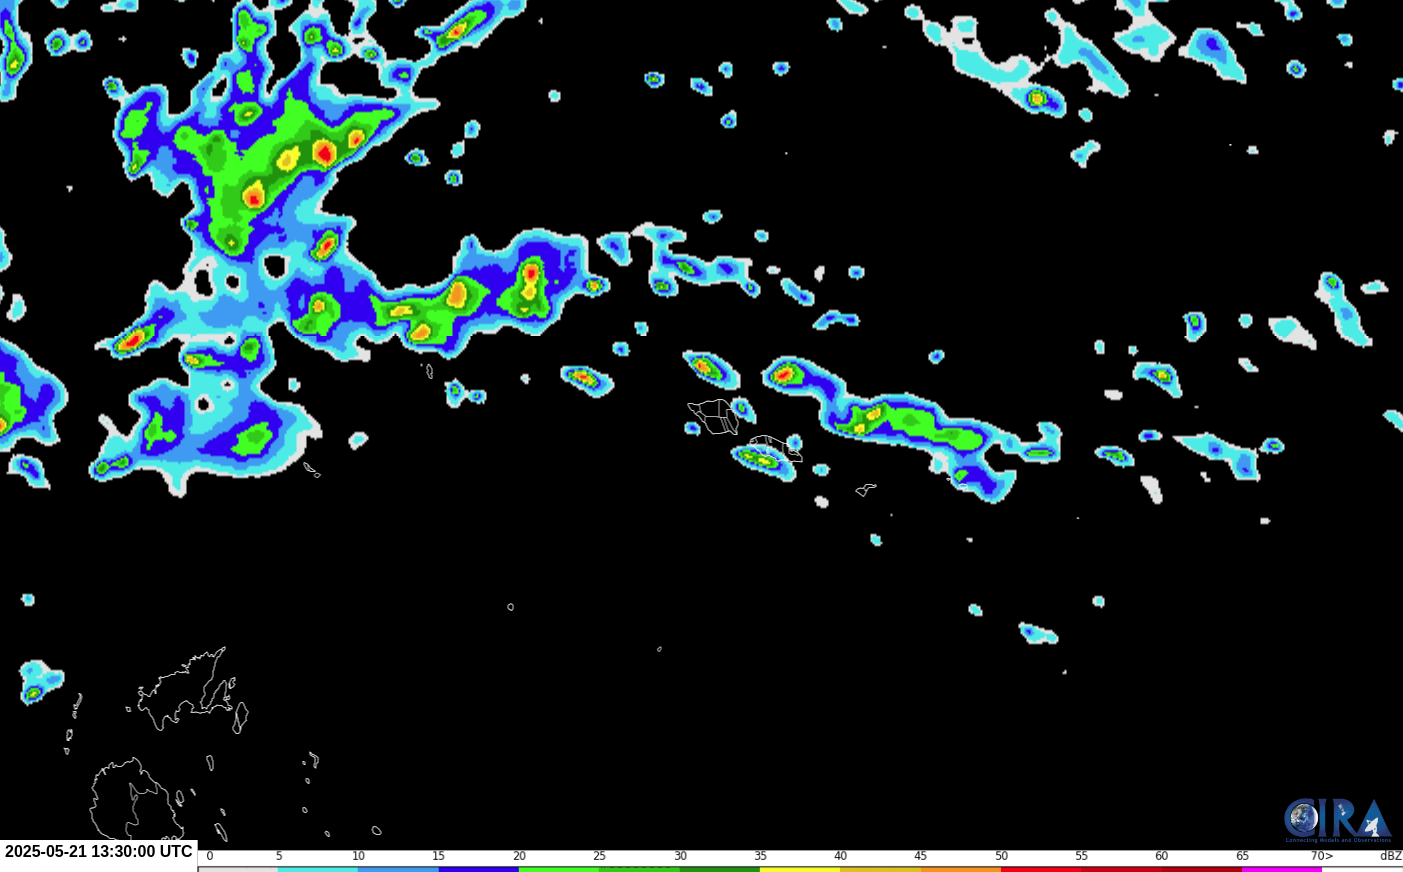
Night Microphysics RGB imagery over the Samoan Islands, above, saved from the CSPP Geosphere site, shows the characteristic color changes in the Night Microphysics RGB imagery from pink/salmon to dark red as lines of cumulus grow to thunderstorms. GREMLIN fields from the CIRA Slider, below, show the satellite-estimated MRMS fields. Rain starts developing southeast of American Samoa, getting fairly intense after 1500 UTC.
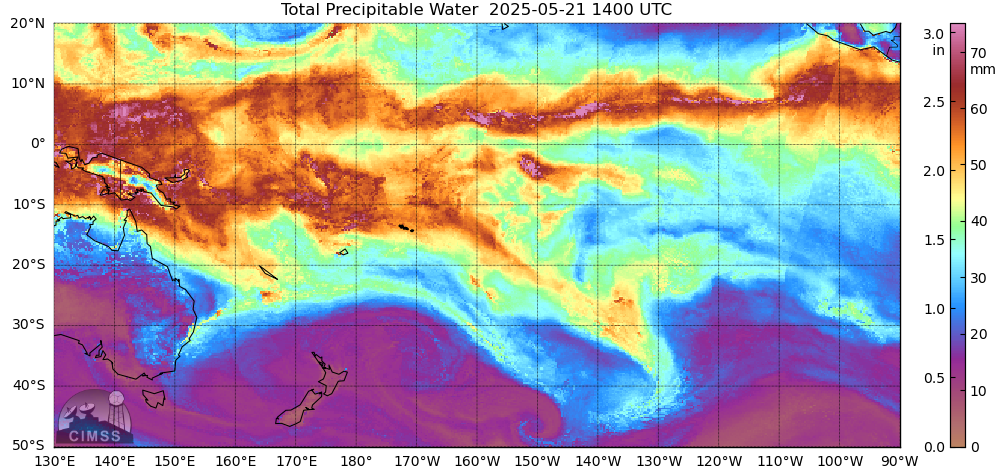
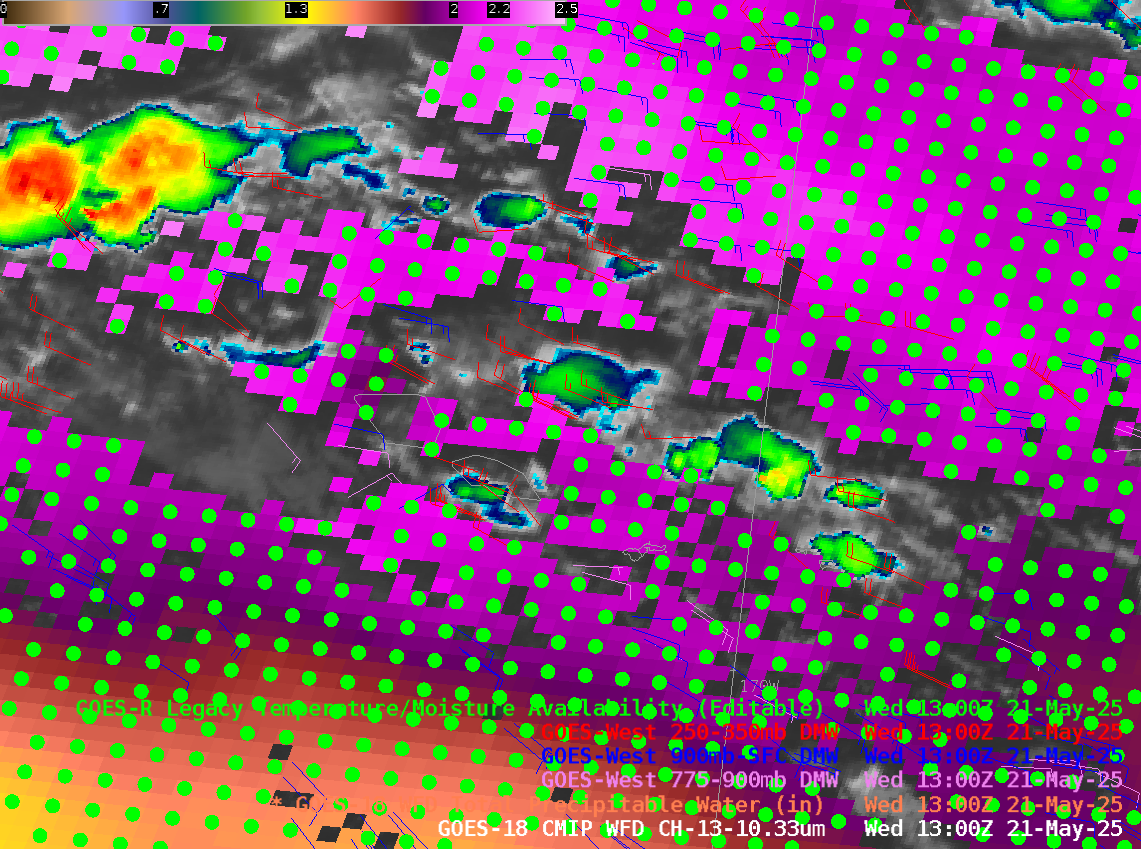
The shower development occurred within a moist airmass, as diagnosed by the MIMIC Total Precipitable Water field shown below at 1400 UTC on 21 May 2025. (Source) The Samoan Island chain was near the southern edge of the moisture associated with the South Pacific Convergence Zone; to date in May, Pago Pago has received for than 18″ of rain, an amount that almost places May 2025 in the top ten of wet Mays at that station (the wettest May, with 29.1″, was 1999).
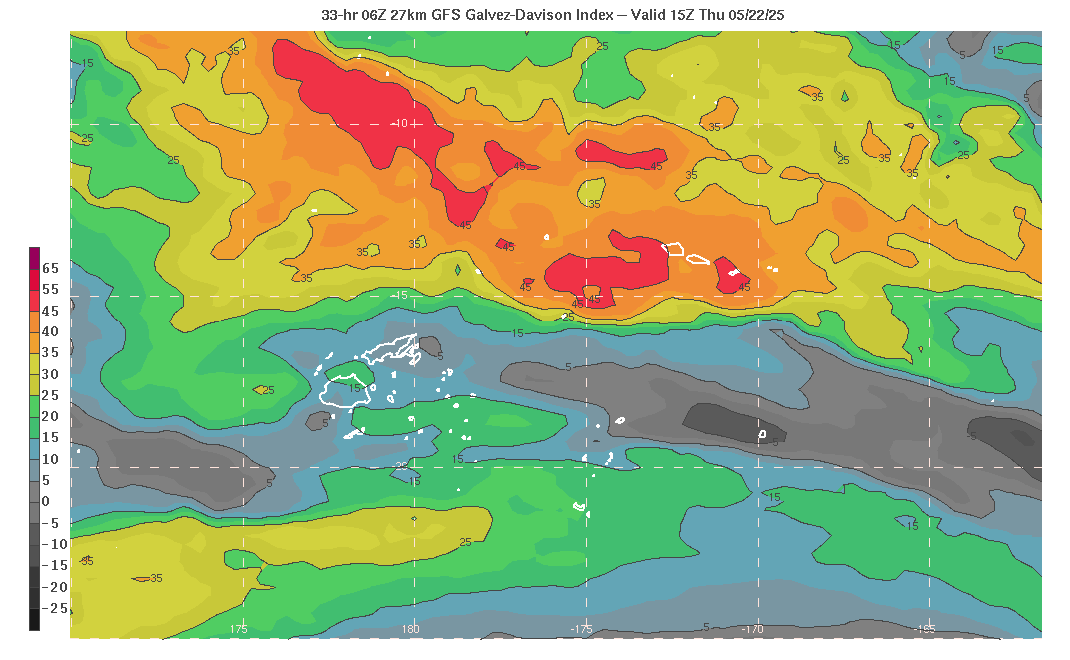
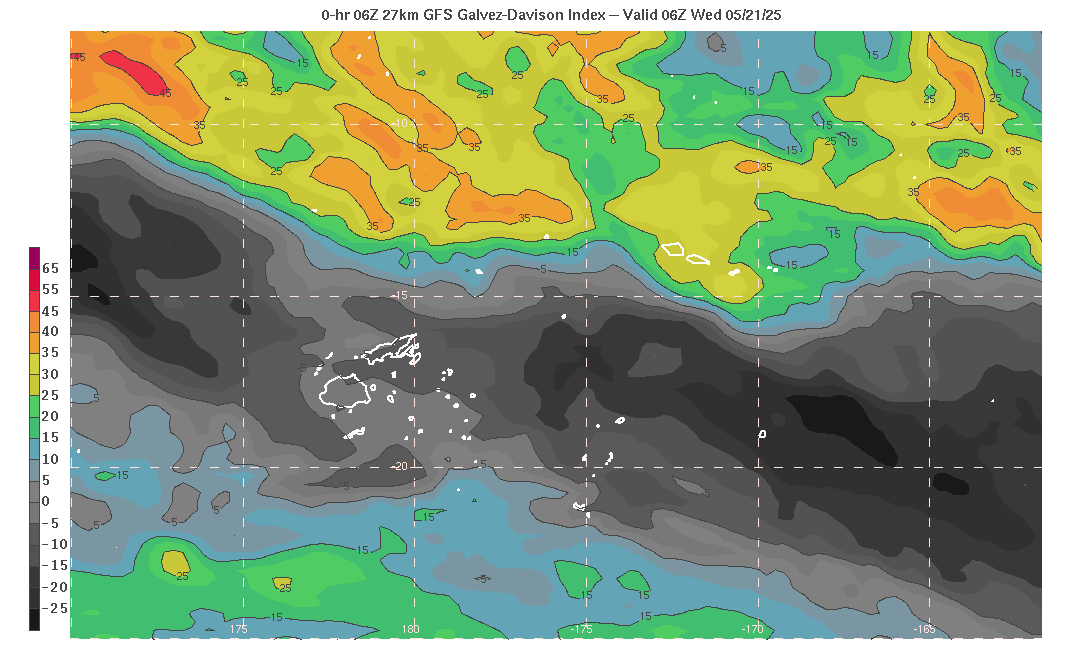
What kind of products might help a forecaster anticipate the convective development? GFS forecasts for the Galvez-Davison Index (source), below, show values consistently around 30, suggesting scattered showers and maybe a thunderstorm. (Values tomorrow there are forecast to be substantially higher; check back to see if it’s raining!)
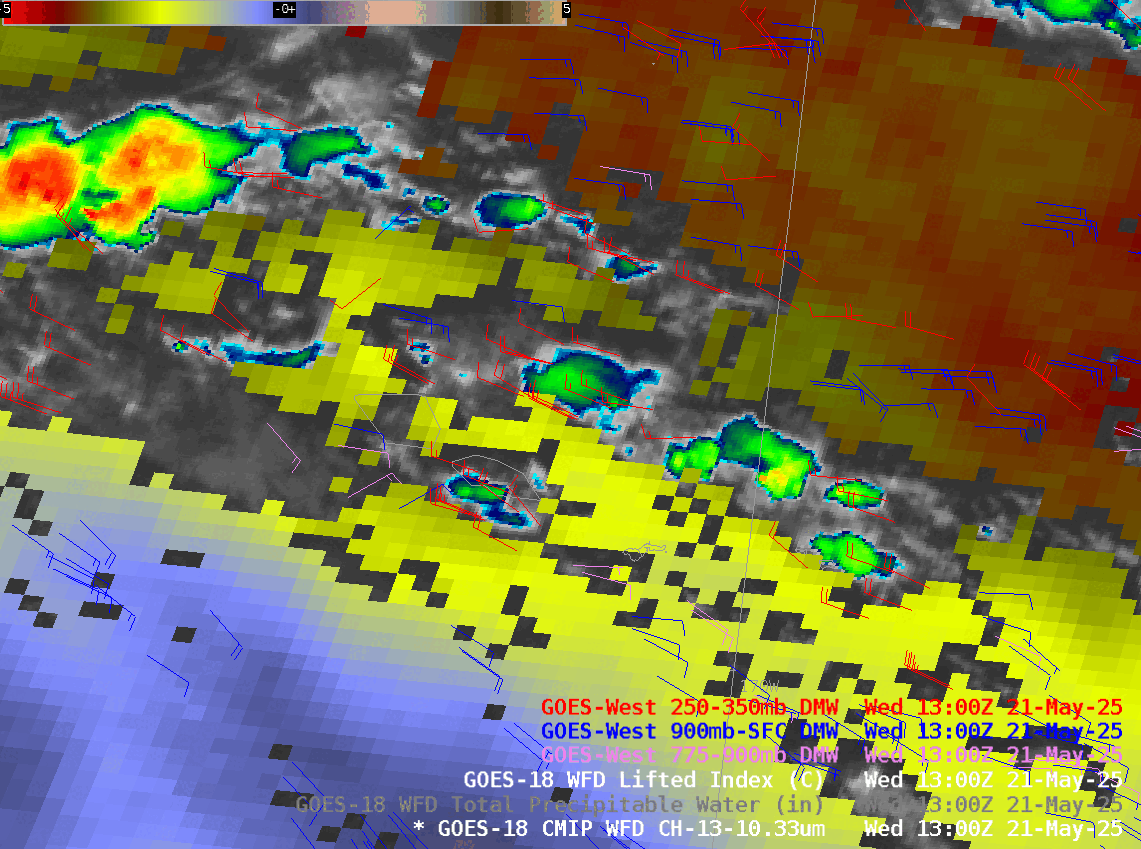
For nearcasting/nowcasting convective development, consider the animation below. GOES-18 Derived Lifted Index values show the region (Values around -2) on the shoulder of an unstable area to the north, where Lifted Indices are close to -5. Low-level derived motion vectors from GOES-18 (in dark blue) show confluence over the Samoan Islands; winds are primarily easterly to the north of the islands, and more southeasterly to the south of the islands. Low-level winds are conducive to convective development and the airmass is moist. Upper-level winds are also plotted (in red) ; but an obvious divergent signal is lacking.
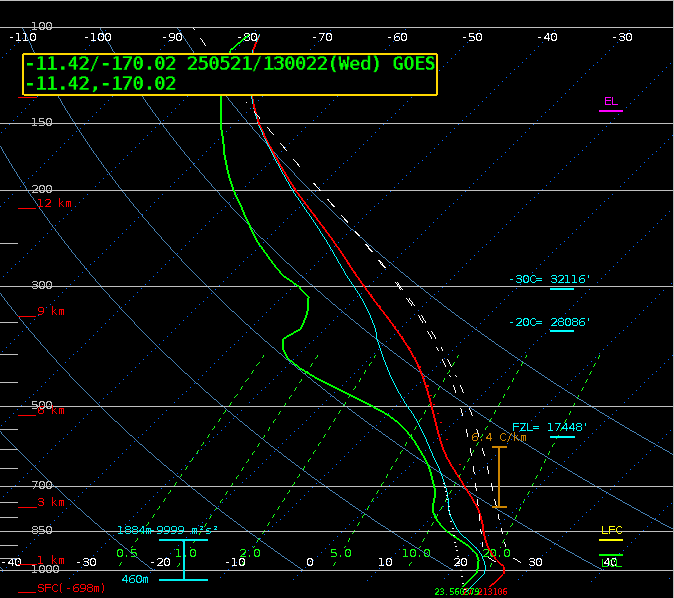
Legacy Profiles from GOES-18 augment model information with the temperature and moisture information within ABI’s 16 channels. The (clear-sky) locations at 1300 UTC are shown below, and a comparison between a profile in the deep moisture (where convection is not occurring) — at 11.4oS, 170oW — and a profile at the southwest edge of the domain shown — at 16oS, 173oW — shows the differences in moisture/stability (especially the level of the LFC) in the two regions.
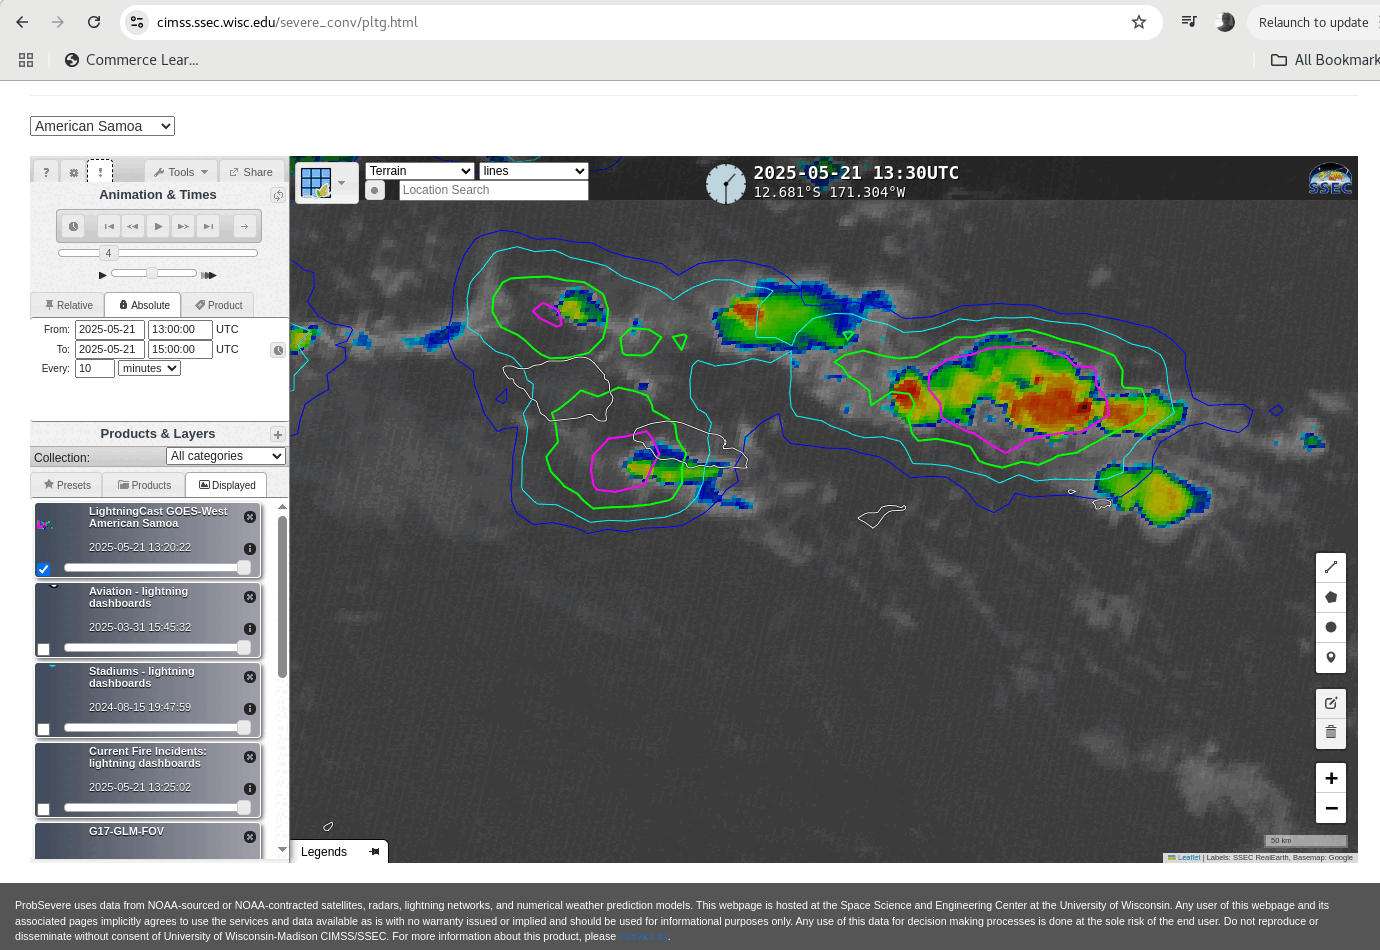
LightningCast Probability fields (available here) give the probability of when a GLM observation of lightning is likely in the next 60 minutes. When the geographic distribution of the probability fields starts to change, that can mean something. The animation below stretches from 1330-1510 UTC on 21 May 2025. The probability contours expand south of American Samoa at 1450 UTC. This suggests development of some kind is happening there. By 1510 UTC, obvious convection is developing there!
For more information on Pago Pago’s weather, refer to the National Weather Service.