Geo2grid software was used to create the three true-color animations below, using GOES-16 Full-Disk Level-1b Radiance data over the tropical Atlantic. ABI gives a vivid representation of the cloud patterns associated with a tropical wave developing (near 35oW on 27 June, near 40oW on 28 June, and approaching 50oW on 29 June). The storm was declared a tropical depression at 2100 UTC on 28 June and was hurricane Beryl starting at 2100 UTC on 29 June (The archive of NHC advisories is here).
The geo2grid commands to create the GOES imagery are shown below. Three different domains are chosen, then the geo2grid commands to create true color imagery (-p true_color) on the defined grids (ATLTROP1, ATLTROP2 and ATLTROP3) are created, and coastlines and latitude/longitude lines are added. Image Magick was then used to annotate the imagery and create the animation.
./p2g_grid_helper.sh ATLTROP1 -30.0 8.0 2000 -2000 1760 760 > ATLTROP1.yaml
./p2g_grid_helper.sh ATLTROP2 -45.0 8.0 2000 -2000 1760 760 > ATLTROP2.yaml
./p2g_grid_helper.sh ATLTROP3 -50.0 10.0 2000 -2000 1760 760 > ATLTROP3.yaml
for k in 1000 1010 1020 1030 1040 1050 1100 1110 1120 1130 1140 1150 1200 1210 1220 1230 1240 1250 1300 1310 1320 1330 1340 1350 1400 1410 1420 1430 1440 1450 1500 1510 1520 1530 1540 1550 1600 1610 1620 1630 1640 1650 1700 1710 1720 1730 1740 1750 1800 1810 1820 1830 1840 1850 1900
do
./geo2grid.sh -r abi_l1b -w geotiff -p true_color -g ATLTROP1 --grid-configs ATLTROP1.yaml -f /path_to_abi_data/abi/L1b/RadF/*s2024179$k*
./geo2grid.sh -r abi_l1b -w geotiff -p true_color -g ATLTROP2 --grid-configs ATLTROP2.yaml -f /path_to_abi_data/abi/L1b/RadF/*s2024180$k*
./geo2grid.sh -r abi_l1b -w geotiff -p true_color -g ATLTROP3 --grid-configs ATLTROP3.yaml -f /path_to_abi_data/abi/L1b/RadF/*s2024181$k*
done
./add_coastlines.sh --add-coastlines --add-grid --grid-D 5.0 5.0 --grid-d 5.0 5.0 --grid-text-size 12 *ATLTROP1*.tif
./add_coastlines.sh --add-coastlines --add-grid --grid-D 5.0 5.0 --grid-d 5.0 5.0 --grid-text-size 12 *ATLTROP2*.tif
./add_coastlines.sh --add-coastlines --add-grid --grid-D 5.0 5.0 --grid-d 5.0 5.0 --grid-text-size 12 *ATLTROP3*.tif
GOES-16 and ABI give useful information about the clouds but the structures underneath the clouds — rain bands and moisture distributions — are vital for a complete understanding of how the atmosphere is behaving, especially for cases of developing tropical systems. JAXA’s GCOM-W1 satellite carries the AMSR-2 instrument that observes energy in the microwave part of the electromagnetic spectrum, and the data are available for download. This document below will walk you through the download procedure.
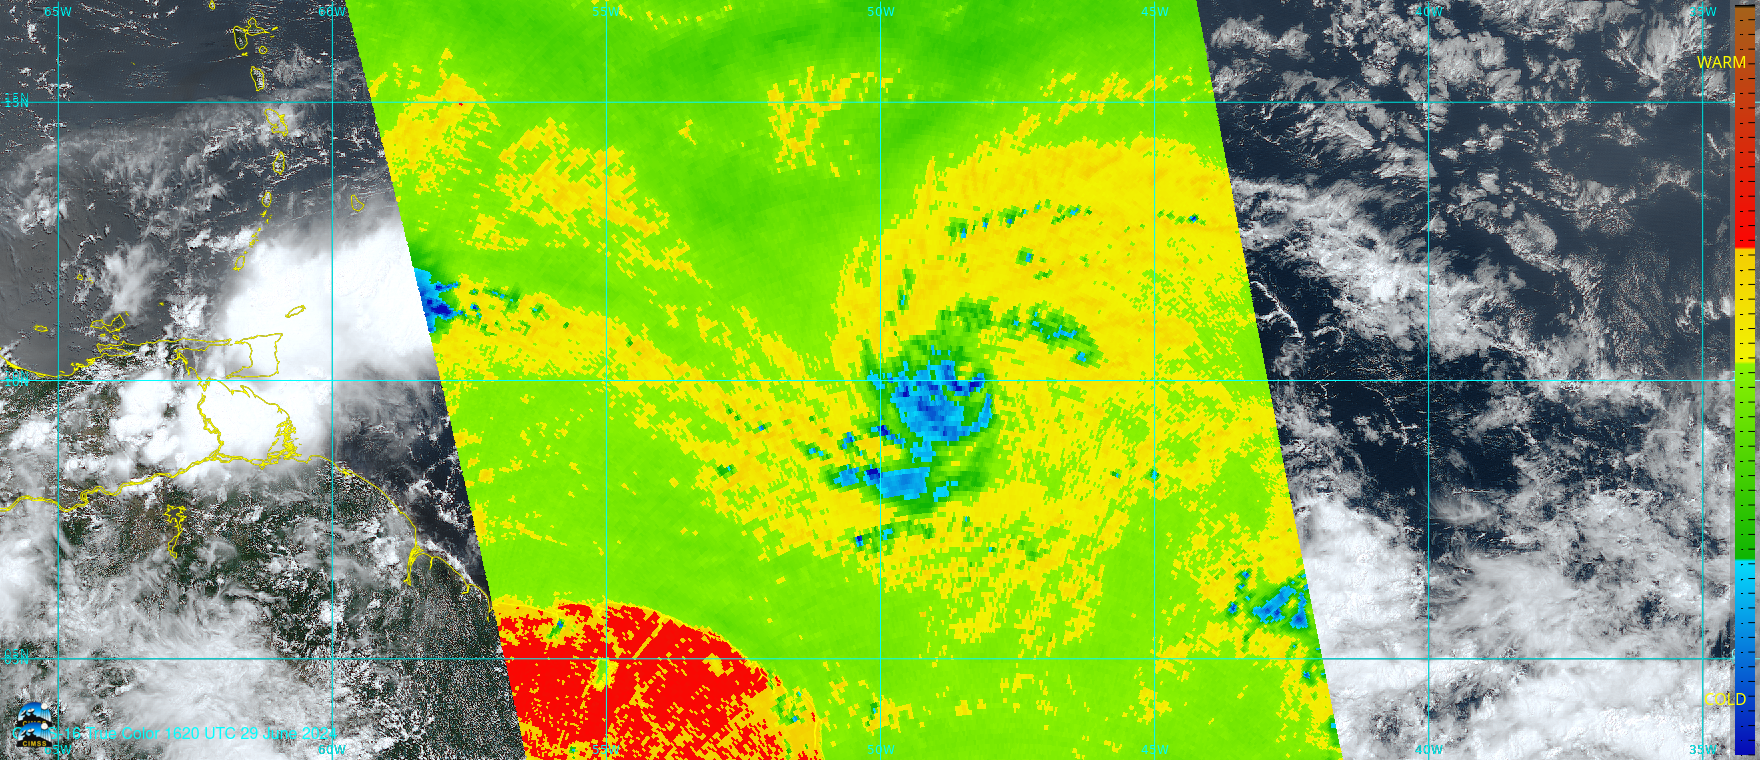
Once the data are available and downloaded to your system, use Polar2Grid to create imagery. For this case, I’ve chosen data swaths from June 27 (1453 UTC), June 28 (1536 UTC) and June 29 (1619 UTC). In this case we are focused on 89 GHz information; in the tropics, these data give information about deep convection because 89 GHz energy is strongly scattered by ice crystals as are found in deep convection. The polar2grid commands used to create imagery and to add a color enhancement that comes with polar2grid are listed below. Note that the grid definitions created for geo2grid, above, can be used for polar2grid. This makes it easy to overlay polar imagery on top of geo imagery, as shown below. A subsequent call to add_coastlines adds coastlines and latitude/longitude lines and a colorbar.
./polar2grid.sh -r amsr2_l1b -w geotiff -p btemp_89.0ah -g ATLTROP1 --grid-configs ./ATLTROP1.yaml -f ./AMSR2Data/GW1AM2_202406271453_085A_L1SGBTBR_2220220.h5

./polar2grid.sh -r amsr2_l1b -w geotiff -p btemp_89.0ah -g ATLTROP2 --grid-configs ./ATLTROP2.yaml -f ./AMSR2Data/GW1AM2_202406281536_092A_L1SGBTBR_2220220.h5

./polar2grid.sh -r amsr2_l1b -w geotiff -p btemp_89.0ah -g ATLTROP3 --grid-configs ./ATLTROP3.yaml -f ./AMSR2Data/GW1AM2_202406291619_099A_L1SGBTBR_2220220.h5

./add_colormap.sh ../colormaps/amsr2_89h.cmap gcom-w1_amsr2_btemp_89.0ah_20240629_161900_ATLTROP3.tif
./add_colormap.sh ../colormaps/amsr2_89h.cmap gcom-w1_amsr2_btemp_89.0ah_20240628_153600_ATLTROP2.tif
./add_colormap.sh ../colormaps/amsr2_89h.cmap gcom-w1_amsr2_btemp_89.0ah_20240627_145300_ATLTROP1.tif
On 27 June, the daytime AMSR-2 overpass just missed (as sometimes happens!) the developing system, but there is information over the eastern 1/3rd of the tropical wave, and very little organization is present. One day later, on the 28th, the storm is sampled quite well, and cold cloud tops are apparent, but spiral banding is not. But the 29th, pronounced spiral banding is present and an eye is forming. (Click here to view the AMSR-2 imagery along at 0358 and 1619 UTC on 29 June).
At some time after the above post was published, the GCOM site entered a period of extended maintenance, scheduled to end in March of 2025. The pdf file below outlines how to access files. When you access the website https://gportal.jaxa.jp/gpr/, you’ll see an announcement that the website above is offline through at least March. However, JAXA has an Alternate Service for each satellite, including GCOM-W1. Once GCOM-W1 is selected, click on the G-Portal Repo, then standard, then GCOM-W1, and AMSR2, and L1b, then 2, then find the correct year/month combination. The month directory contains all that data available in that month, and it’s left to the user to determine the times needed. The SSEC/CIMSS Polar Orbit Track website is useful in that regard, as you can find the times when a Polar Orbiter satellite passed a particular point. That helps you download the correct files. In this case for Guam, the file names are GW1AM2_202411110314_205A_L1SGBTBR_2220220.h5 and GW1AM2_202411111536_100D_L1SGBTBR_2220220.h5 and Polar2Grid can create imagery from those files. Those are shown below.

View only this post Read Less


