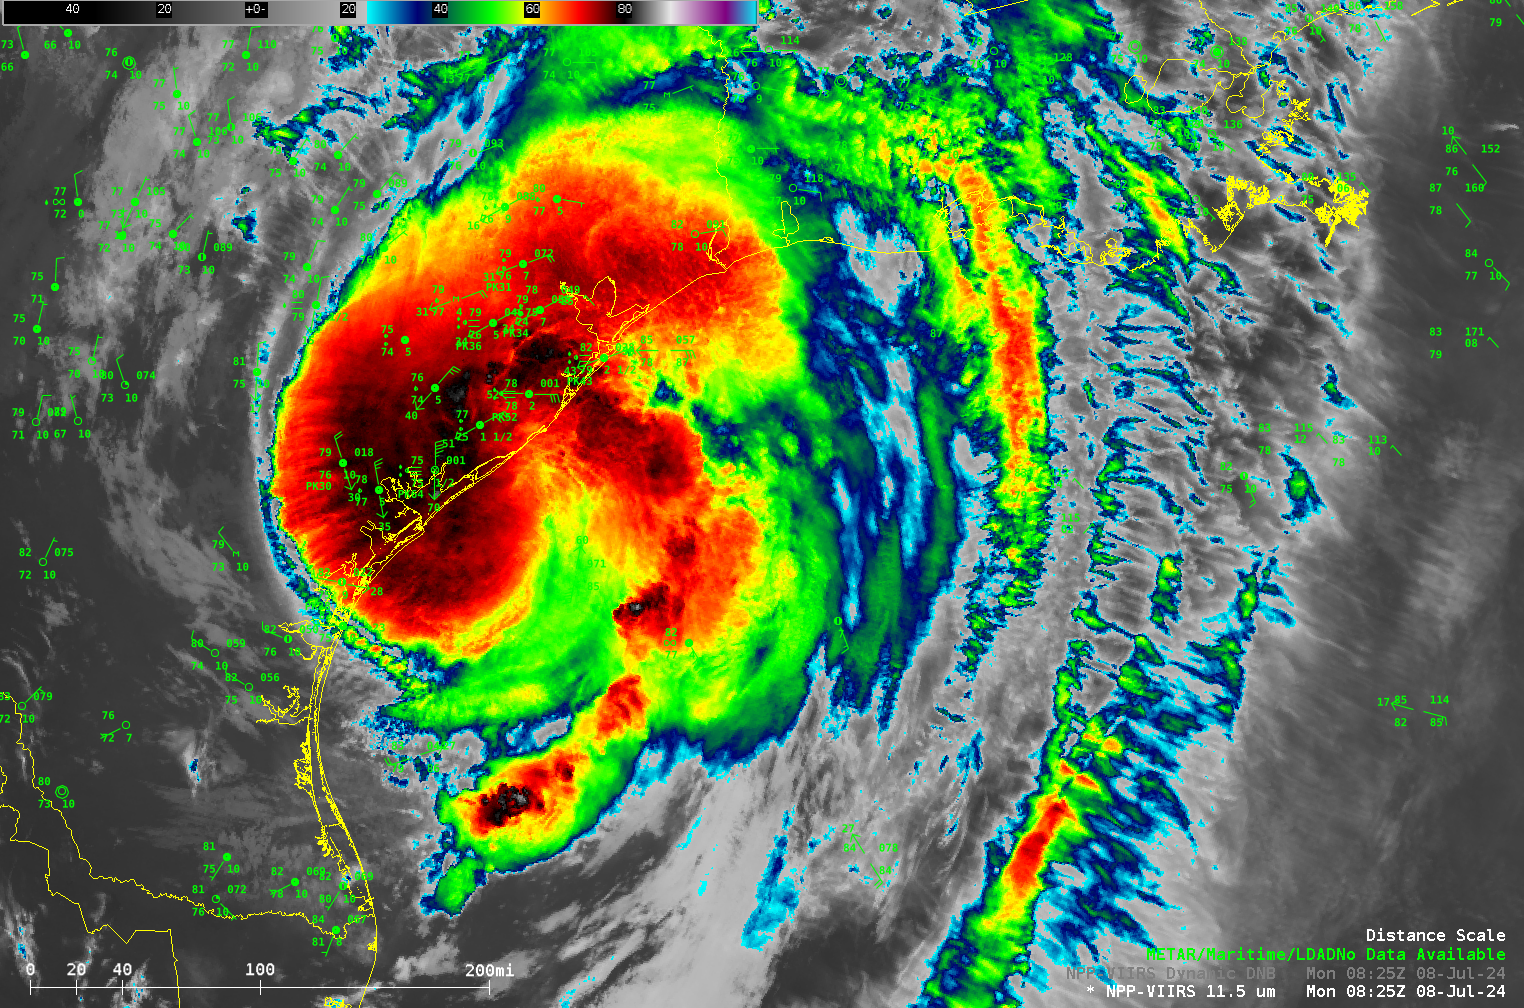
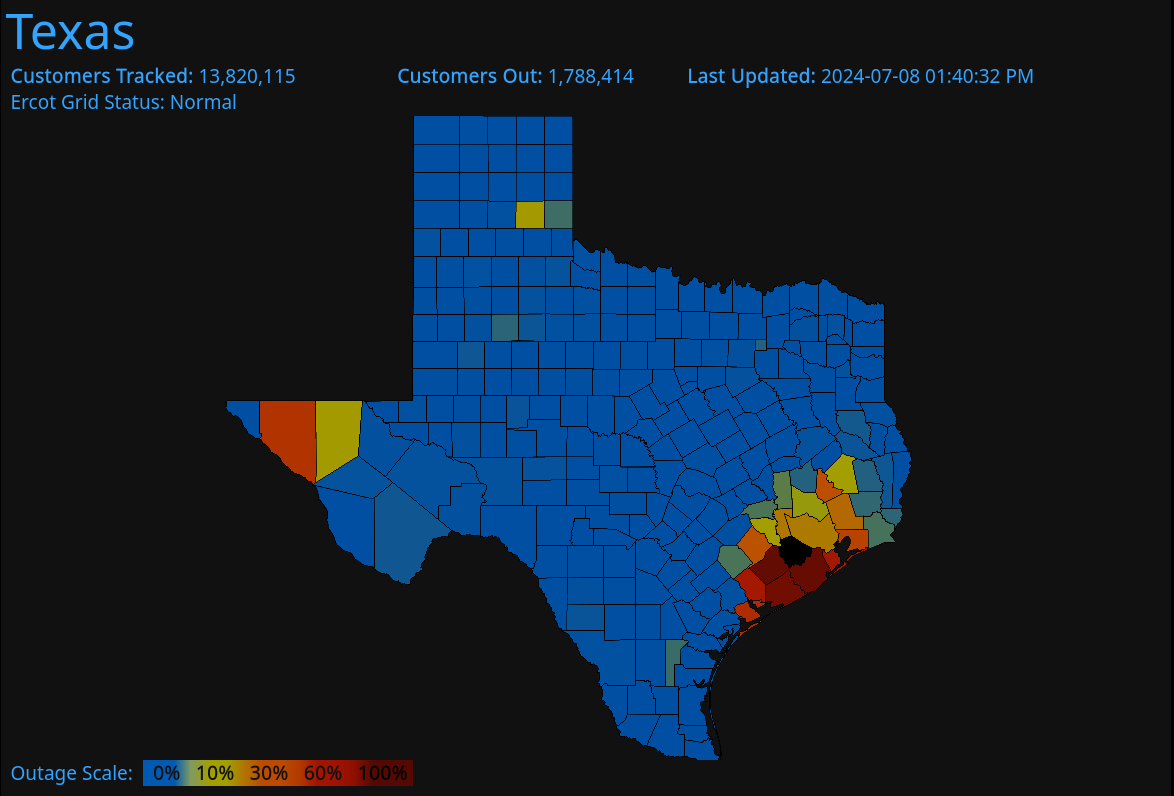
Hurricane Beryl made a (final) landfall along the Texas Gulf Coast, near Matagorda TX, at about 4 AM CDT/0900 UTC on 8 July. VIIRS imagery, above, from the SSEC/CIMSS Direct Broadcast antenna, shows infrared (I05, 11.45 µm) imagery and Day Night Band visible (0.7 µm) imagery around the time of landfall. It is noteworthy that city lights are unable to penetrate the thick clouds (some of the reduction in light intensity might be due to power outages, as shown below from this source).
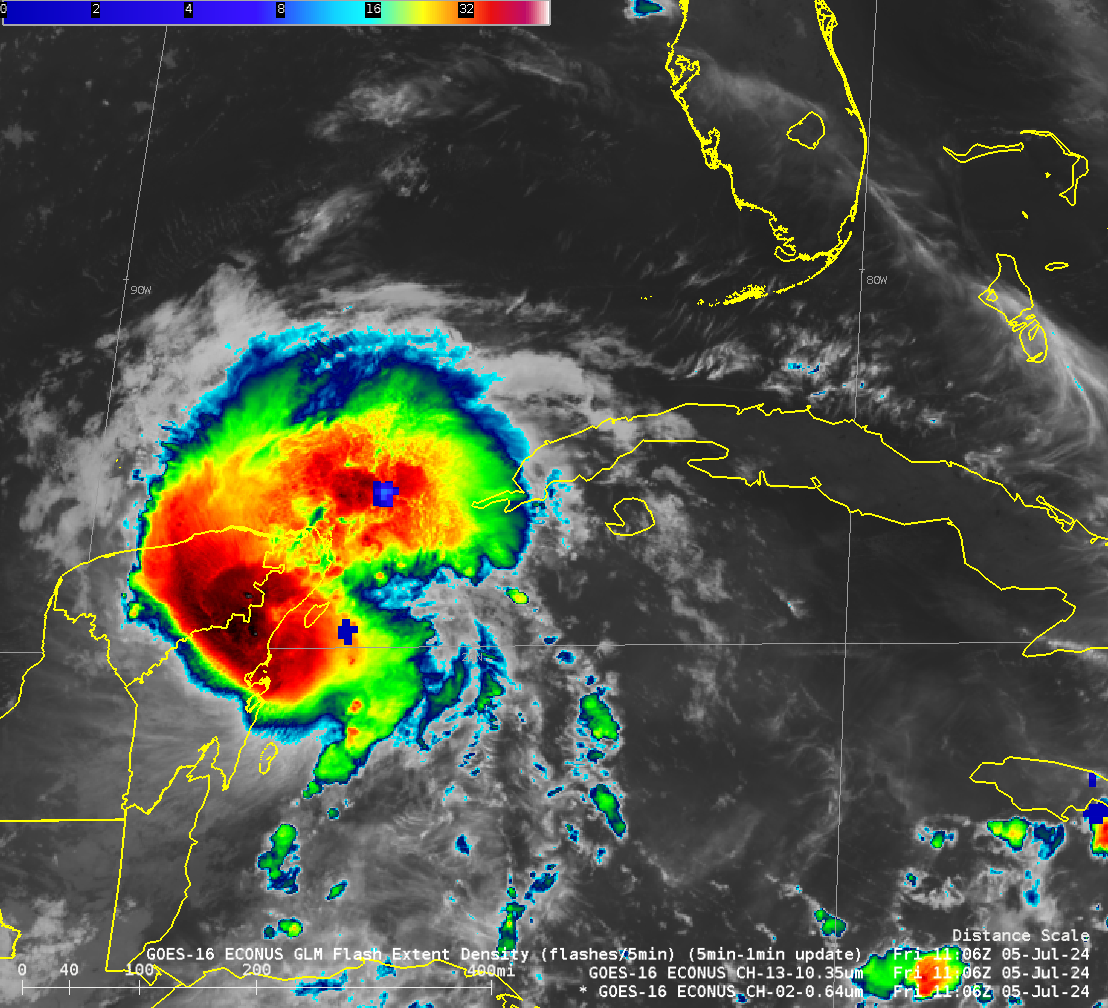
GOES-16 Clean Window imagery overlain with GLM Flash Extent Density, below, shows the evolution of the storm from 0651 UTC through 1321 UTC on 8 July. Subsequent to landfall, the satellite presentation of the storm degrades, as expected. Heavy Rains and Storm Surge along the coast will remain threats through the day on the 8th.
For the last hours of her time over the western Gulf of Mexico, Beryl was in a very favorable environment for strengthening. Shear values (source, shown below) were low and SSTs were very warm. Prior to this time, strengthening of Beryl was in part limited by a lack of an inner core, as shown in this microwave (36.5 and 89.0 GHz) toggle from 1916 UTC on 7 July, taken from the direct broadcast site at AOML; unfortunately, the 8 July 2024 morning passes of GCOM did not sample Beryl.
For the latest information on Beryl, refer to the National Hurricane Center and to local National Weather Service offices: Corpus Christi, Houston/Galveston, Lake Charles, Dallas/Fort Worth and Shreveport.
View only this post Read Less


