This website works best with a newer web browser such as Chrome, Firefox, Safari or Microsoft
Edge. Internet Explorer is not supported by this website.
GOES-19 (Preliminary/Non-operational) Day Cloud Phase Distinction RGB images (above) — created using Geo2Grid — displayed supercooled “lake effect” clouds (shades of white) streaming southeast off Lake Sakakawea in northwestern North Dakota on 25th November 2024. A smaller cloud plume was also seen streaming southeast off Devils Lake in northeastern North Dakota. Existing snow cover appeared as shades of green... Read More
GOES-19 (Preliminary/Non-operational) Day Cloud Phase Distinction RGB images, from 1431-2216 UTC on 25th November [click to play animated GIF | MP4]
GOES-19 (Preliminary/Non-operational) Day Cloud Phase Distinction RGB images (above) — created using Geo2Grid — displayed supercooled “lake effect” clouds (shades of white) streaming southeast off Lake Sakakawea in northwestern North Dakota on 25th November 2024. A smaller cloud plume was also seen streaming southeast off Devils Lake in northeastern North Dakota. Existing snow cover appeared as shades of green in the RGB images, with bare ground appearing as shades of blue.
GOES-16 (GOES-East) Near-Infrared “Snow/Ice” (1.61 µm) images (below) included 15-minute plots of METAR surface reports — which showed brief periods of light snow at Hazen (KHZE) and Bismarck (KBIS). Snow cover appeared as darker shades of gray to black in the Snow/Ice imagery. Note the cold air — having temperatures in the single digits to teens F — that was flowing across the still-unfrozen reservoirs of the Missouri River (in addition to Devils Lake). Water surface temperatures on Lake Sakakawea were in the middle to upper 40s F.
GOES-16 Near-Infrared “Snow/Ice” (1.61 µm) images, with 15-minute METAR surface reports plotted in cyan, from 1416-2231 UTC on 25th November [click to play animated GIF | MP4]
GOES-West imagery centered over the Samoan Islands, shown above in an animation, shows a region of rich moisture surrounding those islands (purple in the enhancement, which suggests values or 2-2.2″), but the islands themselves are within a dry pocket (TPW values closer to 1.7″, orange/rust in the enhancement used). Total... Read More
GOES-18 Band 13 Clean Window infrared (10.3 µm) imagery and clear-sky estimates of Total Precipitable Water, 0000 – 1531 UTC on 25 November 2024 (Click to enlarge)
GOES-West imagery centered over the Samoan Islands, shown above in an animation, shows a region of rich moisture surrounding those islands (purple in the enhancement, which suggests values or 2-2.2″), but the islands themselves are within a dry pocket (TPW values closer to 1.7″, orange/rust in the enhancement used). Total Precipitable Water derived from Microwave data, below (from the MIMIC website), shows similar values, including the local minimum over Samoa. A benefit with microwave observations of atmospheric moisture (compared to ABI) is the ability to detect values in the presence of clouds.
MIMIC Total Precipitable Water estimates, 1600 UTC 24 November – 1500 UTC 25 November 2024 (Click to enlarge)
Pago Pago airport does have an upper-air station. However, hydrogen generation difficulties at that site in the past months have meant that balloon launches are limited, and one did not occur at 1200 UTC on 25 November. However, NOAA-20 overflew the region shortly thereafter and NUCAPS soundings can estimate the thermodynamic profile. The plot below shows where profiles are available; green points signify profiles for which the infrared retrieval converged to a solution, typically in regions of mostly clear skies (as might be inferred from the GOES-18 imagery above!)
NUCAPS Sounding Availability plots in the south Pacific Ocean, ca. 1230 UTC on 25 November 2024 (Click to enlarge)
The toggle below shows two NUCAPS profiles, one just west of Tutuila (at 14.2oS, 171.5oW) and one 6 points to the south (at 16.55oS, 171.5oW). Note the larger values of TPW in the more southerly sounding, consistent with what is discussed above. Otherwise, the profiles are quite similar.
NUCAPS Profiles near 171.5 W, near Tutuila (at 14.2 S) and south of Tutuila (at 16.55 S), ca. 1304 UTC on 25 November 2024 (Click to enlarge)
Level 2 products also include clear-sky measures of instability, such as Lifted Index and Convective Available Potential Energy (CAPE). The Lifted Index field below shows pockets of stability (blue in the enhancement used) surrounded by minor instability (yellow in the enhancement) surrounding the Samoan Islands.
CAPE values (scaled from 0-400 J/kg) similarly show relatively weak regions of stability and instability surrounding the Samoan islands.
GOES-West Clean Window infrared (Band 13, 10.3 µm) imagery and clear-sky estimates of CAPE (Scaled from 0-400), 0000 – 1530 UTC On 25 November 2024 (Click to enlarge)
The TPW fields, and the Derived Stability Indices, do have similarities as might be expected. The toggles below compare TPW, LI an CAPE at 0300 and at 1300. Interestingly, the strong values of CAPE at the eastern edge of the domain at 0300 UTC seemingly have no echo in the other fields. In other regions (north of the Samoan Islands, for example), minima in CAPE and relative stability in Lifted Index occur where local minima in TPW exist. This case demonstrates how one stability index might not give the same information as another; make sure you have access to both!
GOES-18 clean window infrared (Band 13, 10.3 µm) imagery under clear sky estimates of Total Precipitable Water, CAPE and Lifted Index, 0300 UTC on 25 November 2024 (Click to enlarge)GOES-18 clean window infrared (Band 13, 10.3 µm) imagery under clear sky estimates of Total Precipitable Water, CAPE and Lifted Index, 1300 UTC on 25 November 2024 (Click to enlarge)
The (anti-clockwise) motion of the cloud features above suggests that an anticylone is present over the islands The animation below includes GOES-West derived motion wind vectors computed from Band 9 (mid-level water vapor, 6.95 µm) infrared images. The wind vectors are from near 350 mb, which height is determined by matching the Band 9 brightness temperature to GFS model temperatures.
GOES-18 clean window infrared (Band 13, 10.3 µm) imagery under clear sky estimates of Total Precipitable Water, with Derived Motion Wind vectors computed with Band 9 (mid-level water vapor) infrared imagery, 0000-1530 UTC on 25 November (Click to enlarge)
Level 2 Products, especially in regions — like the South Pacific Ocean — where conventional data are lacking, can give a forecaster needed insight into how the atmosphere might evolve with time.
The distinct hot thermal signature (black to yellow to red pixels) of a new fissure eruption between Stóra-Skógfell and Sýlingarfell on the Reykjanes Peninsula in southwestern Iceland was apparent in 10-minute Full Disk scan GOES-16 (GOES-East) Shortwave Infrared (3.9 µm) images during the 20th-24th November 2024 period (above). Station identifier BIRK is Reykjavik Airport, and... Read More
GOES-16 Shortwave Infrared (3.9 µm) images, from 2300 UTC on 20th November to 2100 UTC on 24th November [click to play animated GIF | MP4]
The distinct hot thermal signature (black to yellow to red pixels) of a new fissure eruption between Stóra-Skógfell and Sýlingarfell on the Reykjanes Peninsula in southwestern Iceland was apparent in 10-minute Full Disk scan GOES-16 (GOES-East) Shortwave Infrared (3.9 µm) images during the 20th-24th November 2024 period (above). Station identifier BIRK is Reykjavik Airport, and BIKF is Keflavik International Airport. The fissure eruption began at 2314 UTC on 20th November, with the first GOES-16 thermal signature appearing at 2320 UTC.
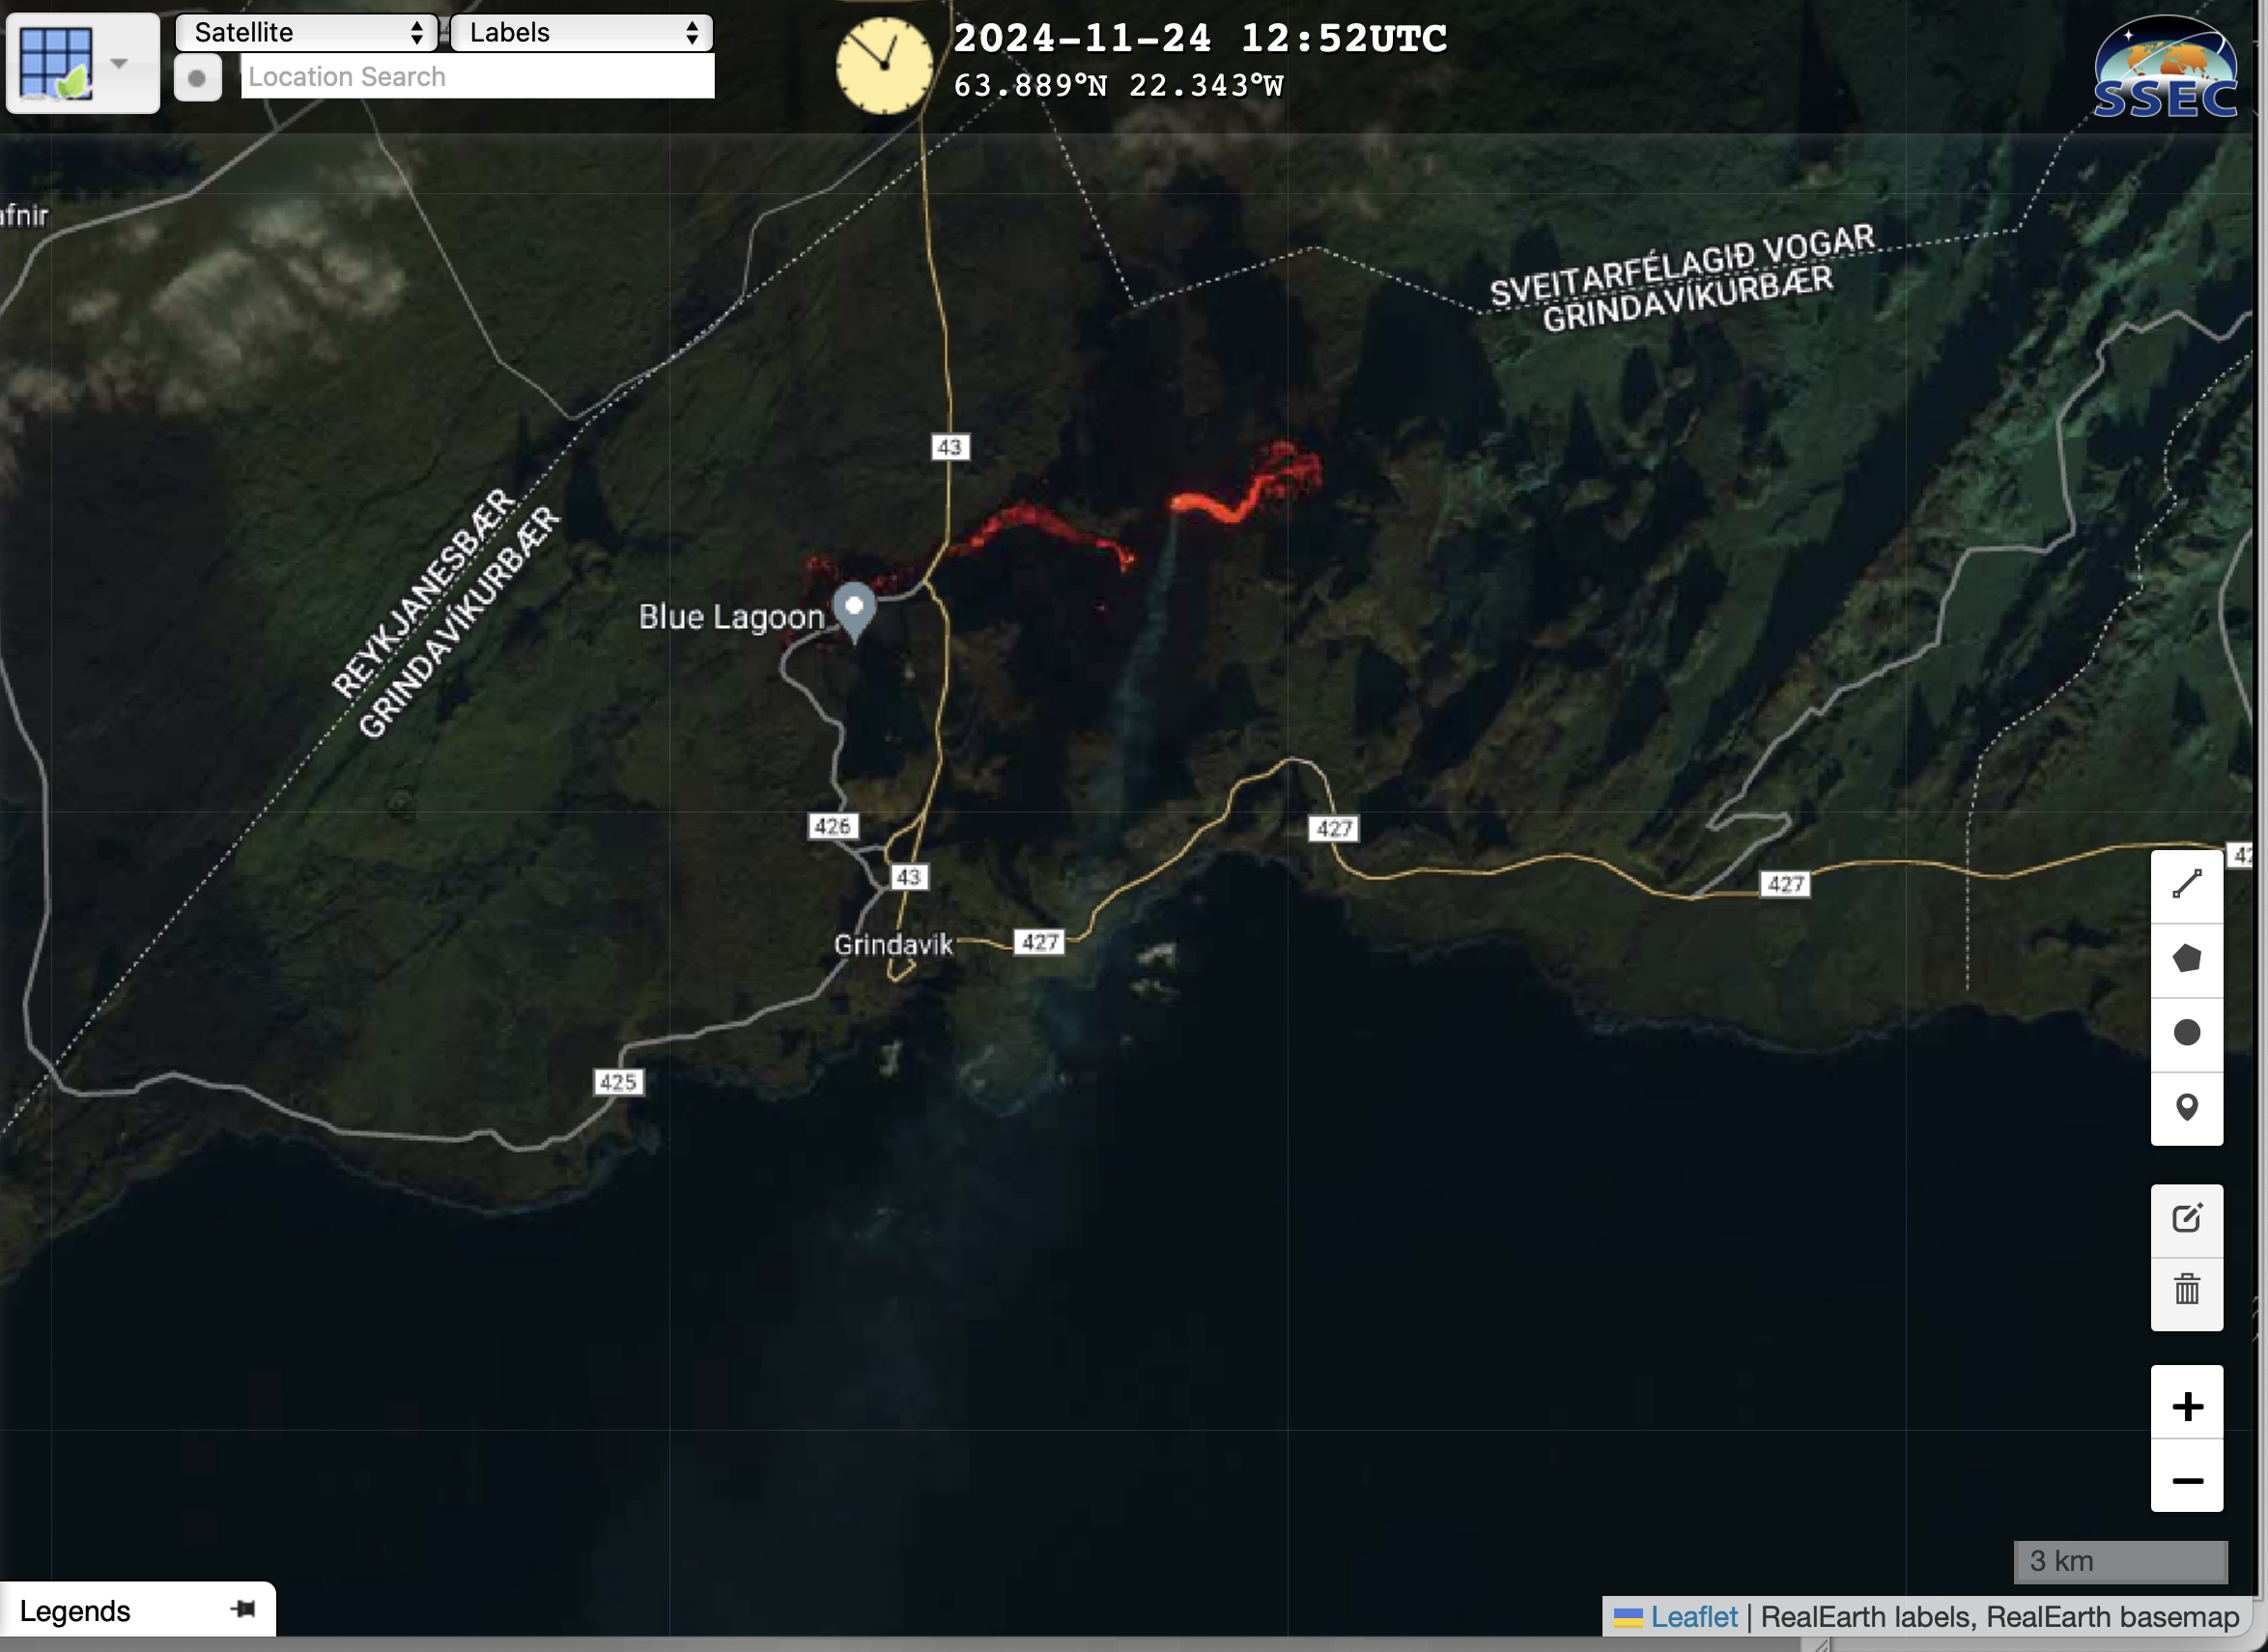
A 30-meter resolution Landsat-9 Natural Color image (source) provided a detailed view of the lava flow’s hot thermal signature (brighter shades of red) at 1252 UTC on 24th November (below). A hazy volcanic plume could be seen drifting to the south-southwest.
Landsat-9 Natural Color RGB image at 1252 UTC on 24th November [click to enlarge]
GOES-18 airmass RGB imagery, above (created using geo2grid software), shows the development of a hurricane-force low to the west of Washington and Oregon on the 19th of November. The orange and purple colors in the RGB suggest a significant intrusion of stratospheric air. That air is rich in ozone, and... Read More
GOES-18 airmass RGB 0000 UTC 18 November – 0000 UTC 20 November 2024 (Click to enlarge)
GOES-18 airmass RGB imagery, above (created using geo2grid software), shows the development of a hurricane-force low to the west of Washington and Oregon on the 19th of November. The orange and purple colors in the RGB suggest a significant intrusion of stratospheric air. That air is rich in ozone, and there are satellite observations that can highlight the ozone signal. NUCAPS profiles include information on trace gases, and the image below (from the JSTAR Mapper) shows the ozone distribution on 19 November.
NUCAPS estimates of Ozone on 19 November 2024 (Click to enlarge)
Suomi-NPP also includes the Ozone Mapping and Profiling Suite (OMPS) instrument — available here at NASA Worldview. The animation of OMPS Column Ozone, below (from this source), shows the motion of ozone-rich air from over Alaska on the 17th to the Gulf of Alaska/northeast Pacific Ocean on the 19th.
Suomi-NPP OMPS estimates of total column Ozone, 17, 18 and 19 November 2024 (Click to enlarge)
The evolution of the system is also apparent in the water vapor infrared imagery (GOES-18, Band 8, 6.19 µm) below. Cyclogenesis is rapid on the 19th as an impulse drops southward from Alaska.
GOES-18 Upper-level water vapor (Band 8, 6.19 µm) infrared imagery, 2010 UTC 17 November 2024 – 1310 UTC 20 November 2024 (mp4 animation)
GCOM-W1 overflew the strong system at 2112 UTC on 19 November, and the AMSR-2 winds (derived with GAASP software and available here) are shown below. Winds in excess of 64 knots (that is, hurricane-force) are shown west of Washington and Oregon.
AMSR-2 Sea-surface Winds, 2112 UTC (over the storm) and 2250 UTC (to the west of the storm) on 19 November 2024 (Click to enlarge)
SMAP winds (source, also available here), below, at 0101 UTC on 20 November, also show the strong winds with this potent system.
SMAP winds at 0105 UTC on 20 November 2024 (Click to enlarge)
Metop-B and Metop-C both carry the Advanced Scatterometer (ASCAT), and winds from those two satellites above this system are shown below. As with the other microwave-derived windspeeds shown above, the strong winds separate from the center and also with wind features to the south and to the northeast of the center are prominent.
ASCAT observations at 1810 UTC (Metop-B), 1907 UTC (Metop-C) on 19 November and 0451 (Metop-C) and 0533 (Metop-B) UTC on 20 November 2024 (Click to enlarge)
MetopC ASCAT winds are also in AWIPS, and the toggle below shows the fields overlain on top of Band 13 clean window infrared imagery. Two of the plots show all the ASCAT wind barbs; this allows a user to see at a glance the wind distributions. For more information on ASCAT winds, click here.
MetopC ASCAT Winds, 0431 and 0601 UTC on 20 November 2024 (Click to enlarge)
VIIRS Day Night Band visible (0.7 µm) imagery, 0934 and 0958 UTC on 20 November 2024, along with buoy observations (Click to enlarge)
What were near-shore buoys showing? The toggle below (using plots from this website) shows observations at Buoy 46132 (South Brooks), 46206 (La Perouse Bank), 46087 (at the mouth of the Strait of Juan de Fuca), 46041 (Cape Elizabeth), 46029 (Columbia River Bar) (This figure shows the locations of most of the buoys, you can also see the locations here). The buoys showed wind gusts in excess of 50 knots, and sustained winds close to 35 knots.
Time Series plots of winds speeds, gusts and pressure at different locations along the west coast. (Click to enlarge)
Buoy 46005, at 46oN, 131oW, showed a pressure near 28″ of mercury (near 945 mb) and gusts exceeding 60 knots before failing.
Time Series plot of wind speed and gusts and surface pressure (click to enlarge)
GOES-18 Mid-level Water Vapor (6.9 µm) images with hourly plots of Fixed Buoy reports, from 1606 UTC on 19th November to 0201 UTC on 20th November (courtesy Scott Bachmeier, CIMSS) [click to play MP4 animation]
A closer view of GOES-18 Water Vapor images (above) revealed the distinct circulation associated with this rapidly intensifying low — whose center passed near Buoy 46005 (which recorded a wind gust of 64 knots at 2120 UTC, after which it stopped reporting).
NOAA-21 and NOAA-20 VIIRS Day/Night Band images that included a plot of the final 2100 UTC Buoy 46005 observation (below) showed the center of the low passing just west of the buoy.
NOAA-21 and NOAA-20 (mislabeled as NPP) VIIRS Day/Night Band (0.7 µm) images, with plot of Buoy 46005 data (courtesy Scott Bachmeier, CIMSS) [click to enlarge]


