
GOES-17 “Red” Visible (0.64 µm), Mid-level Water Vapor (6.9 µm) and Air Mass RGB images [click to play animation | MP4]
A toggle between Suomi NPP VIIRS Visible (0.64 µm) and Infrared Window (11.45 µm) images (below) showed the storm at 2228 UTC.
![]() ![]() |
|
Low pressure over the Gulf of Alaska
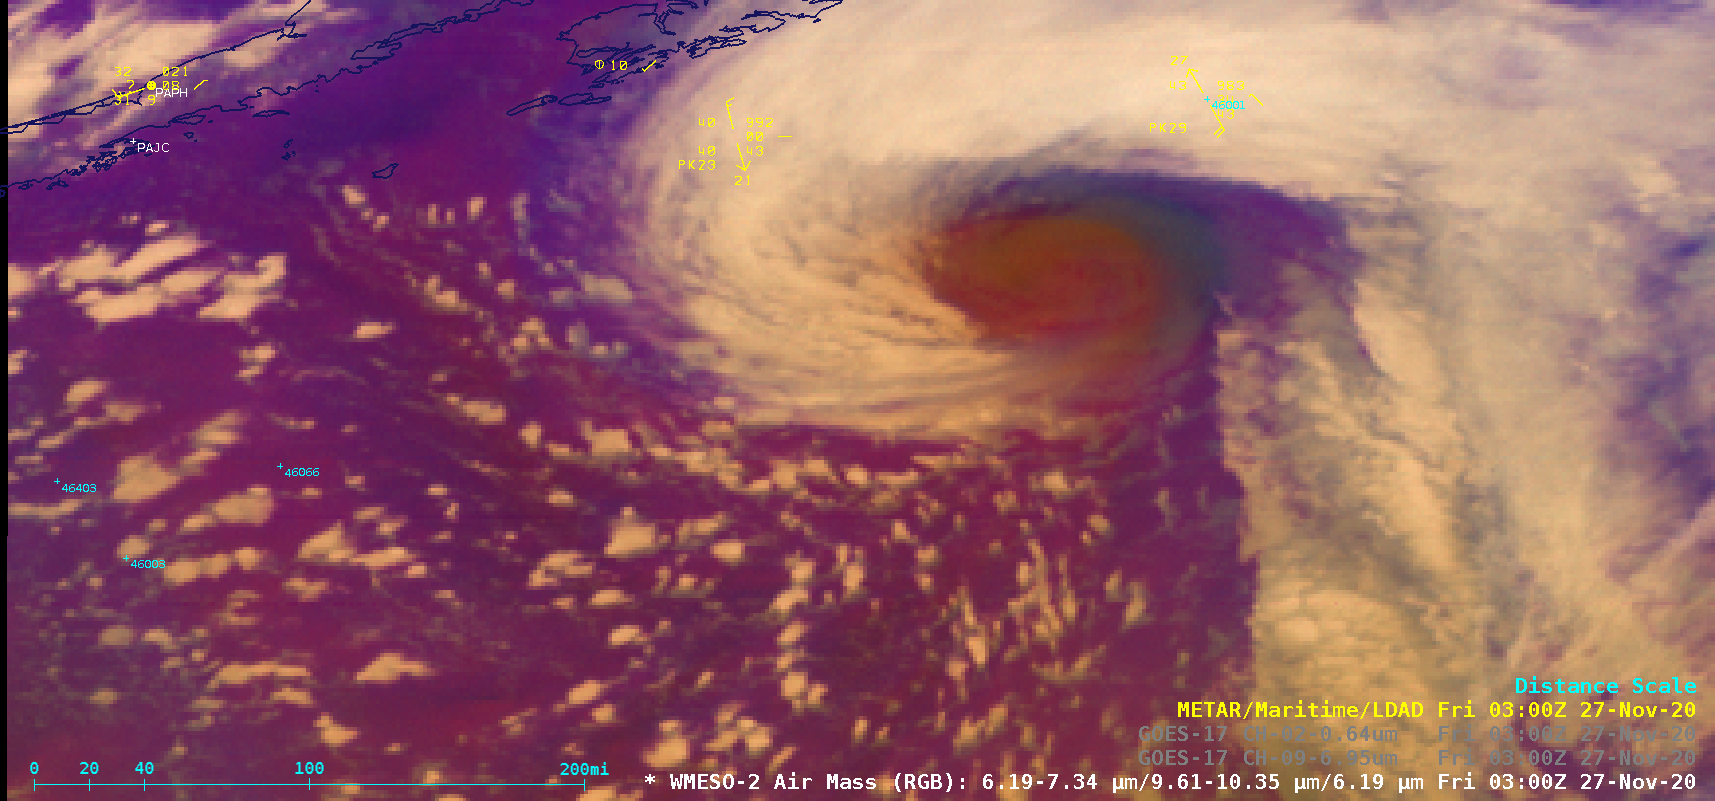
November 26th, 2020 | Scott Bachmeier![]() GOES-17 “Red” Visible (0.64 µm), Mid-level Water Vapor (6.9 µm) and Air Mass RGB images [click to play animation | MP4] A toggle between Suomi NPP VIIRS Visible (0.64 µm) and Infrared Window (11.45 µm) images (below) showed the storm at 2228 UTC. Mesoscale snowband effects on temperature in KansasNovember 25th, 2020 | Scott LindstromAn extratropical cyclone deposited a mesoscale snowband — a few counties wide — in south-central Kansas late in the day on 24 November 2020 (Click here to see the storm at 0300 UTC on 25 November). As is often the case, such bands have profound impacts on surface temperatures. It is therefore important to monitor their precise location. The animation above shows the Day Snow Cloud RGB; its use of the 1.61 µm band allows the RGB to distinguish easily between snow and clouds, both of which are bright in the visible, as shown in the image below, courtesy Mike Umscheid, NWS ICT, that shows the snow band and the similarly reflective clouds to the east. (Imagery created at this nifty website!) ![]() GOES-16 Visible imagery, 25 November 2020, and morning snow depths over central Kansas (Click to enlarge; imagery courtesy Mike Umscheid, NWS ICT) GOES-16 Land Surface Temperatures (a baseline level 2 product) shows the effect of the snow on skin temperature, below. Shortly after sunrise, temperatures over the snowband are several degrees (Fahrenheit) cooler, as expected with clear skies and a fresh snowpack. (Warm lakes also shine through!) Bare land in Kansas warms quickly, with Skin Temperatures reaching into the upper 60s and 70s by 1900 UTC, whereas the snow band remains in the 30s! A comparison of GOES-R Land Surface Temperatures with METAR observations, below, underscores the notion that the skin temperature can be much warmer than the temperature 1.5 m above the ground, where METAR thermometers (or thermistors) measure the air temperature. The warmest METAR temperature at 2000 UTC is 57º F at Scott City, KS. Land Surface Temperatures there are in the mid-60s, with 70 just to the northeast. Note that the default bounds of the colorbar range in Land Surface Temperature have been changed. Default values range from -10º to 110º F; values shown above range from 10º to 80º F. The toggle below compares the two, at 1501 UTC. ![]() GOES-16 Land Surface Temperature with default color bounds (-10 to 100 F) and more useful bounds for this day (10 to 80 F) (Click to enlarge) Towards sunset, the Day Snow Fog RGB (or any RGB that relies on reflectances from visible, near-Infrared or infrared channels) can become dim. In that event, an AWIPS user can edit the Composite Options, reducing the upper bounds of all three RGB channels o that the image retains brightness and utility (in this case upper bounds were reduced for Red from 100 to 60; for Green from 70 to 40; for Blue from 30 to 19). Cyclone Nivar makes landfall in IndiaNovember 25th, 2020 | Scott BachmeierUS Space Force EWS-G1 Infrared (10.7 µm) images [click to play animation | MP4] EUMETSAT Meteosat-8 Infrared Window (10.8 µm) images with contours of deep-layer wind shear from the CIMSS Tropical Cyclones site (below) indicated that Nivar was moving through an environment of low shear (and over warm water) — factors favorable for the storm maintaining its intensity. Shear vortices over the East Pacific OceanNovember 24th, 2020 | Scott Bachmeier
![]() GOES-17 Upper-level Water Vapor (6.2 µm) and Air Mass RGB images [click to play animation | MP4] GOES-17 Water Vapor images with isotachs of NAM40 model maximum wind speed (below) showed that these vortices were forming within a very tight gradient in wind velocity (which existed just to the left of a southward-moving polar jet streak) — so speed shear was a mechanism playing a role. ![]() GOES-17 Upper-level Water Vapor (6.2 µm) images, with isotachs of NAM40 model maximum wind speed [click to enlarge] ![]() GOES-17 Air Mass RGB images, with and without contours of NAM40 model PV1.5 pressure [click to play animation | MP4] |
|