Explosive eruption of the Hayli Gubbi volcano in Ethiopia

Meteosat-10 False Color RGB images, from 0730-1130 UTC on 23 November [click to play MP4 animation]
A EUMETSAT Meteosat-10 False Color RGB product from the NOAA/CIMSS Volcanic Cloud Monitoring site (above) showed the signature of a large volcanic cloud following the explosive eruption of Hayli Gubbi in Ethiopia, which began around 0830 UTC on 23 November 2025. Since this False Color RGB product uses the 8.7 µm spectral band (which is sensitive to SO2 absorption) in its green component, shades of green exhibited by much of the larger eastward-moving cloud indicated a mixture of volcanic ash and SO2 — while the shades of pink exhibited by the smaller northwest-moving cloud indicated that it was composed primarily of ash.
A radiometrically retrieved Meteosat-10 Volcanic Ash Height product (below) indicated that maximum ash heights associated with the larger eastward-moving cloud were in the 18-20 km range — while the smaller northwest-moving cloud had ash heights generally in the 3-5 km range.
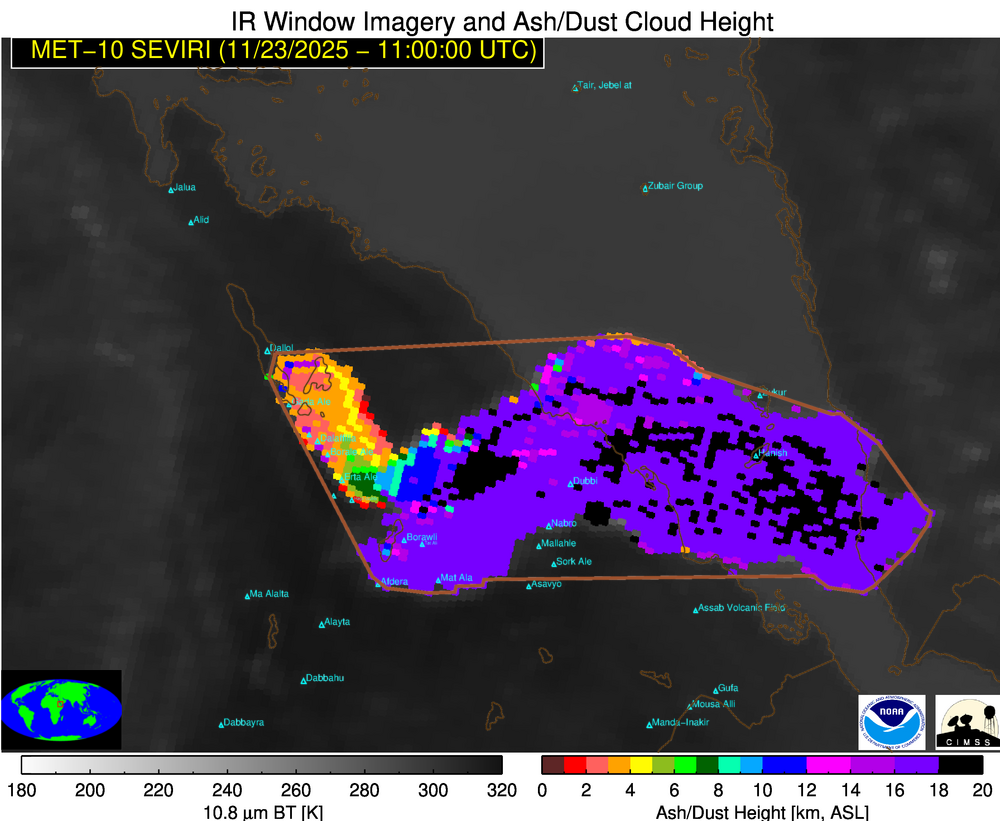
Meteosat-10 Ash Height derived product, from 0730-1130 UTC on 23 November [click to play MP4 animation]
A Volcanic Ash Height product derived using higher-spatial-resolution VIIRS data from NOAA-21, Suomi-NPP and NOAA-20 (below) indicated that maximum ash heights of the larger cloud were in the 16-18 km range — which were closer to the height values listed in volcanic ash advisories (FL450 = 13.7 km; FL500 = 15.2 km) from the Toulouse VAAC.
Ash Height derived product using VIIRS data from NOAA-21, Suomi-NPP and NOAA-20 — from 1018-1112 UTC on 23 November
A Meteosat-10 Ash Loading derived product (below) indicated that loading was quite high within the larger eastward-moving cloud, and generally low to moderate within the smaller northwest-moving cloud.

Meteosat-10 Ash Loading derived product, from 0730-1130 UTC on 23 November [click to play MP4 animation]
A Meteosat-10 Ash Effective Radius product (below) depicted the presence of larger ash particles within the higher-altitude cloud, in contrast to smaller ash particles within the lower-altitude cloud.

Meteosat-10 Ash Effective Radius derived product, from 0730-1130 UTC on 23 November [click to play MP4 animation]
A toggle between Low-level (700-850 hPa) and High-level (200-700 hPa) Deep Layer Mean Wind or “Environmental Steering Product” (source) at 0900 UTC on 23 November (below) showed lower-tropospheric southeasterly winds and upper-tropospheric westerly winds that were responsible for the transport of the 2 different volcanic clouds.
Low-level (700-850 hPa) and High-level (200-700 hPa) Deep Layer Mean Wind at 0900 UTC on 23 November (Hayli Gubbi is located at 13.5 N latitude / 40.75 E longitude, denoted by the cyan star symbol)
===== 24 November Update =====

10-minute Himawari-8 Air Mass RGB images from 0900-2100 UTC on 24 November [click to play MP4 animation | animated GIF]
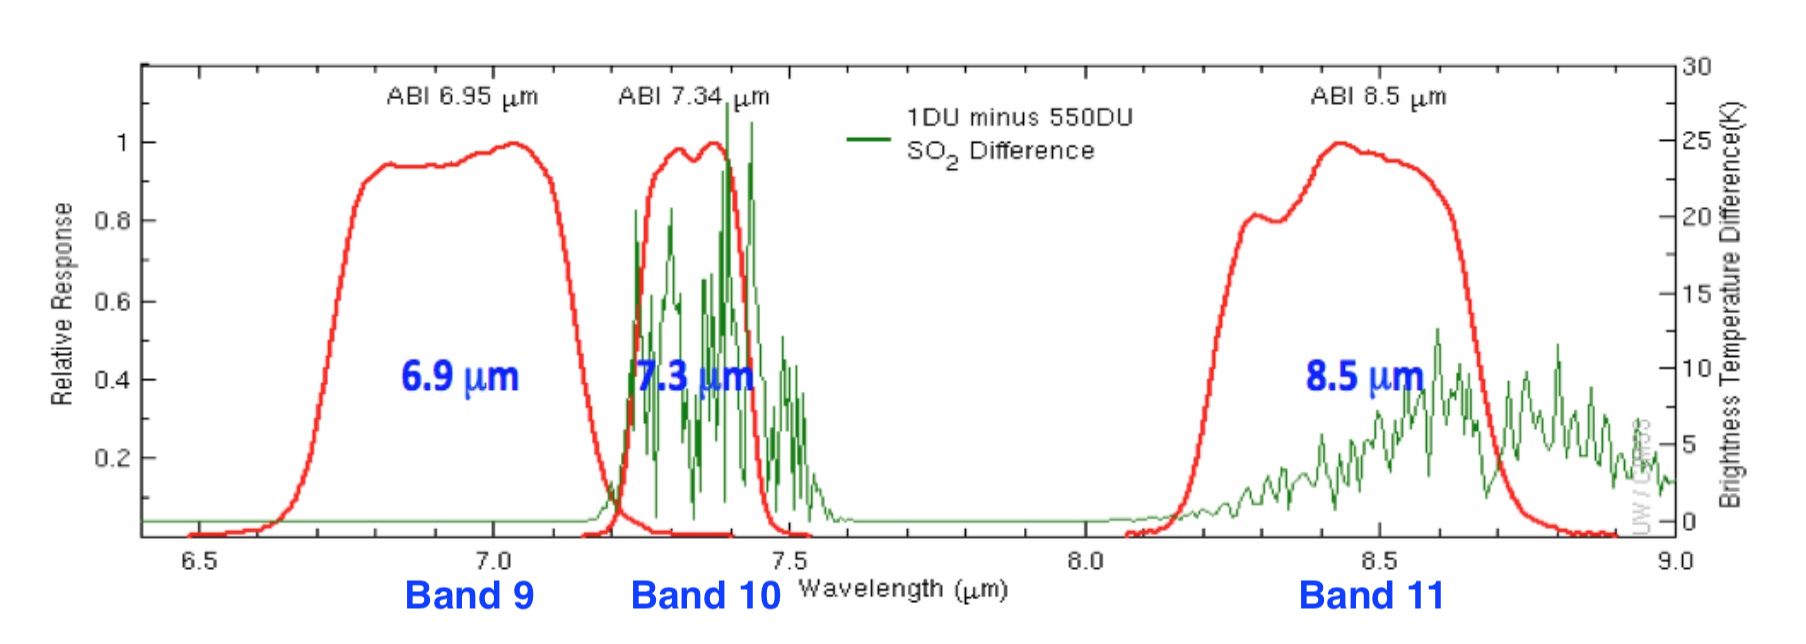
10-minute Full Disk scan JMA Himawari-8 Air Mass RGB images created using Geo2Grid (above) showed a signature of the SO2-rich volcanic cloud as it emerged from over the northern Arabian Sea and moved northeast across parts of Pakistan, India, Nepal and finally the Tibet region of southwestern China on 24 November (2130 UTC Toulouse VAAC final advisory). Since the red component of the Air Mass RGB uses the 7.3 µm spectral band — which is also sensitive to SO2 absorption — the Hayli Gubbi volcanic cloud appeared as brighter shades of magenta.
===== 26 November Update =====

GOES-18 Air Mass RGB images, from 0600 UTC on 26 November to 0000 UTC on 27 November[click to play MP4 animation | animated GIF]
The leading edge of the SO2-rich Hayli Gubbi volcanic cloud (brighter shades of magenta) eventually began to appear along the western limb of GOES-18 (GOES-West) Air Mass RGB images on 26 November (above), as the volcanic cloud started to move eastward across the North Pacific Ocean (east of Japan).