Category 5 Hurricane Melissa makes landfall on Jamaica
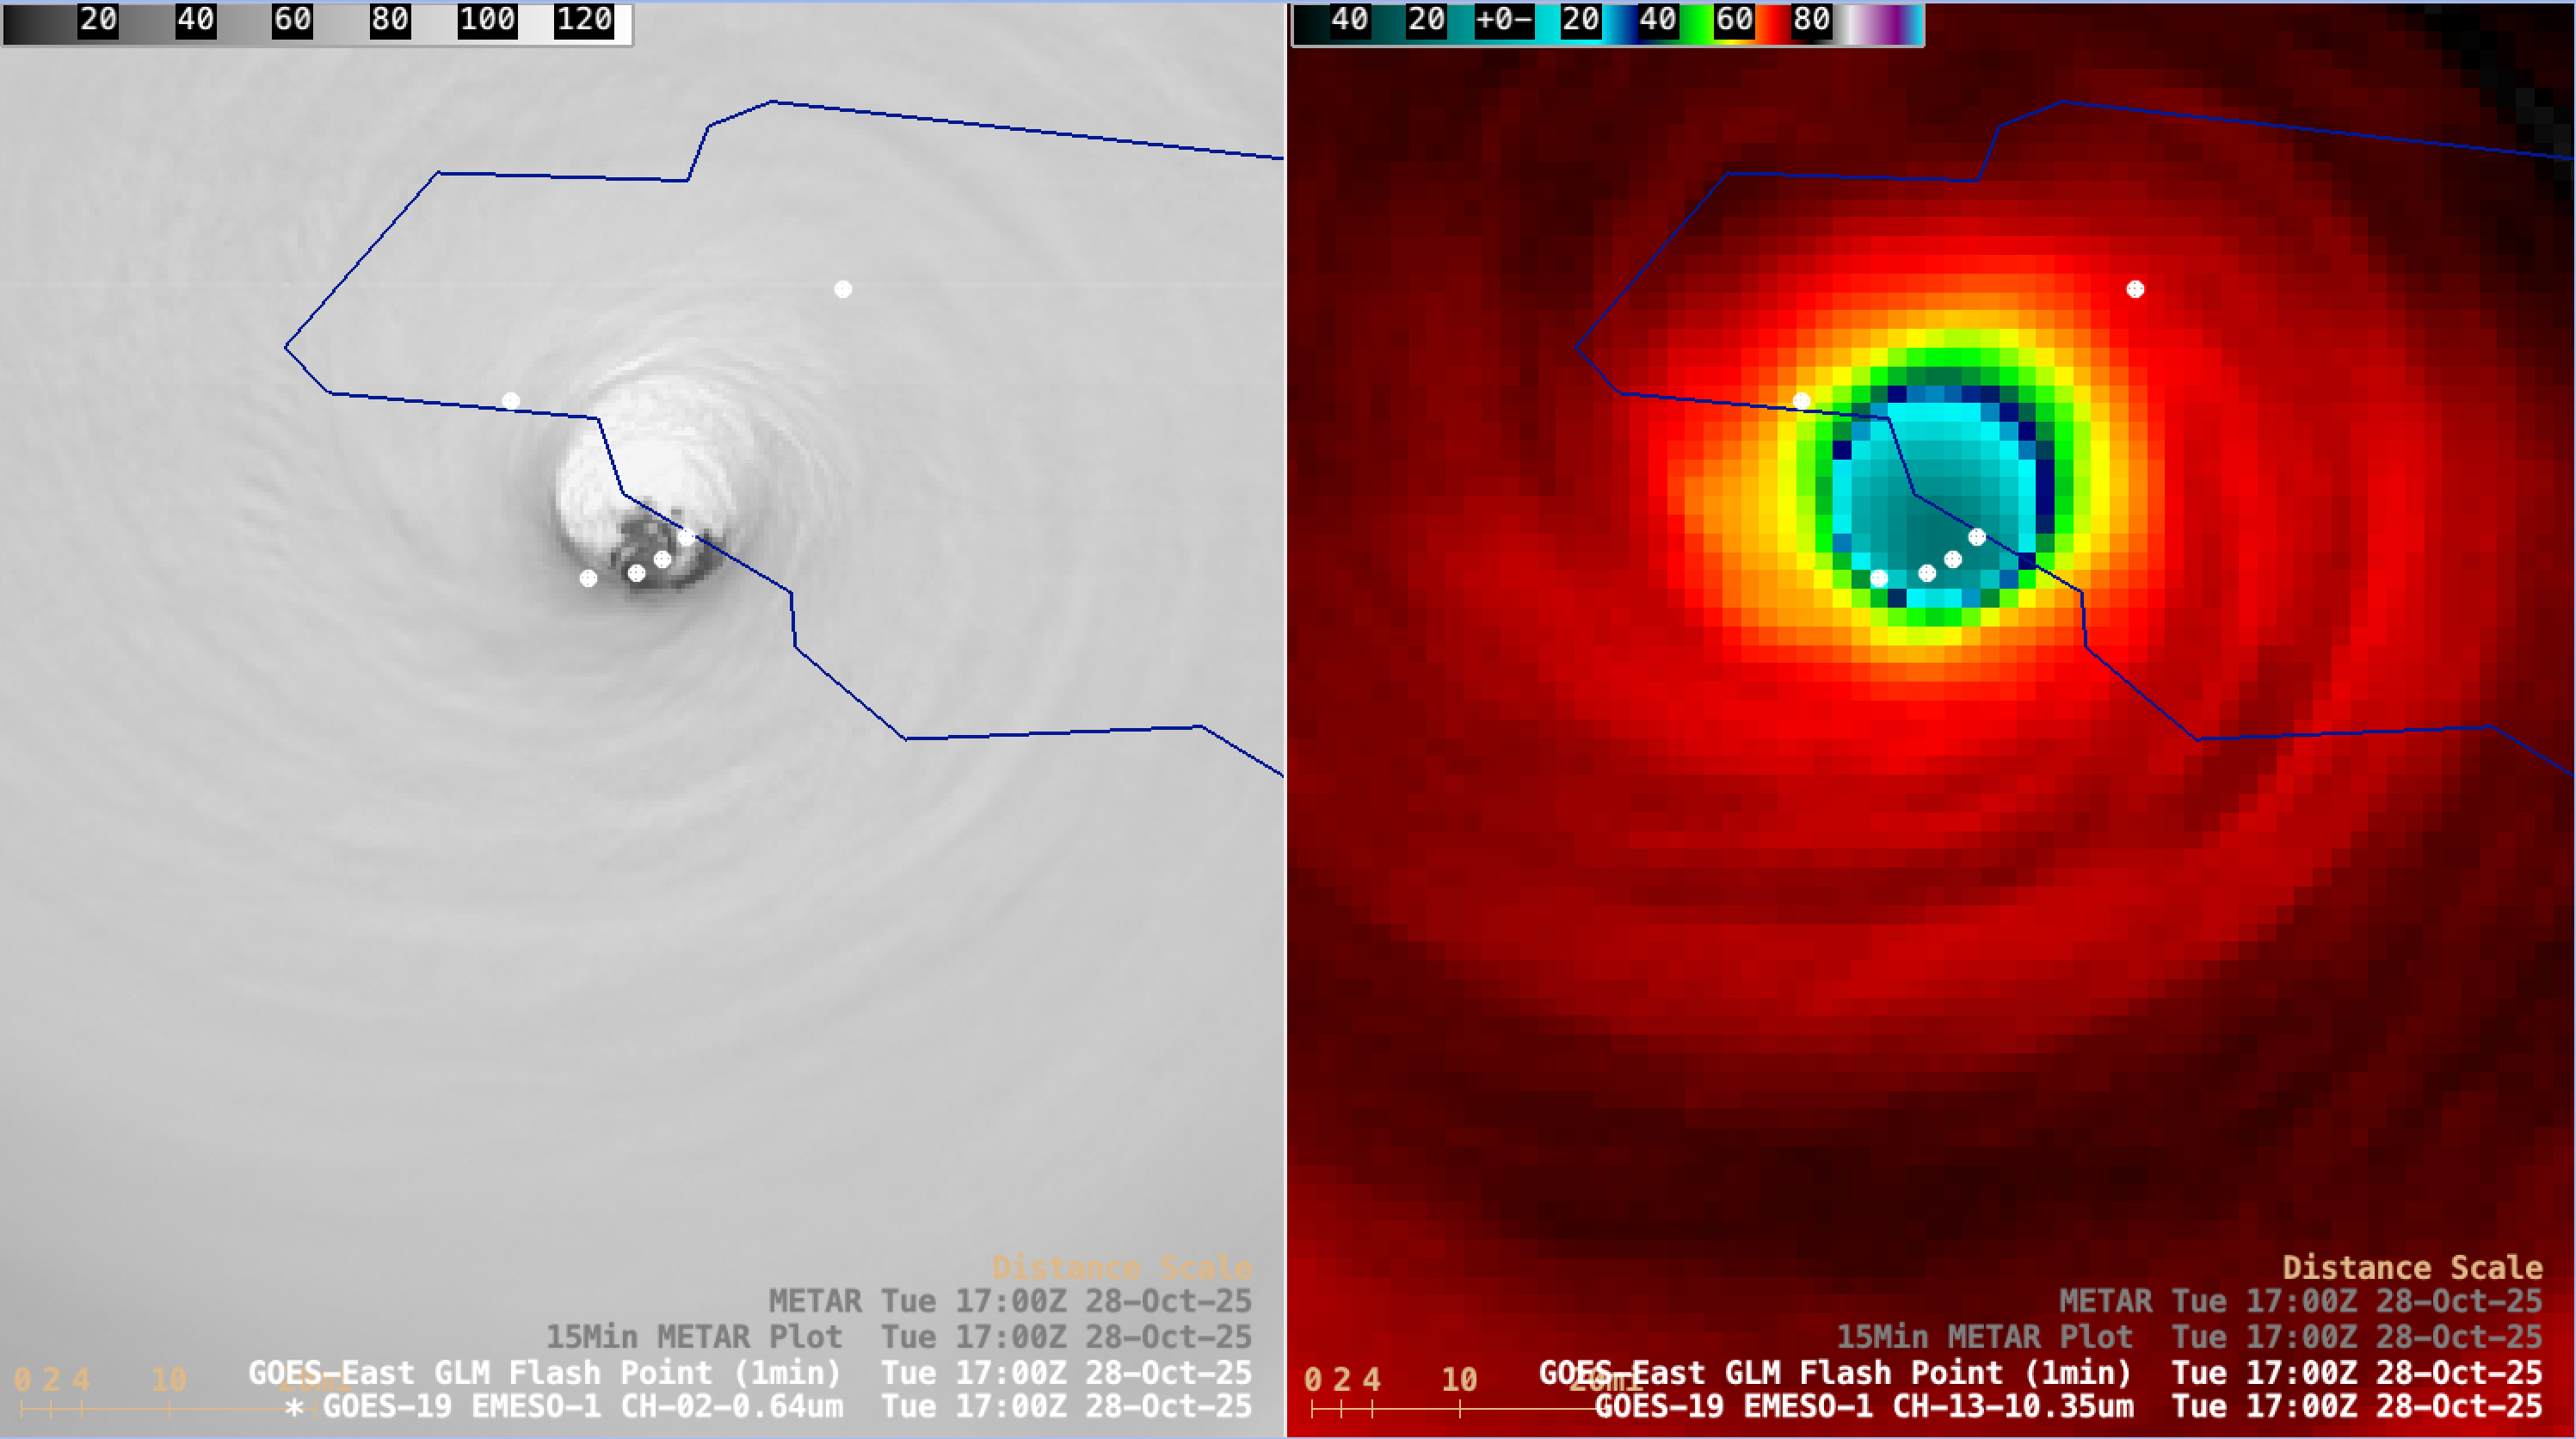
1-minute GOES-19 Visible images (left) and Infrared images (right) with plots of 1-minute GOES-19 GLM Flash Points (white dots), from 1131-1800 UTC on 28 October [click to play MP4 animation]
1-minute Mesoscale Domain Sector GOES-19 (GOES-East) Visible and Infrared images (above) showed Category 5 Hurricane Melissa as it made landfall along the far southwest coast of Jamaica around 1700 UTC on 28 October 2025. Low-altitude mesovortices were evident within the eye — and GLM Flash Points revealed abundant lightning activity within the inner eyewall region.
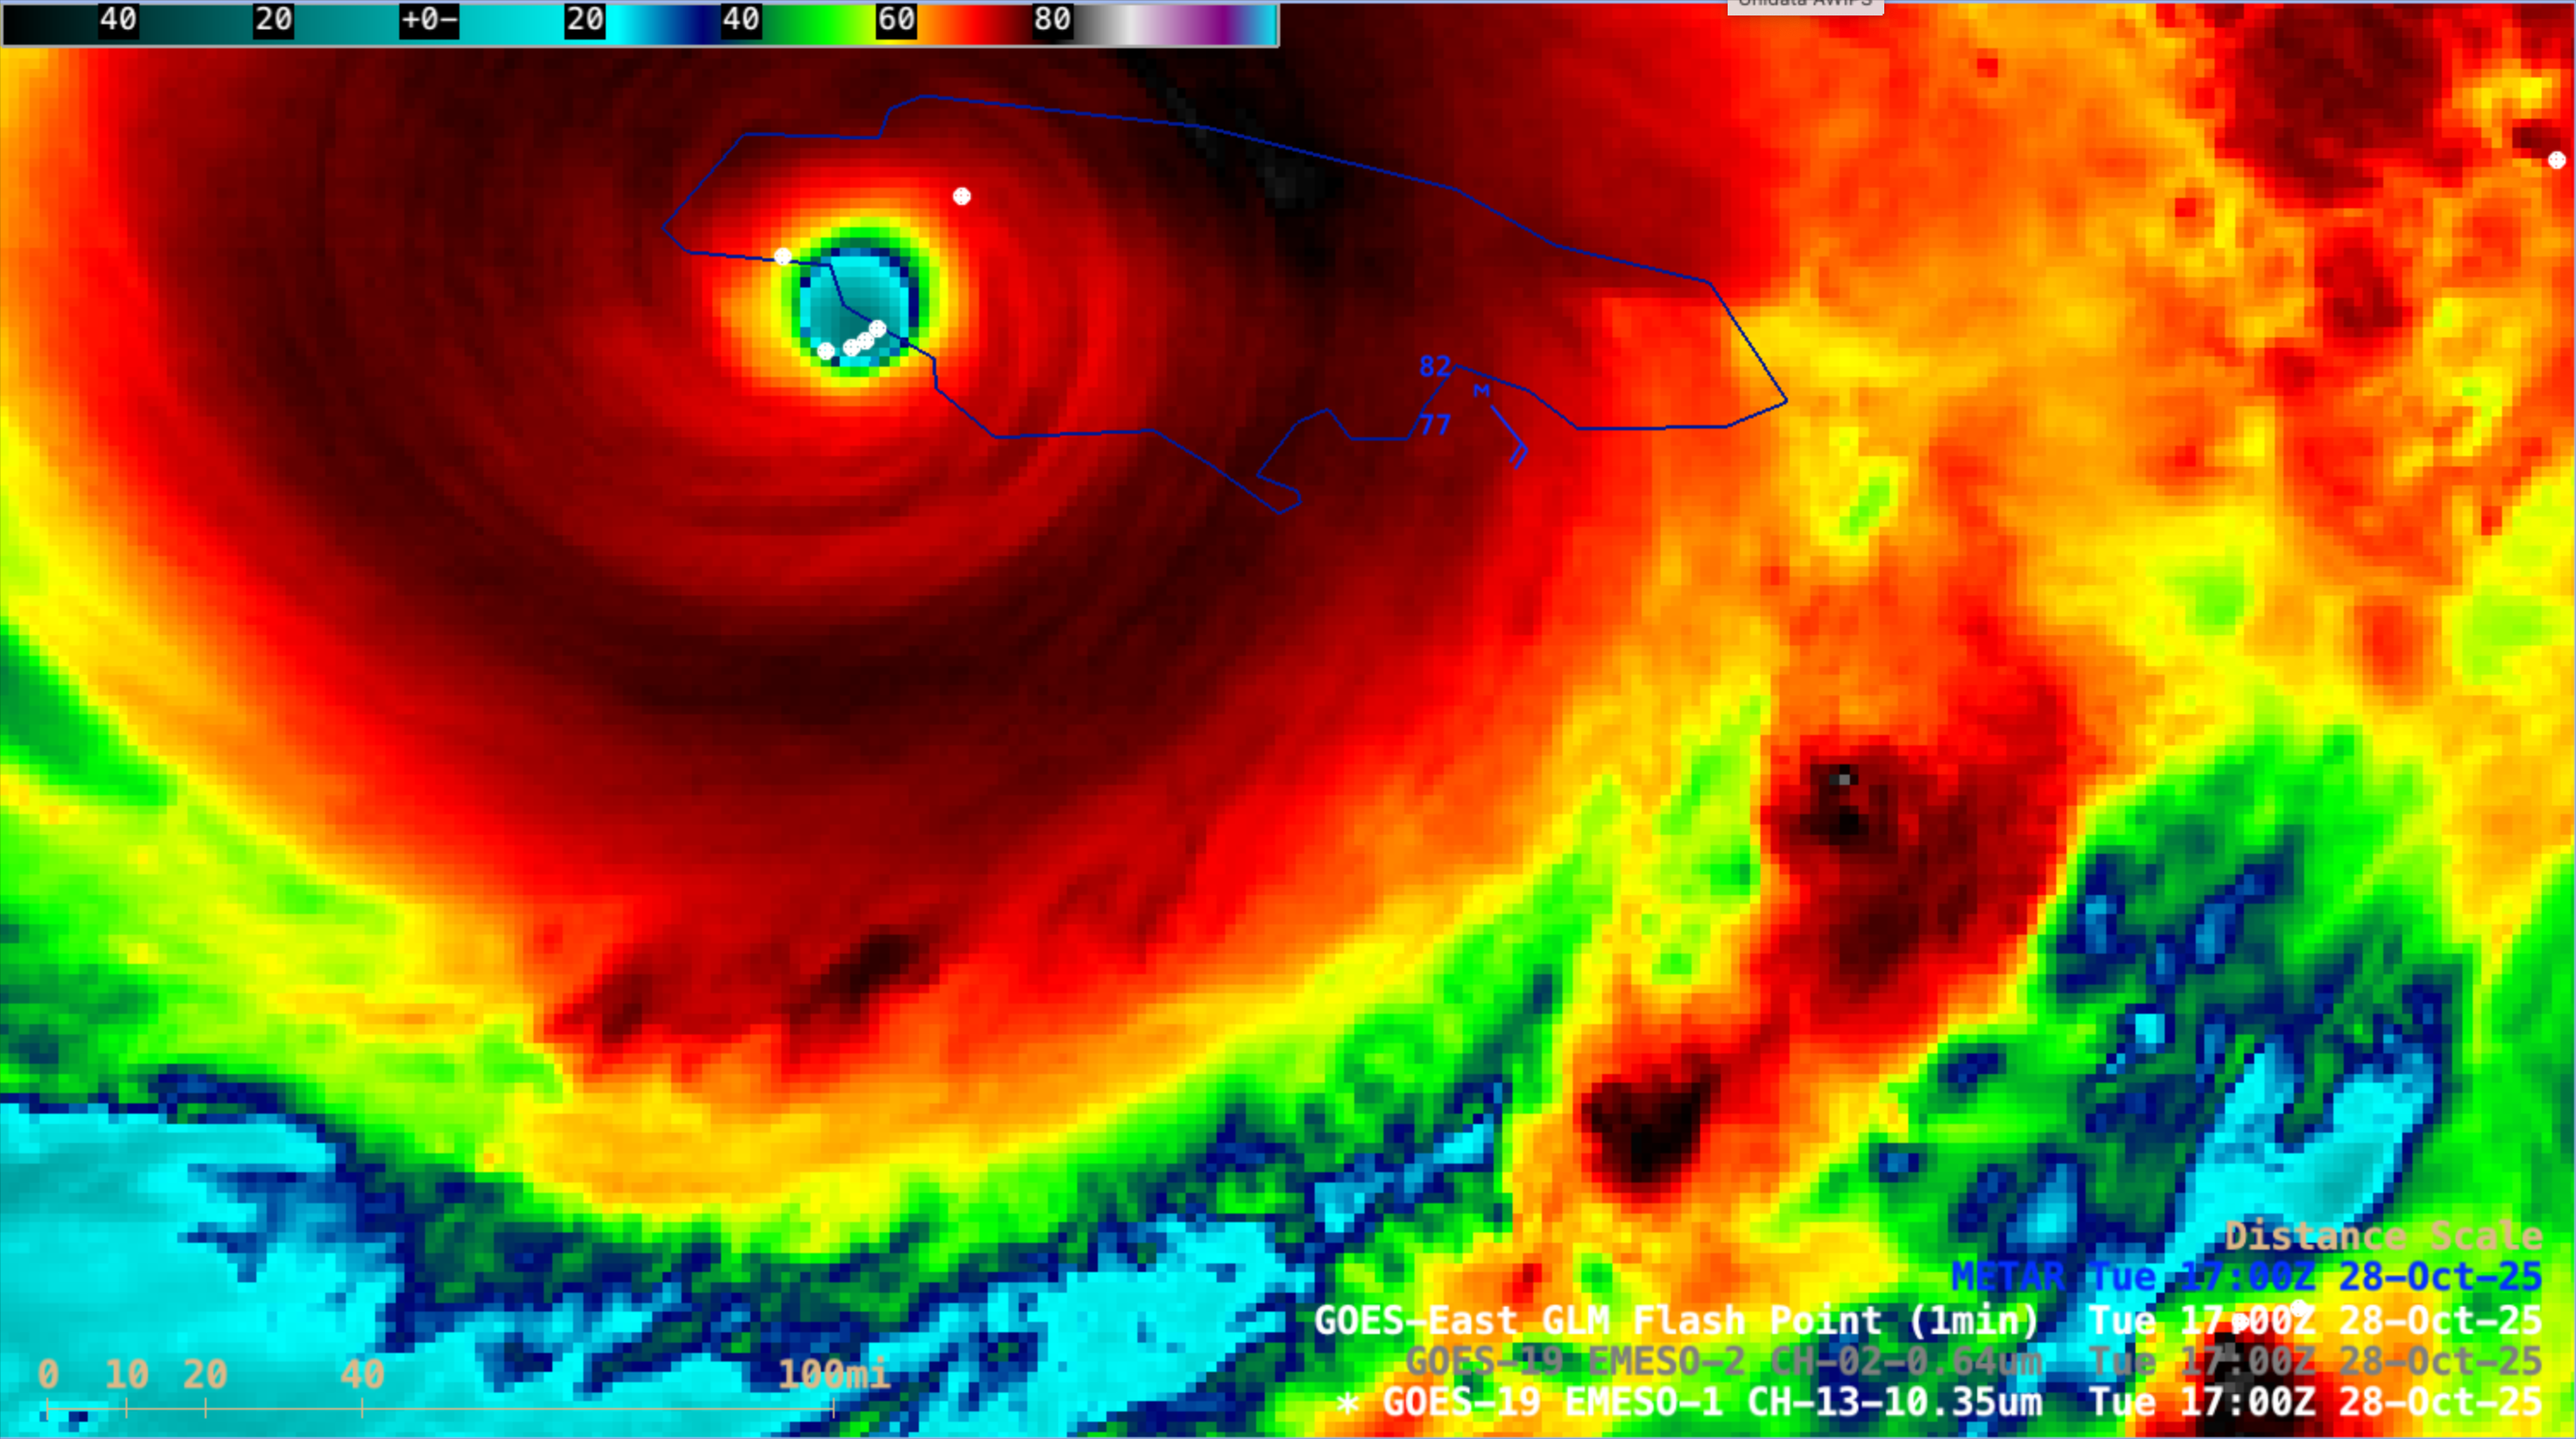
1-minute GOES-19 Infrared images displayed using RealEarth (below) indicated that the center of the eye of Melissa passed over White House, Jamaica during landfall — with the right-front quadrant of the inner eyewall (where wind damage and storm surge is often highest) passing over Black River.

1-minute GOES-19 Infrared images displayed with Google Maps labels of cities and roads, from 1500-2100 UTC on 28 October [click to play MP4 animation]
Shortly after Melissa made landfall, the eye quickly became cloud-filled as the hurricane moved inland and interacted with topography across the western part of Jamaica (below).

1-minute GOES-19 Visible images (left) and Topography+Visible images (right) with plots of GLM Flash Points, from 1451-1900 UTC on 28 October [click to play MP4 animation]
A larger-scale view of GOES-19 CIMSS True Color RGB images created using Geo2Grid (below) indicated that after landfall, the eye of Melissa remained cloud-filled as the hurricane finished crossing the island and eventually emerged over water north of Jamaica around 2100 UTC.

1-minute CIMSS True Color RGB images, from 1131-2159 UTC on 28 October (courtesy Dave Stettner, CIMSS) [click to play MP4 animation]
A larger-scale view of 1-minute GOES-19 Infrared images during the 5 hours leading up to landfall is shown below — which revealed a continual series of cloud-top gravity waves propagating radially outward from the eye of Melissa. The radius of hurricane-force winds appeared to be rather small, since surface wind speeds at the Kingston METAR site in eastern Jamaica were only in the 20-40 kt range during that time period.
1-minute GOES-19 Infrared images with plots of 1-minute GOES-19 GLM Flash Points, from 1401-1900 UTC on 28 October [click to play MP4 animation]
A GMI Microwave image (below) displayed the compact eye and eyewall of Melissa about 3 hours prior to landfall.
GMI Microwave image at 1406 UTC on 28 October
Just prior to landfall, Melissa was moving through an environment characterized by fairly low values of deep-layer wind shear (below).
GOES-19 Infrared images, with an overlay of contours and streamlines of deep-layer wind shear at 1600 UTC on 28 October
A Synthetic Aperture Radar (SAR) image (source) at 1110 UTC (below) retrieved a maximum wind velocity value of 143 kts in the NW quadrant of Melissa.

RADARSAT-2 Synthetic Aperture Radar (SAR) image at 1110 UTC on 28 October [click to enlarge]
It is noteworthy that the Advanced Dvorak Technique (ADT) satellite-derived intensity estimate peaked at 185 kts for Melissa (below) — which according to the developer at CIMSS is the highest value on record for any tropical cyclone since the ADT was implemented.
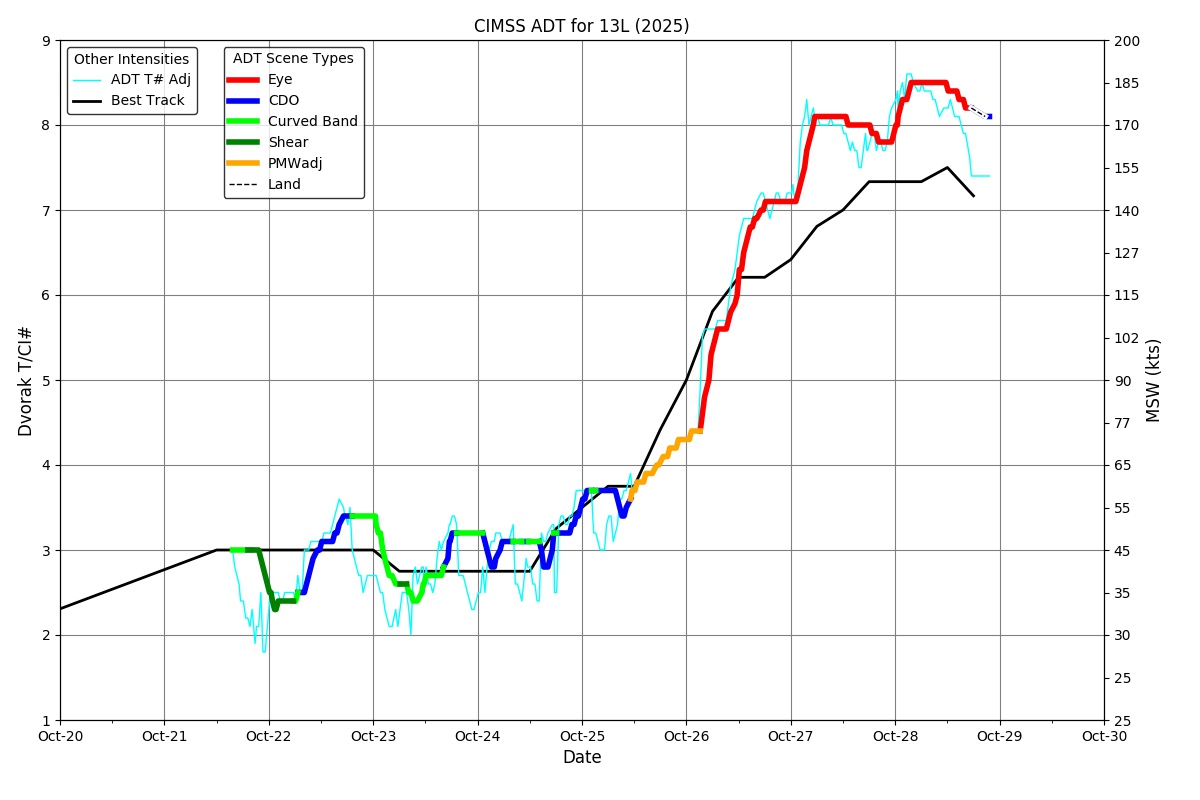
Plot of Advanced Dvorak Technique (ADT) values for Melissa [click to enlarge]
NOTE: The National Hurricane Center published its post-analysis and Tropical Cyclone Report for Melissa on 25 February 2026.

Dropsonde released into Hurricane Melissa at 1350 UTC on 28 October [click to enlarge]