Hurricane Erin reaches Category 5 intensity north of the Leeward Islands
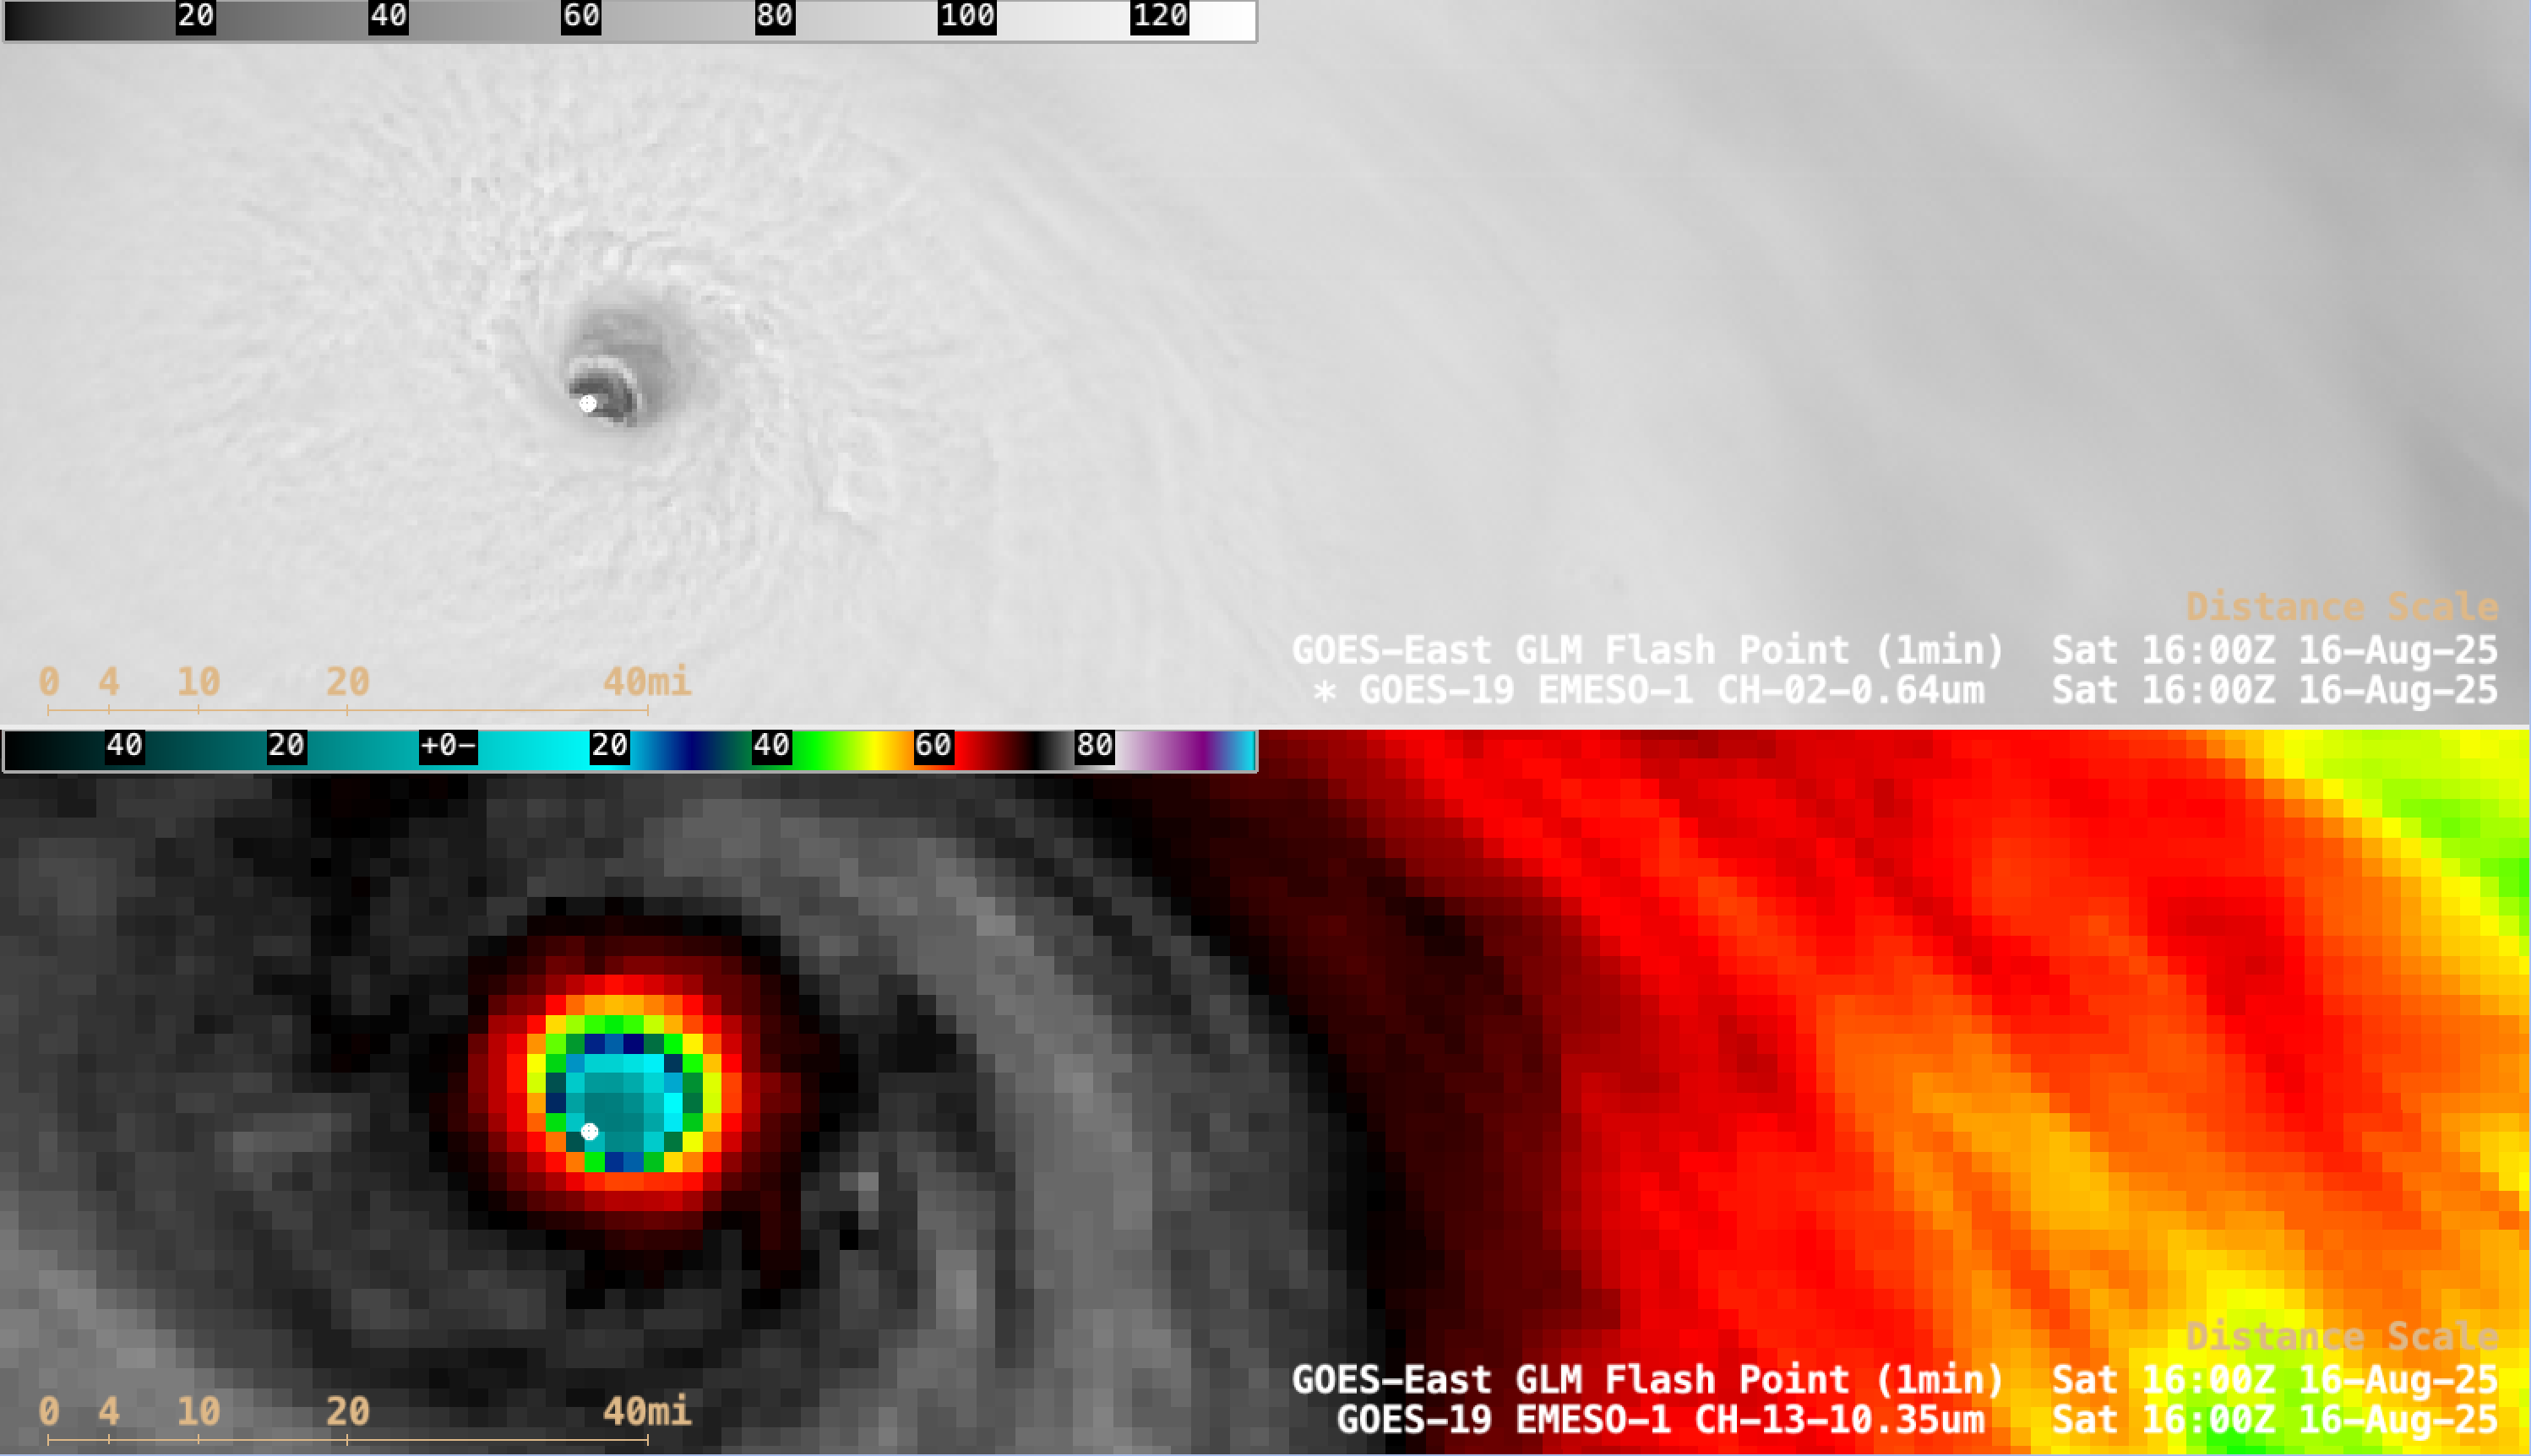
1-minute GOES-19 Visible and Infrared images with plots of GOES-19 GLM Flash Points, from 1000-1700 UTC on 16 August [click to play MP4 animation]
A closer view of 1-minute GOES-19 Visible imagery (below) revealed the presence of low-altitude mesovortices within the eye. A pinhole eye and mesovortices within the eye are 2 satellite-observed characteristics often associated with intense Category 5 tropical cyclones. In addition, Erin was moving though an environment of weak deep-layer wind shear and traversing warm sea surface temperatures — 2 factors that favored intensification.
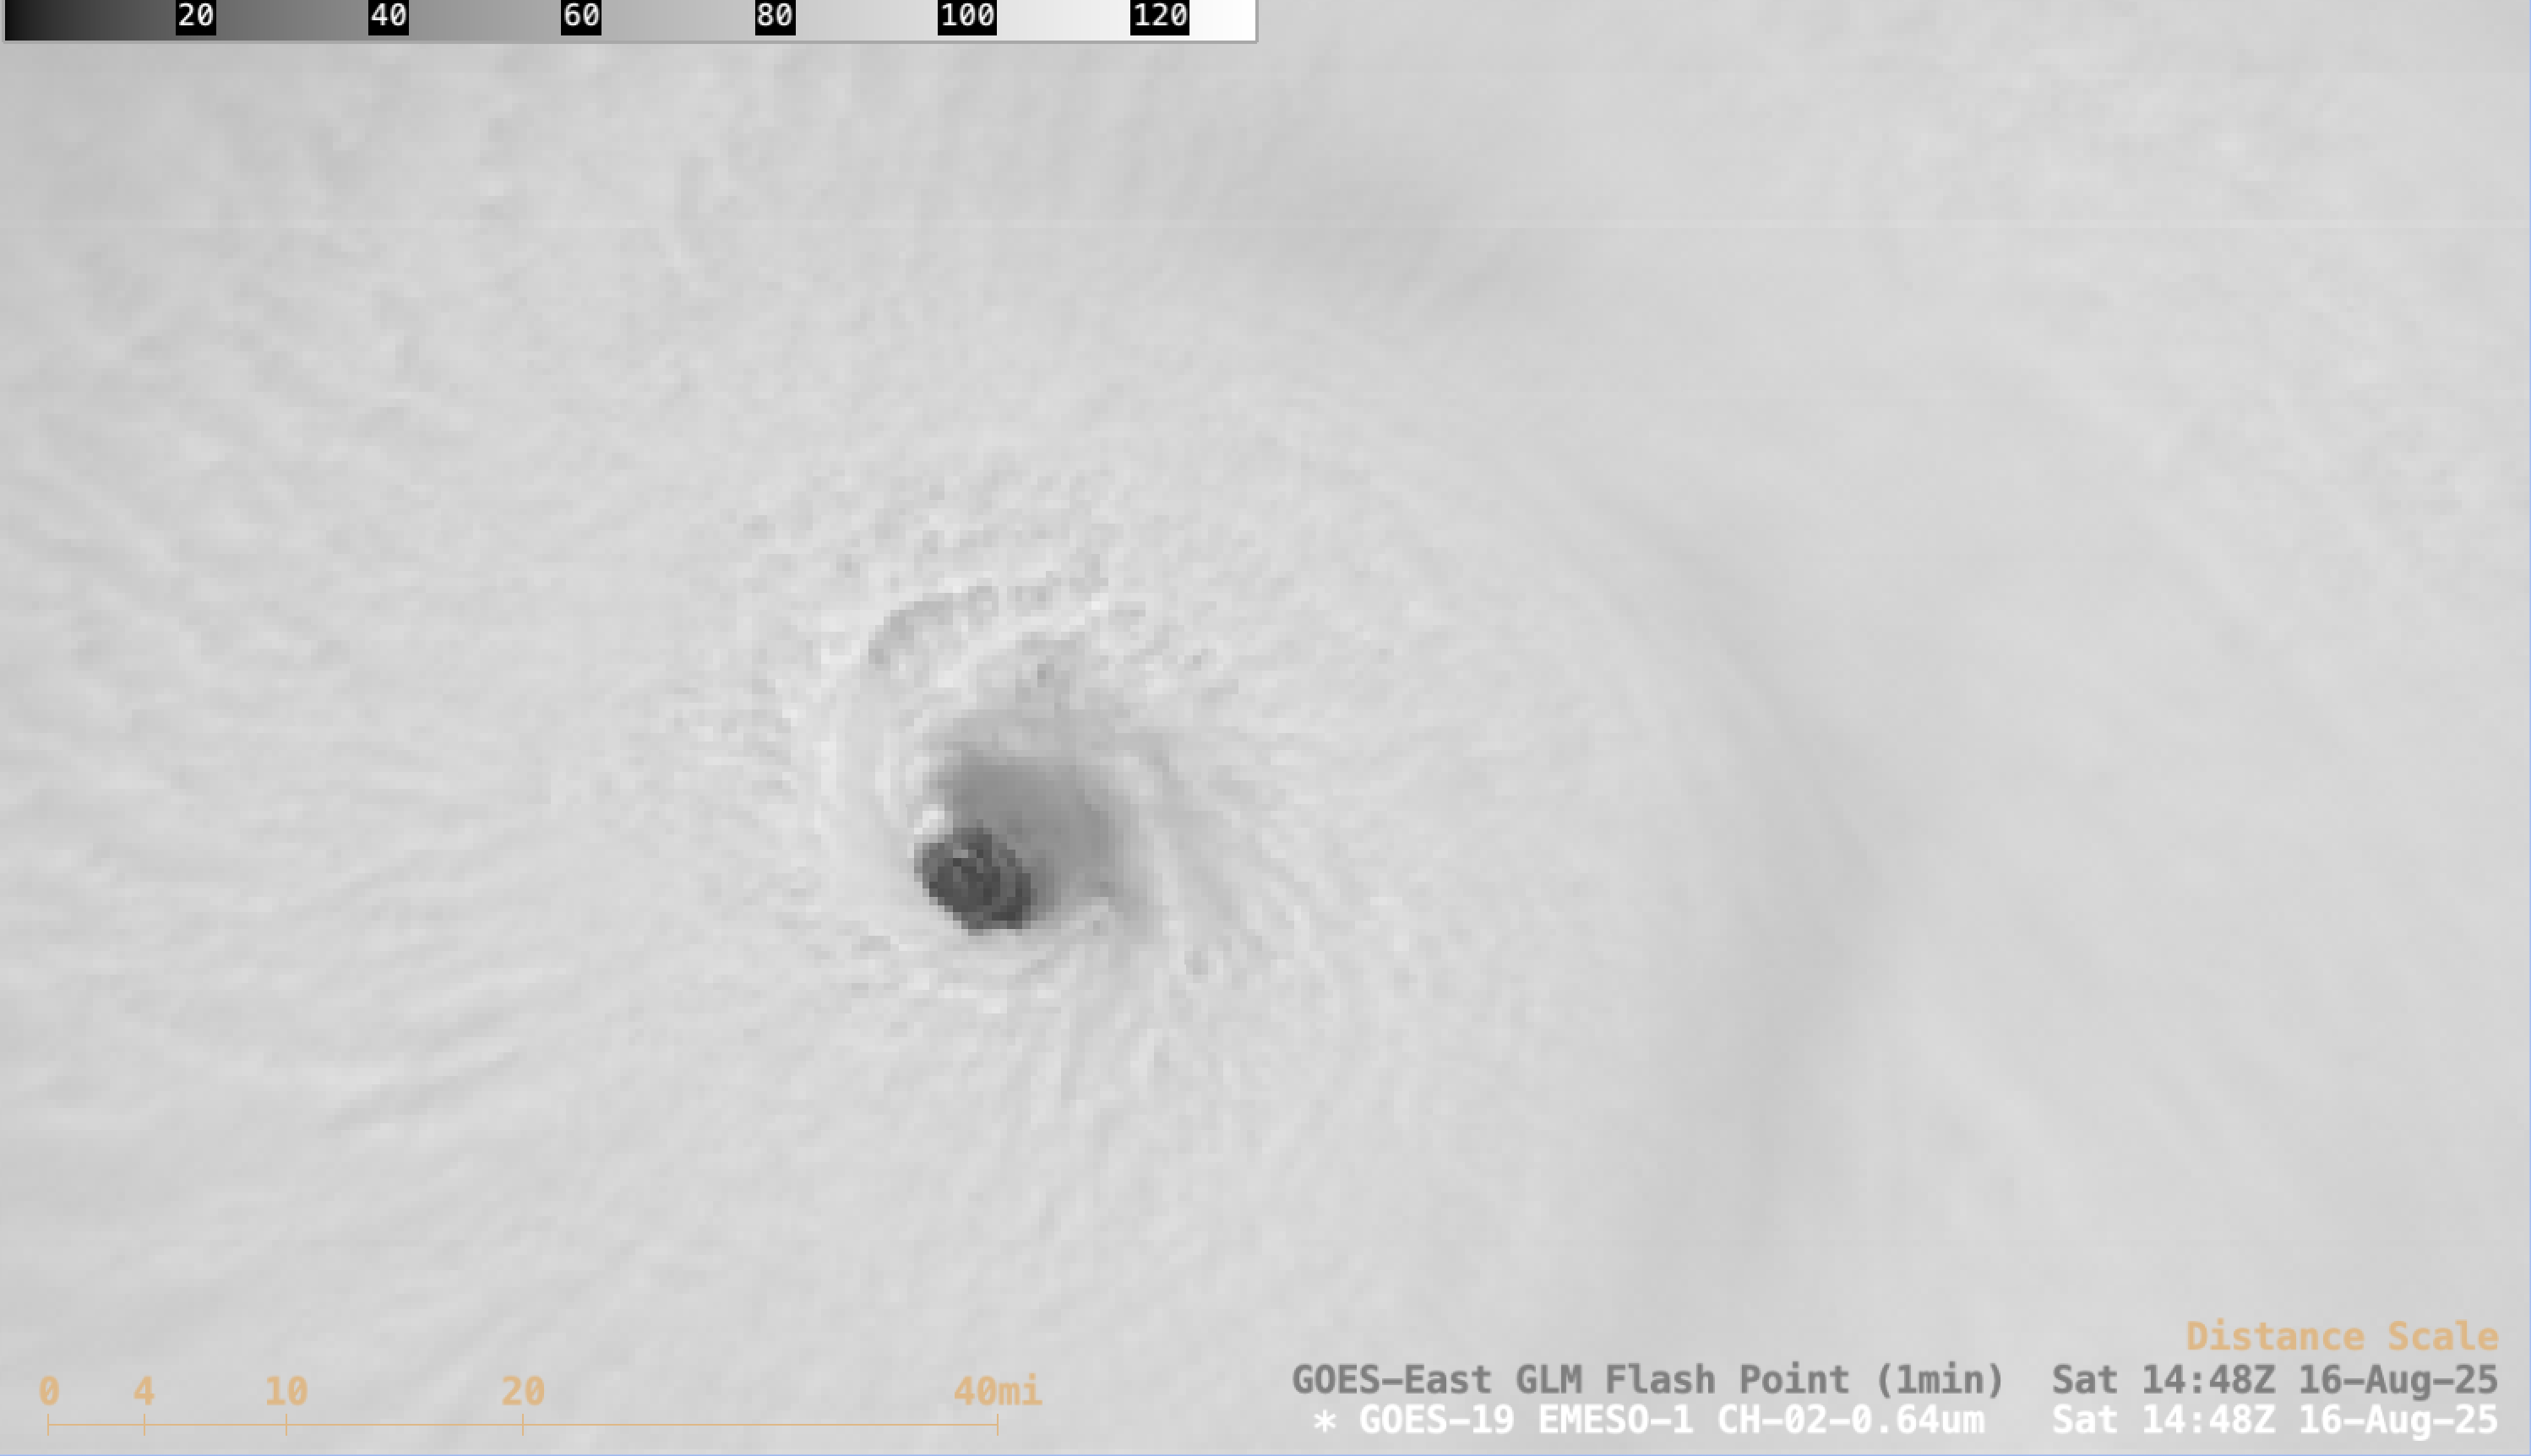
1-minute GOES-19 Visible images, from 1200-1900 UTC on 16 August [click to play MP4 animation]
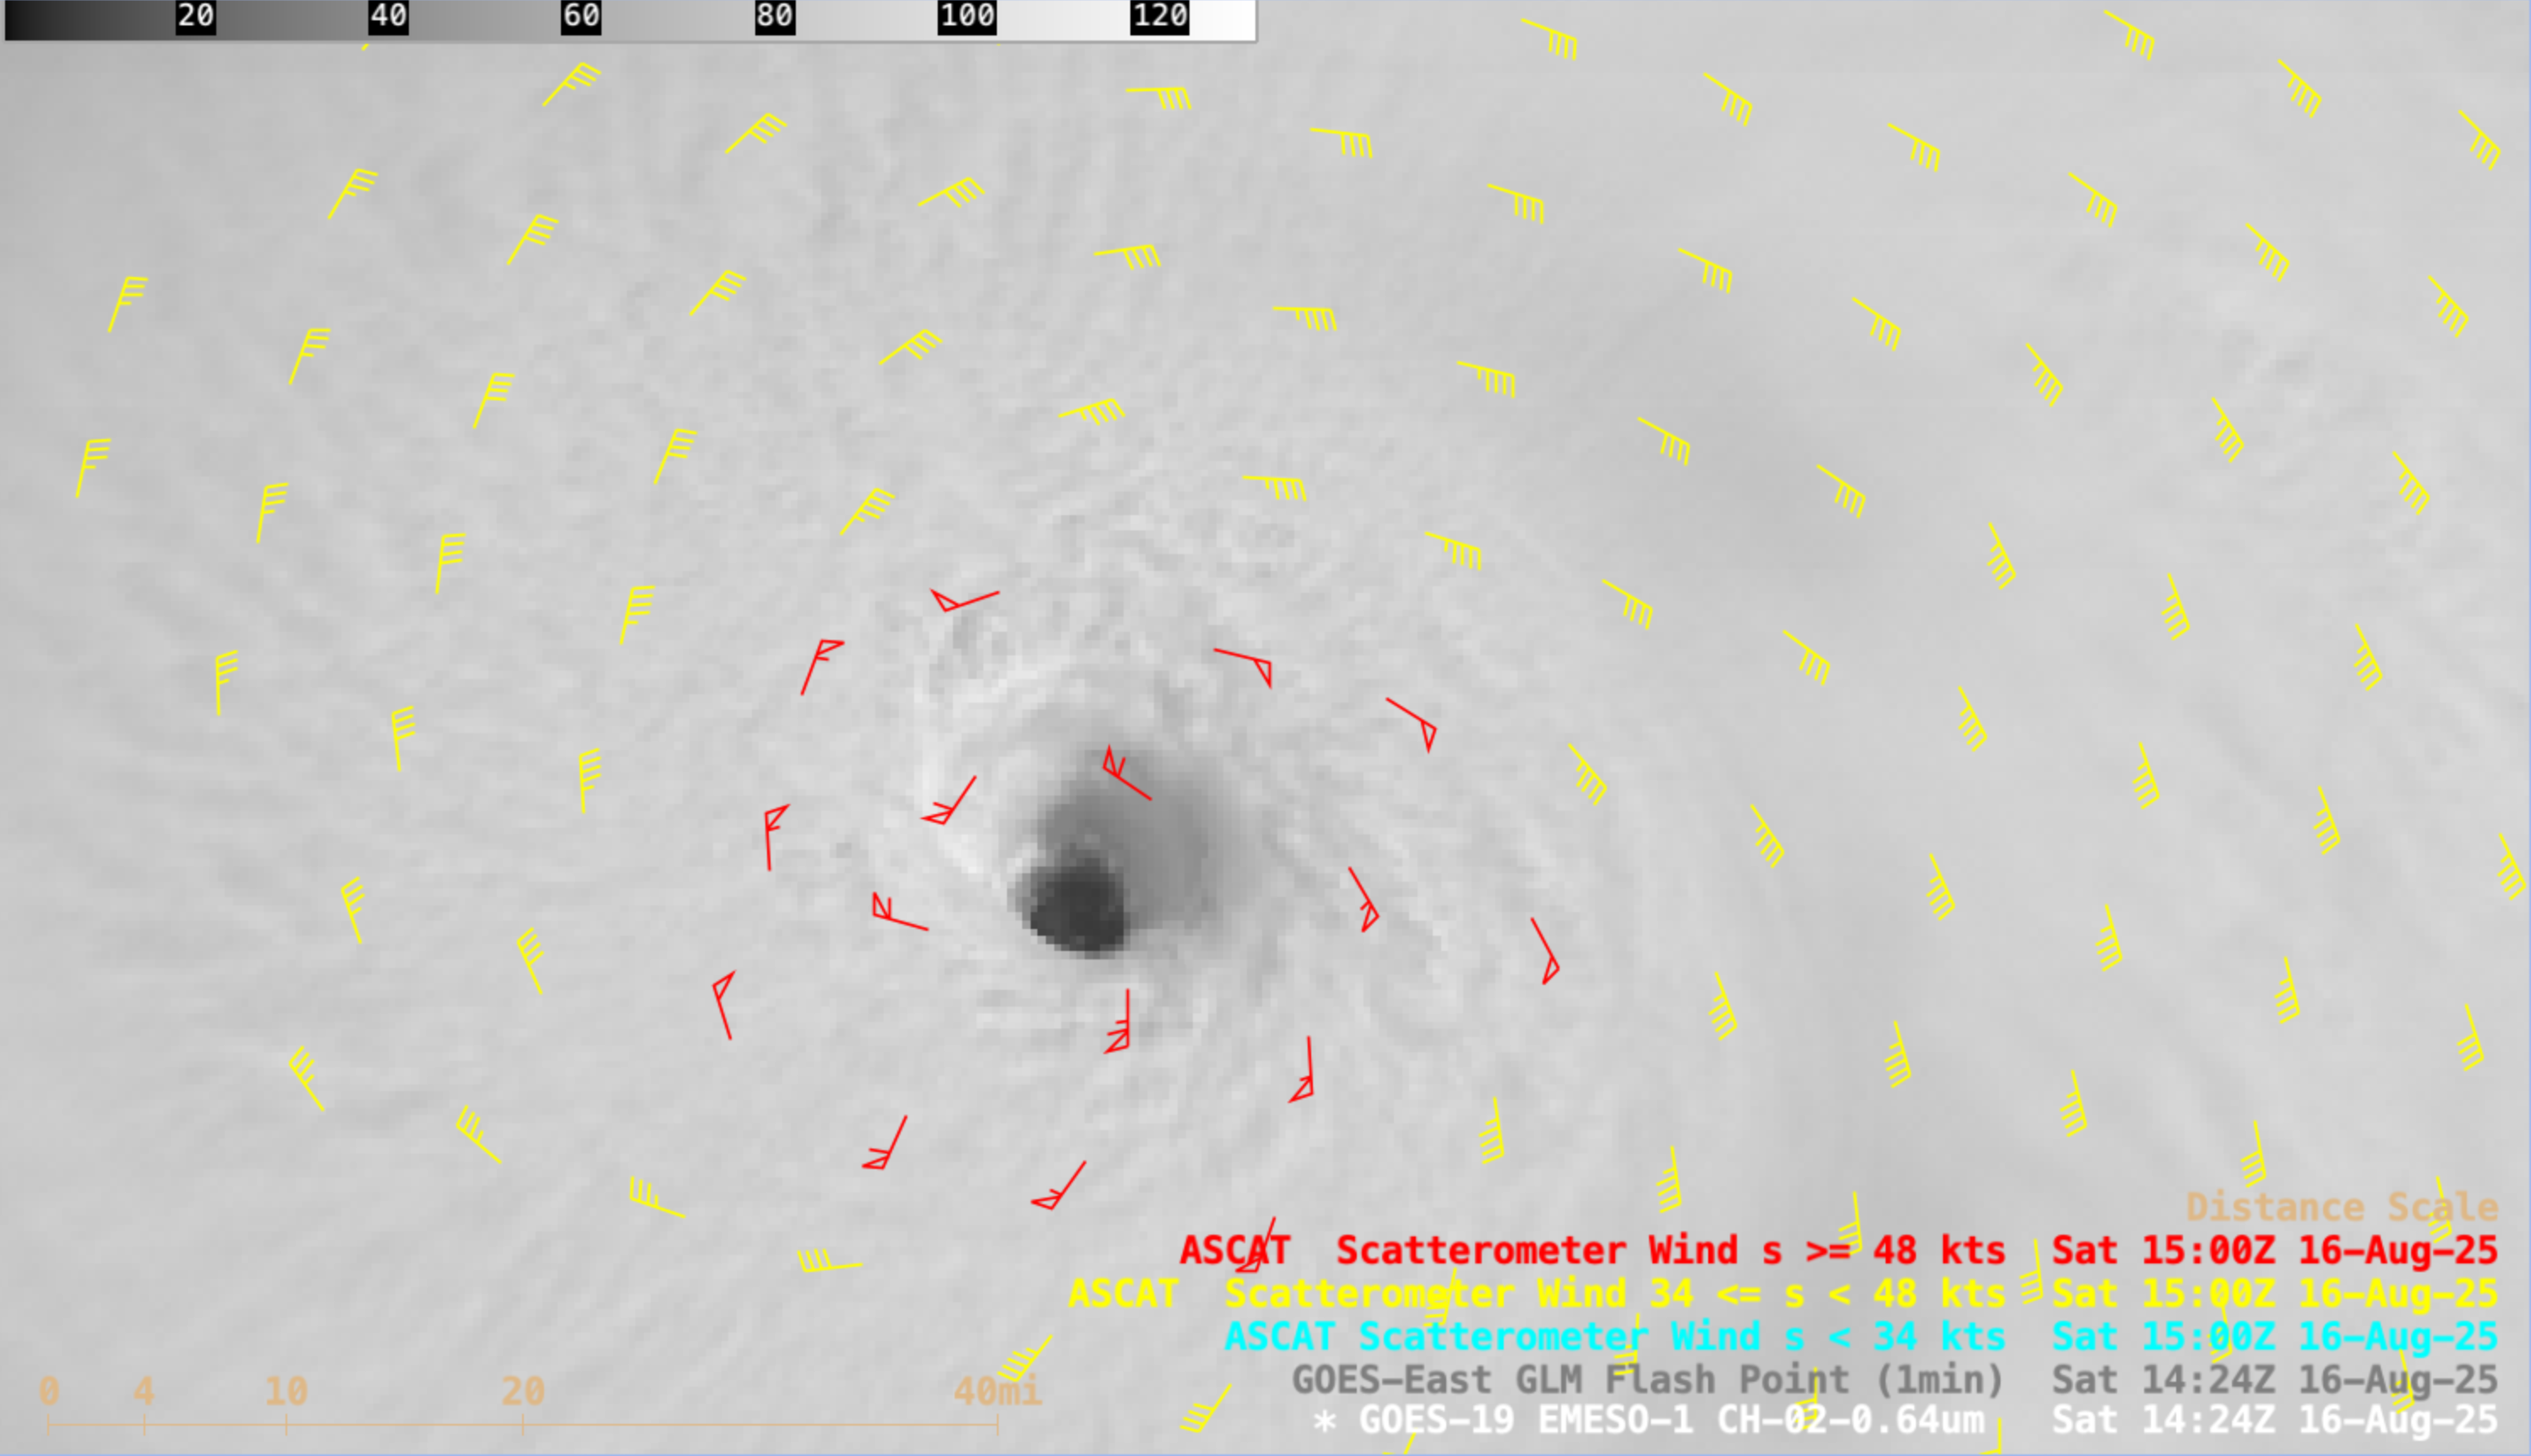
GOES-19 Visible image at 1424 UTC on 16 August, with plots of ASCAT ocean surface winds [click to enlarge]

RCM-3 Synthetic Aperture Radar (SAR) image at 2229 UTC on 16 August [click to enlarge]

1-minute GOES-19 Infrared images and GLM Flash Points from 2300 UTC on 16 August to 0500 UTC on 17 August, with hourly plots of weather at Buoy 41043 [click to play MP4 animation]
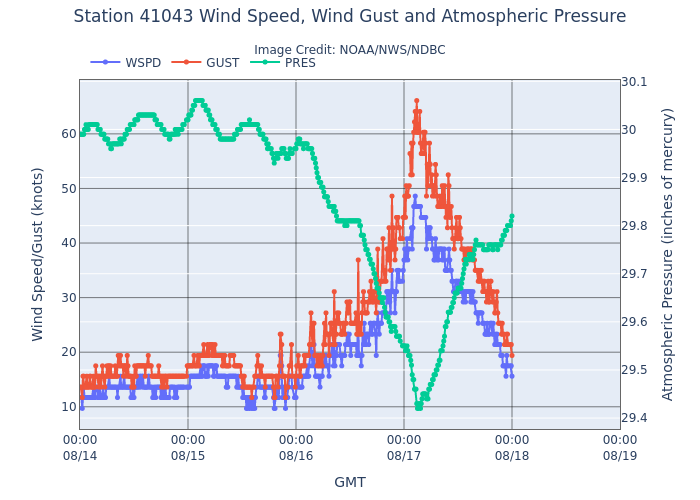
Plots of wind speed (blue), wind gusts (red) and pressure (green) at Buoy 41043

Plot of wave height at Buoy 41043
The maximum wave height of 29 ft measured at Buoy 41043 was commensurate with the 25.32 ft significant wave height sensed by Sentinel-3A (and the 39.52 ft sensed by SWOT) farther to the south, near the northern Leeward Islands, during the morning hours (1237 UTC and 1428 UTC) on 16 August (below).
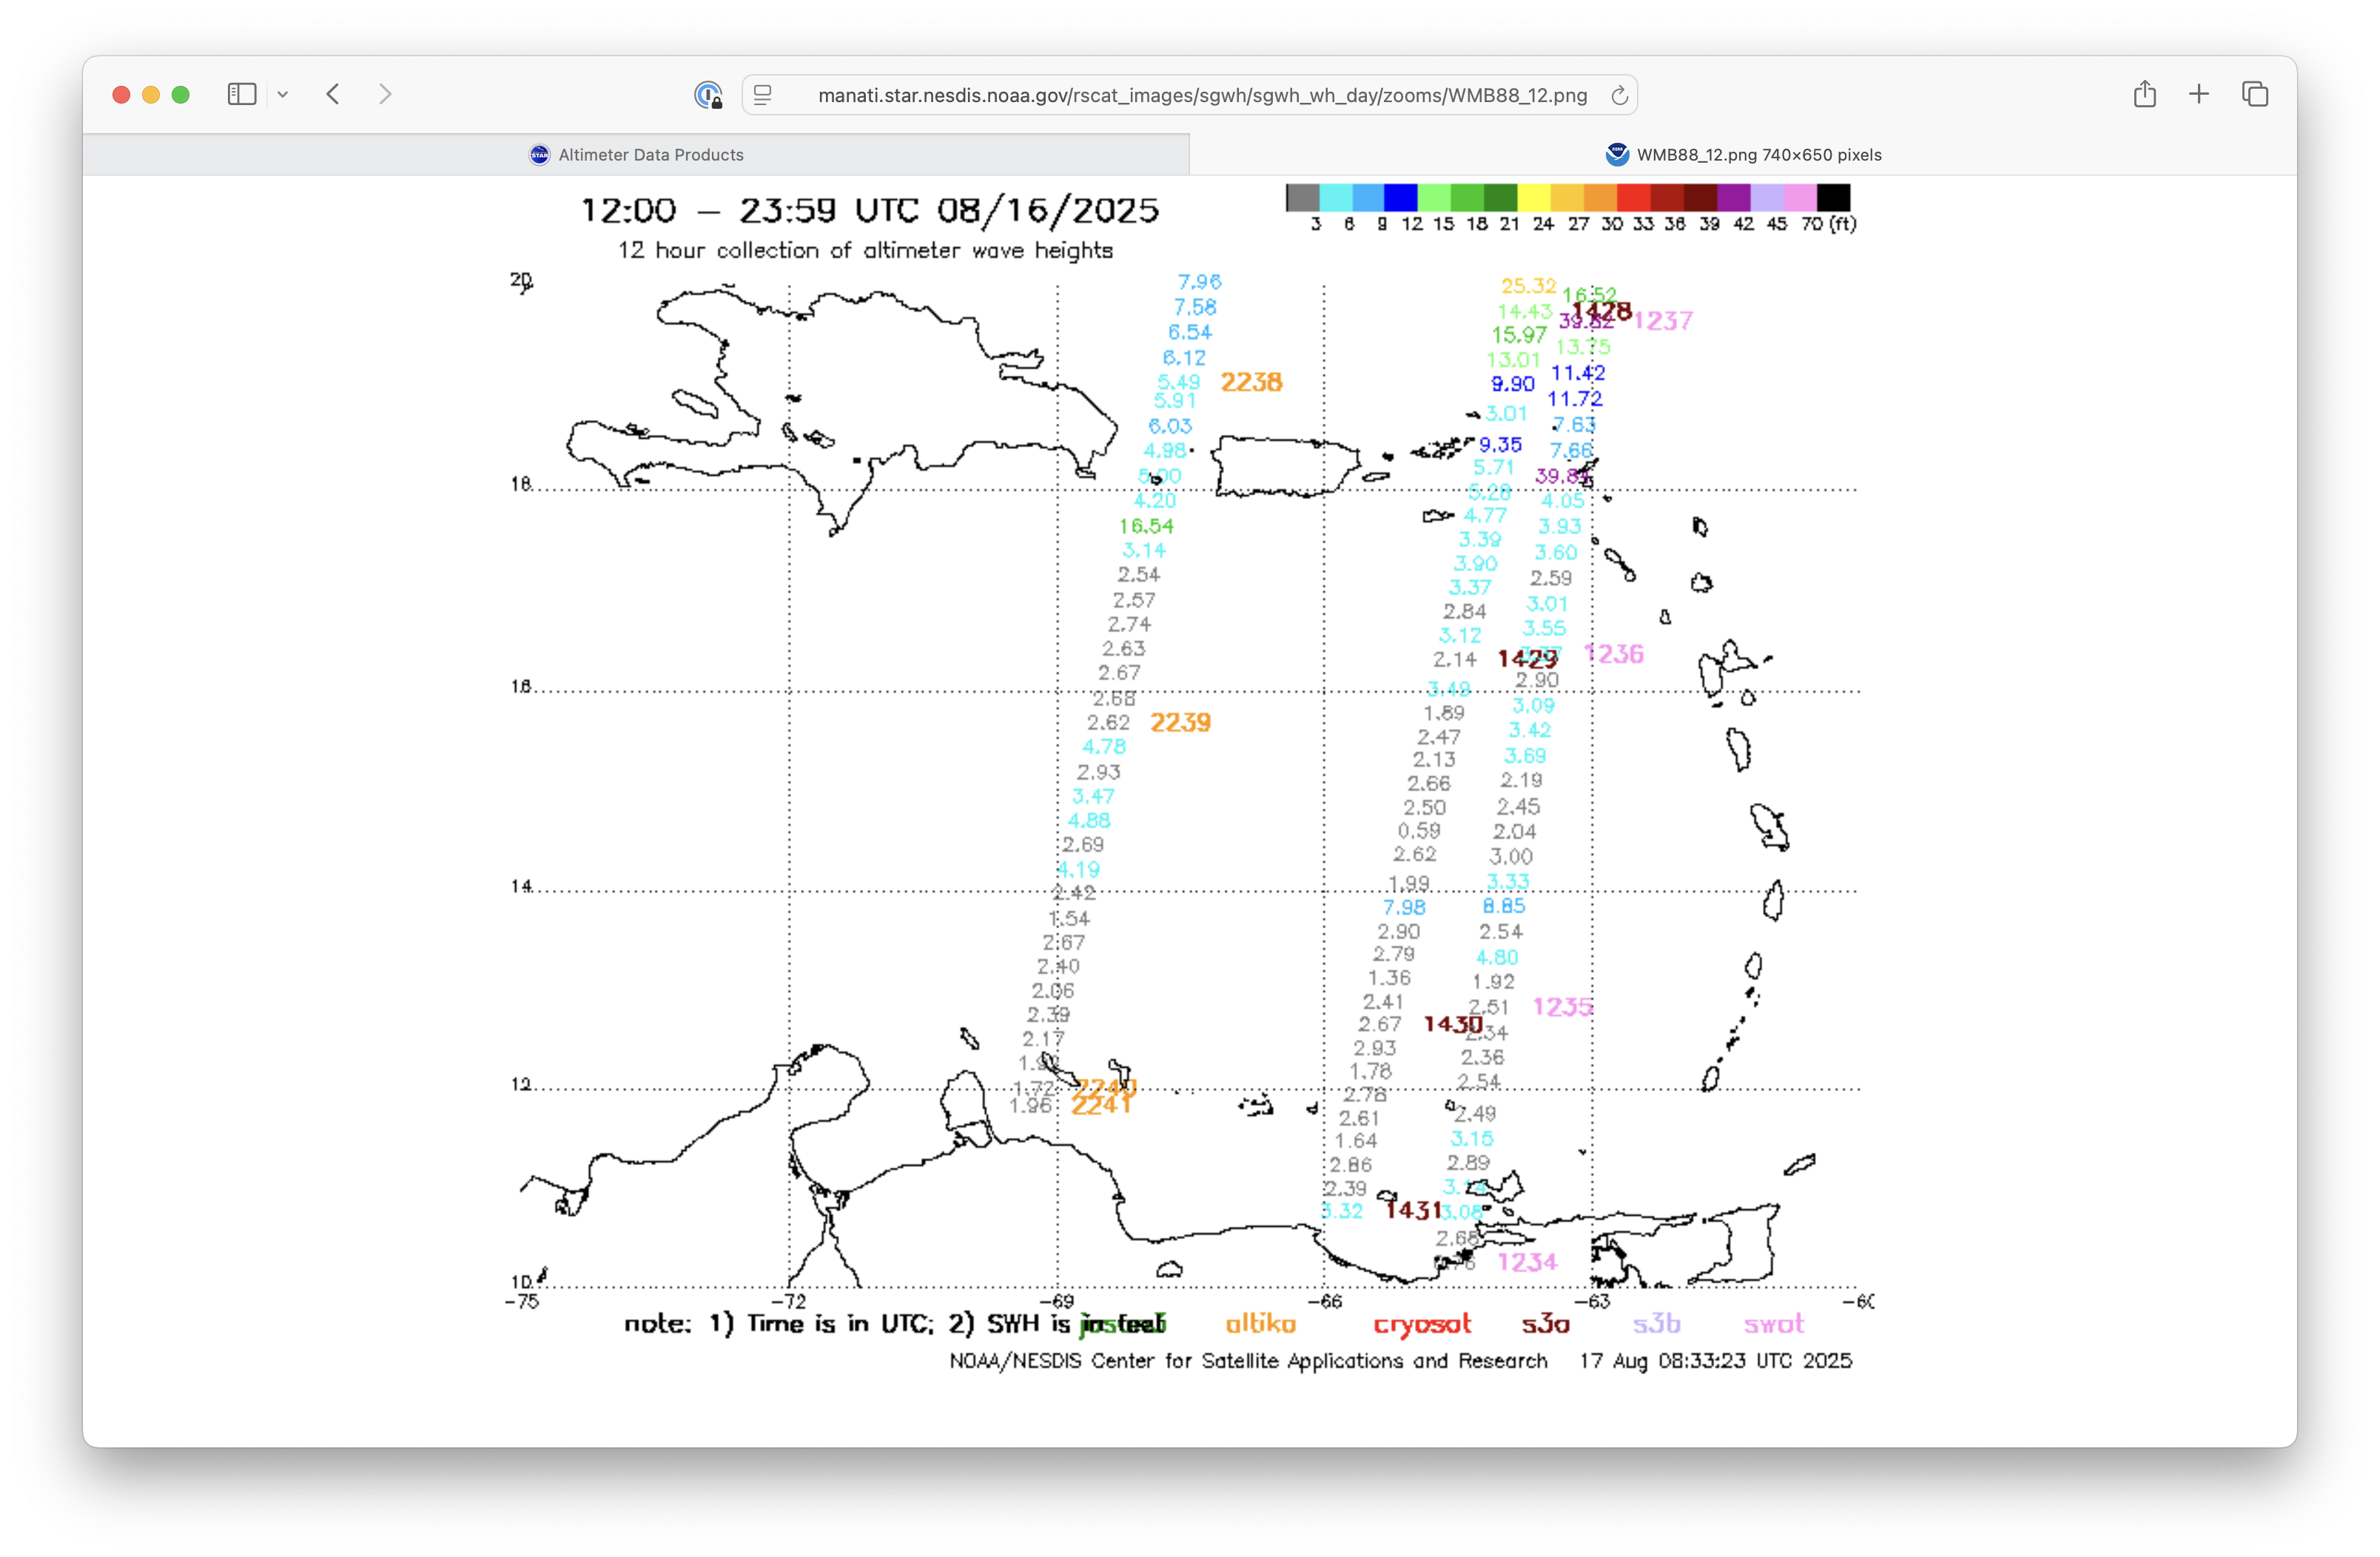
Significant wave heights (in feet) in the vicinity of the Leeward Islands on the morning of 16 August, as sensed from Sentnel-3A (brown time stamps, center swath) and SWOT (violet time stamps, eastern swath) [click to enlarge]