High winds prevent a Hawaiian Airlines flight to Pago Pago from landing
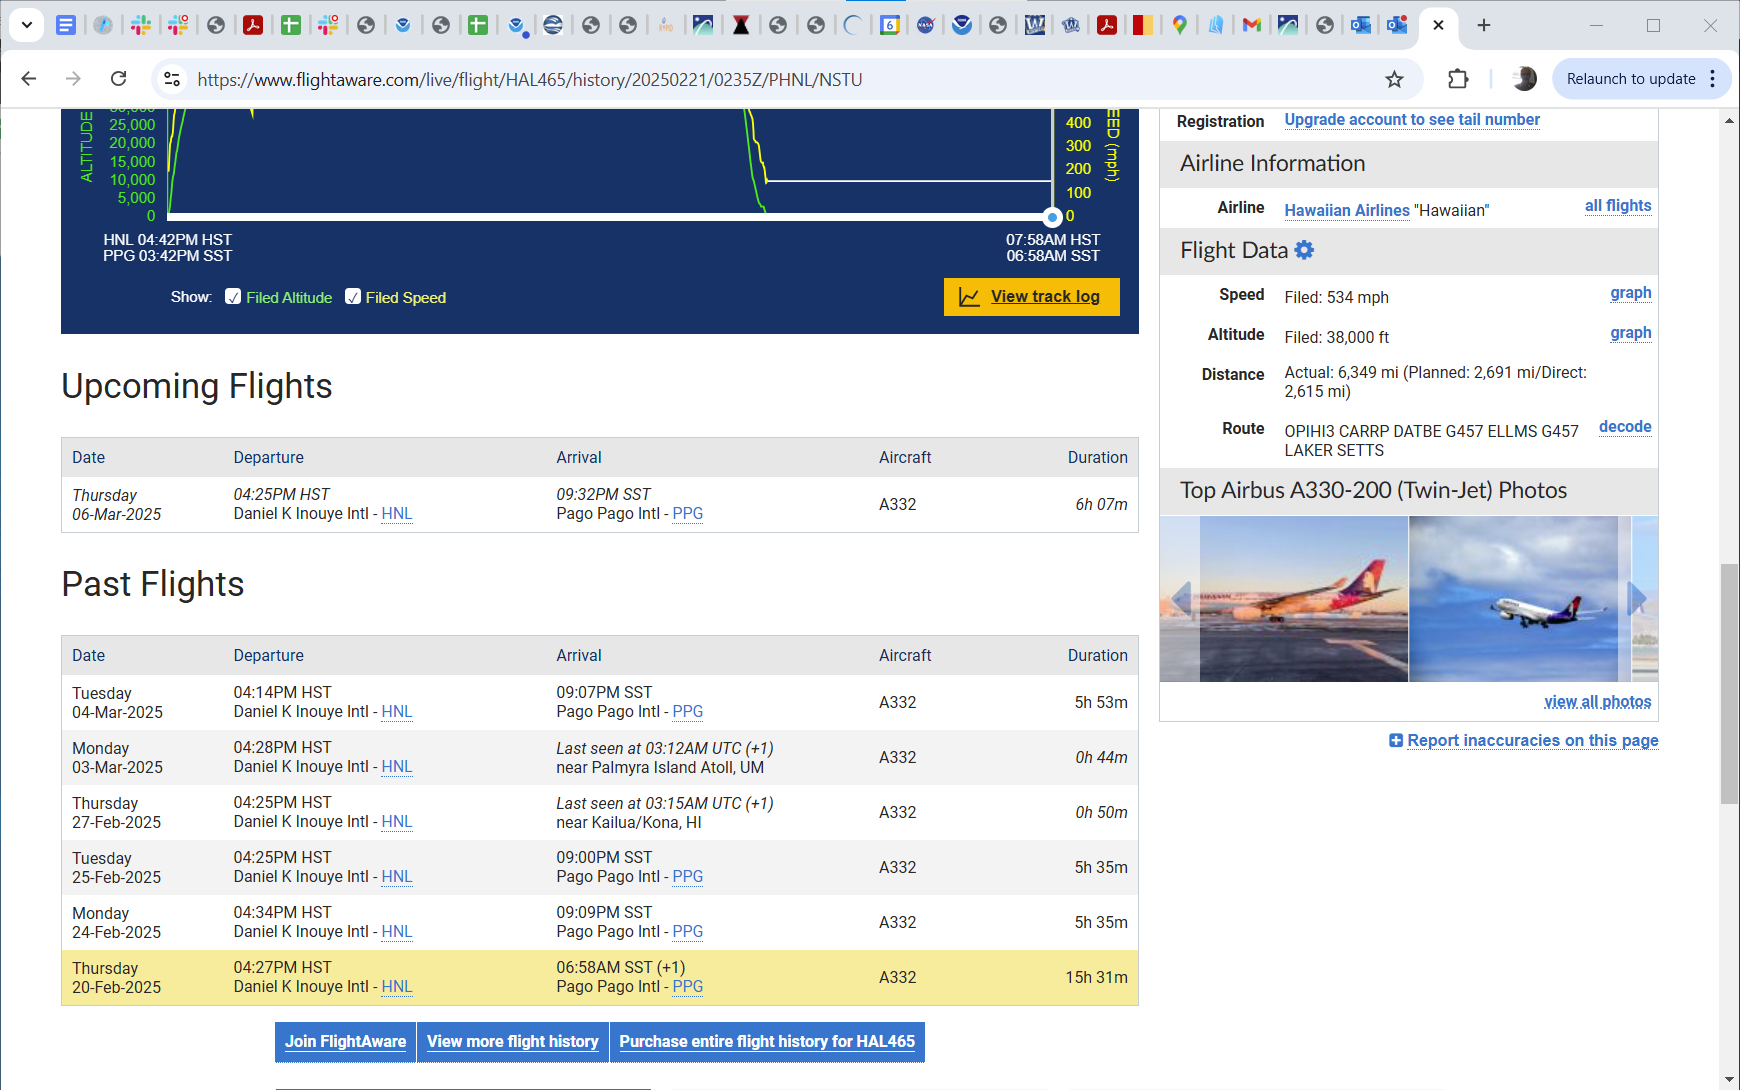
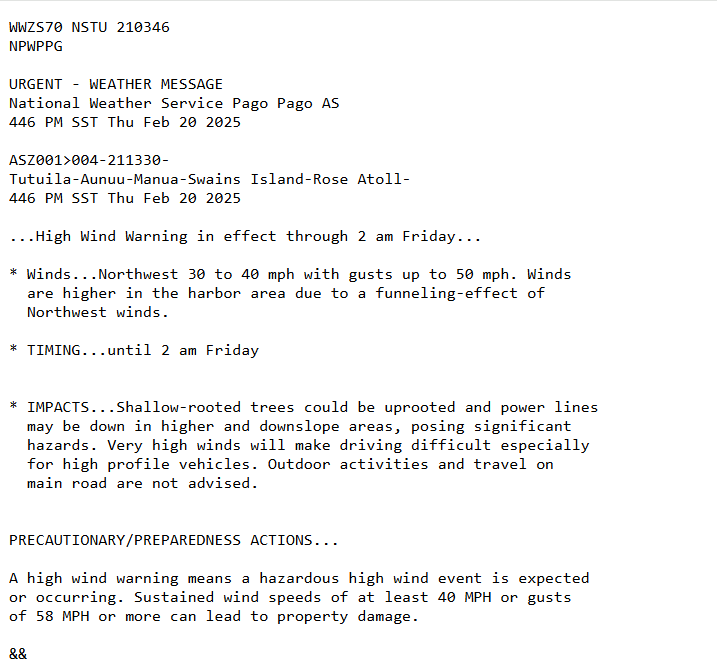
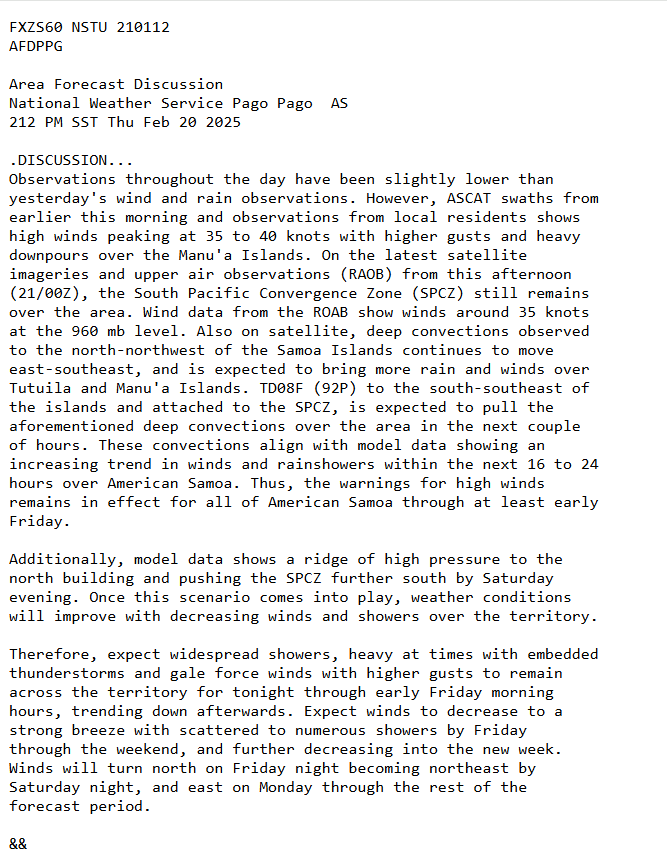
On 20 February 2025, high winds at Pago Pago International Airport (located at 14.3oS, 170.7oW) meant Hawaiian Airlines Flight 465 (an A330 with 160 passengers on board) was forced to return to Honolulu (News Article; FlightAware screenshot) without its scheduled landing in Pago Pago. American Samoa at the time was within the South Pacific Convergence Zone, and both flood and high wind warnings (issued by the National Weather Service office at the airport) were in place (Here is the High Wind Warning Text, and here is the Forecast Discussion valid at that time). What did satellite imagery show during this time?
The animation above shows MIMIC TPW estimates of Total Precipitable Water derived from Microwave sounders. The abundant moisture of the SPCZ is shown are red/dark purple over Samoa. February saw 25″ of rain fall in Pago Pago.
CIMSS Turbulence (online here, with a training video available) shows fields created via machine-learning algorithms that are trained on aircraft observations of Eddy Dissipation Rate (EDR, i.e., turbulence), and the fields displayed below show probability of Moderate-or-Greater (MOG) turbulence. The animation shows MOG fields from GOES-West from 0000-0930 UTC on 21 February 2025 (HA465 typically lands at 9 PM Samoa Standard Time, which is 0800 UTC on the following day). As noted above, Pago Pago is near 14oS, 171oW, near the center of the box drawn on the image. The satellite imagery and GFS model fields used to compute MOG Probability show large values around the Samoan Islands. This predicts upper-level turbulence, not the turbulence that might be occurring closer to the surface.
JMA‘s Himawari-9 also views American Samoa. CIMSS Turbulence fields computed using data from that satellite, below, tell a similar tale.

GOES-18 Clean Window infrared imagery, below, shows widespread convection associated with the SPCZ over the Samoan Islands. Clear-air Total Precipitable Water (TPW), a level-2 GOES-R Product shows little information because of the widespread cloudiness (this is when microwave-based TPW estimates, like MIMIC shown above, are most important) although values (showing very moist conditions) occasionally appear in breaks in the cloudiness.
Upper-level Water Vapor infrared imagery, below, similarly shows widespread convection over the Samoan Islands. You can also infer large scale upper-level divergence: Equator-ward motion over the northern part of the domain and poleward motion in the southern part of the domain.
Soundings from Pago Pago (upper air station 91765, from here) on 20 and 21 February are shown below. The very moist airmass is noteable (60+ mm of Total Precipitable Water), and so are the strong winds: 40-50 knots below 800 mb!
Scatterometry on 20 and 21 February shown below (from the ‘manati’ website) show strong low-level winds over/around the islands.

The SSEC/CIMSS Tropical Website includes wind analyses over the southeast Pacific. What did those show during this time? Low-level convergence and upper-level divergence, shown below, are consistent with the development of very strong convection within the moist atmosphere.
Observed winds (observed by tracking cloud motions or water vapor gradients) at low levels show the broad convergence over the area, and broad swaths of low-level winds at 20-25 knots. Cloudiness over the Samoan Islands, however, prevented observations of derived motion winds there. Upper-level winds for the same time are concentrated over the cloudband that overlies the Samoan Islands. It’s pretty easy to see very strong diffluence over Samoa.
Deep-layer mean flow on 20-21 February 2025 was towards the east-southeast. Convective development was moving in that direction during the 36h shown in the animation (Click here to see an animation of 850-mb vorticity).
Shear values, shown below for 0000 and 1200 UTC on 21 February, suggest a favorable environment for Tropical Cyclone spin-up is present just south of the Samoan Islands.
What do all these fields mean put together? Are they enough to cancel the flight at the outset? Not really (in my opinion, not that anyone asked me back on the 20th), but they certainly support the presence of the strong winds at the airport that led to two landing attempts and forced the plane to return to its starting point.
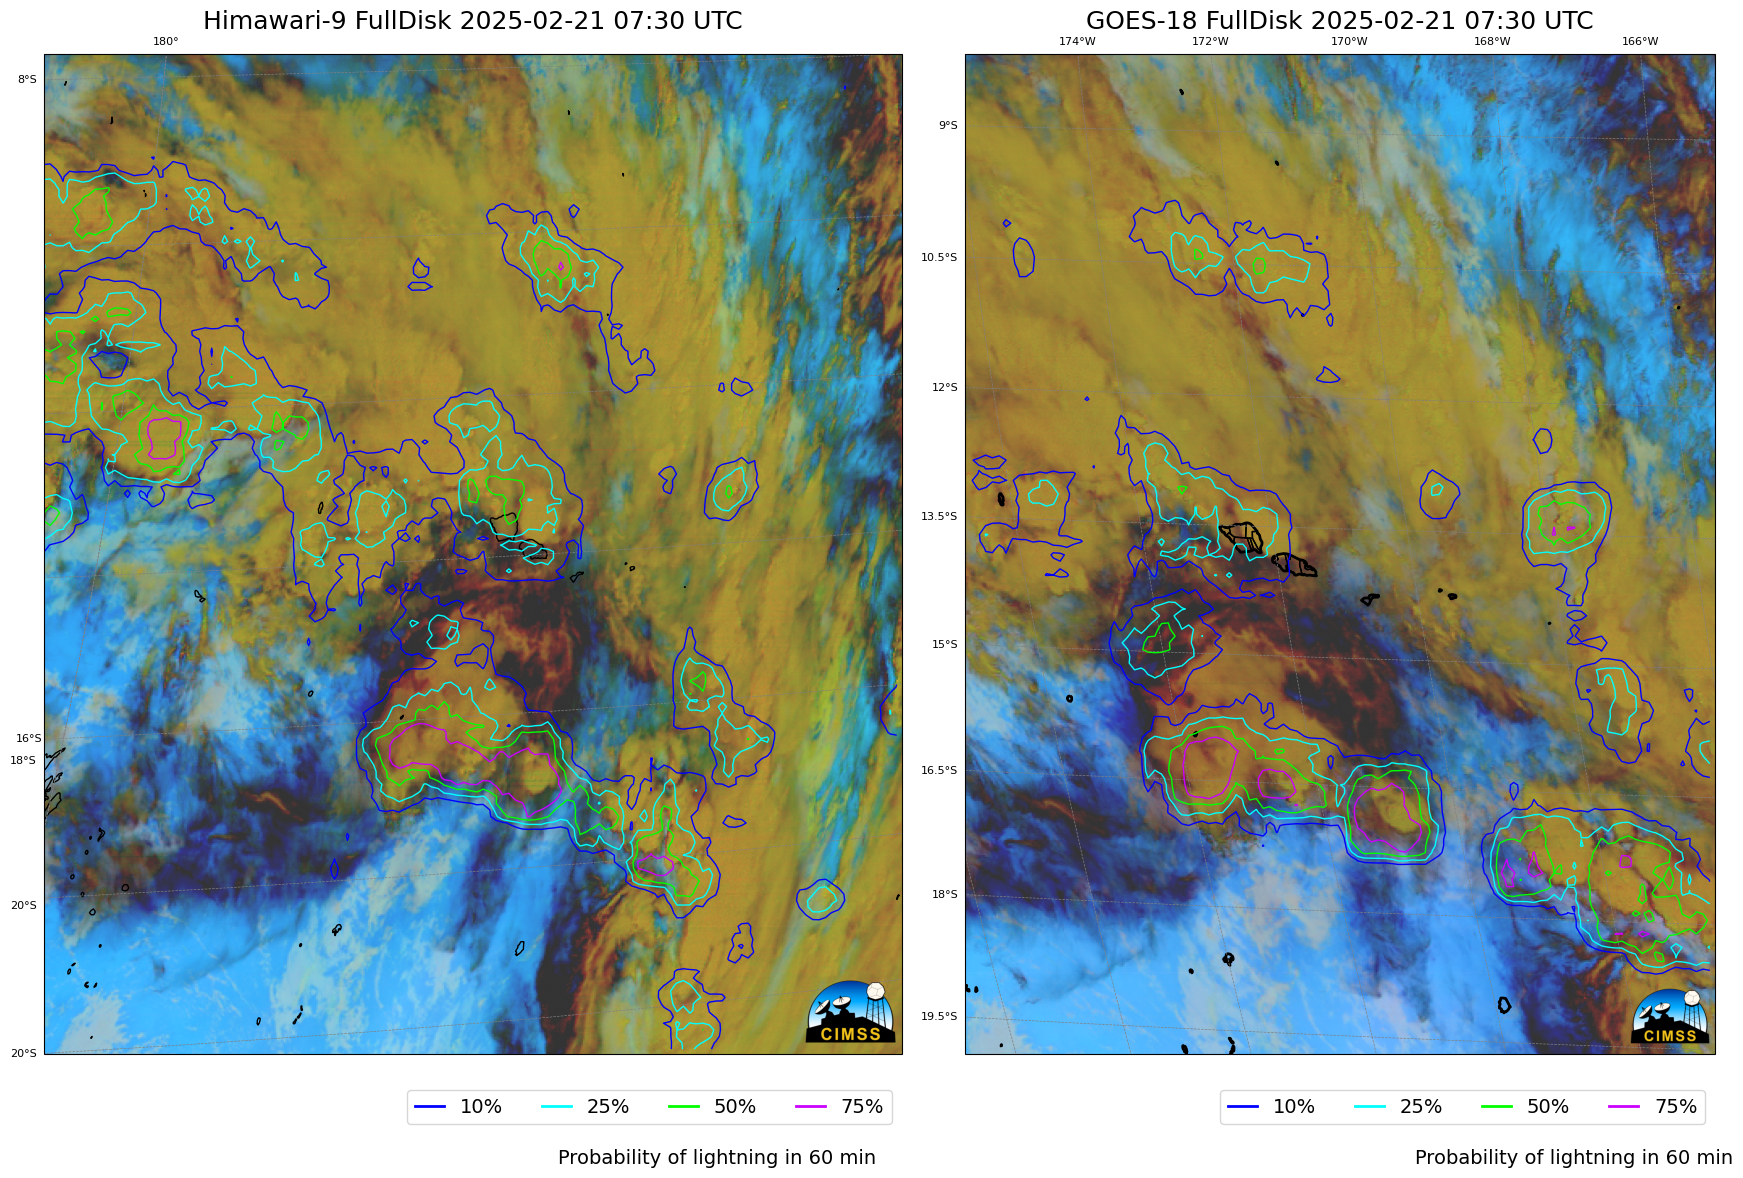
What did LightningCast probabilities (as computed with the latest CSPP Geo software beta release) show? The animation below shows GOES-18 LightingCast probabilities at 10-minute timesteps from 0700 through 0830 UTC on 21 February 2025. Convection that will likely produce GLM Observations in the next 60 minutes is over Independent Samoa, but not over American Samoa.
Values computed with Himawari-9 data, shown below at 0730 UTC on 21 February 2025, are very similar to those from GOES-18.