PyroCumulonimbus cloud in Texas

GOES-16 “Red” Visible (0.64 µm, top), Shortwave Infrared (3.9 µm, center) and “Clean” Infrared Window (10.3 µm, bottom) images, with hourly plots of surface reports [click to play animation | MP4]
4-panel comparisons of Suomi NPP VIIRS Visible (0.64 µm), Near-Infrared “Snow/Ice” (1.61 µm), Shortwave Infrared (3.74 µm) and Infrared Window (11.45 µm) images at 1936 UTC and 2029 UTC (below) revealed that the maximum differences between 3.74 µm and 11.45 µm cloud-top infrared brightness temperatures — at the same location on the pyroCb anvil — were 86ºC (from +26ºC to -59ºC at 1936 UTC) and 91.5ºC (from +27.5ºC to -63ºC at 2029 UTC).
Suomi NPP VIIRS Visible (0.64 µm, upper left), Near-Infrared “Snow/Ice” (1.61 µm, upper right), Shortwave Infrared (3.74 µm, lower left) and Infrared Window (11.45 µm, lower right) images at 1936 UTC and 2029 UTC [click to enlarge]
Serious weather nerd moment but absolutely amazing watching the #MallardFire form pyrocumulonimbus & severe thunderstorms over the Texas panhandle. Look at that lightning activity! Wow! #TXwx #PHwx #OKwx #TXfire pic.twitter.com/poozQuipF5
— Zach Stanford (@zachstanford) May 12, 2018
After dark, the thermal signature of the Mallard Fire was also apparent in GOES-16 Near-Infrared “Cloud particle size” (2.24 µm) imagery (below).
GOES-16 Near-Infrared “Cloud particle size” (2.24 µm, top), Shortwave Infrared (3.9 µm, center) and “Clean” Infrared Window (10.3 µm, bottom) images, with hourly plots of surface reports [click to play animation | MP4]
===== 12 May Update =====
![Terra MODIS True-color and False-color images [click to enlarge]](https://cimss.ssec.wisc.edu/satellite-blog/wp-content/uploads/sites/5/2018/05/180512_1703utc_terra_modis_truecolor_falsecolor_Mallard_Fire_TX_anim.gif)
Terra MODIS True-color and False-color images [click to enlarge]
The corresponding Terra MODIS Land Surface Temperature product (below) indicated that LST values within the burn scar were as high as 137ºF (darker red enhancement), in contrast to values around 100ºF adjacent to the burn scar.
![Terra MODIS Land Surface Temperature product [click to enlarge]](https://cimss.ssec.wisc.edu/satellite-blog/wp-content/uploads/sites/5/2018/05/MODIS_LST_20180512_1651.png)
Terra MODIS Land Surface Temperature product [click to enlarge]
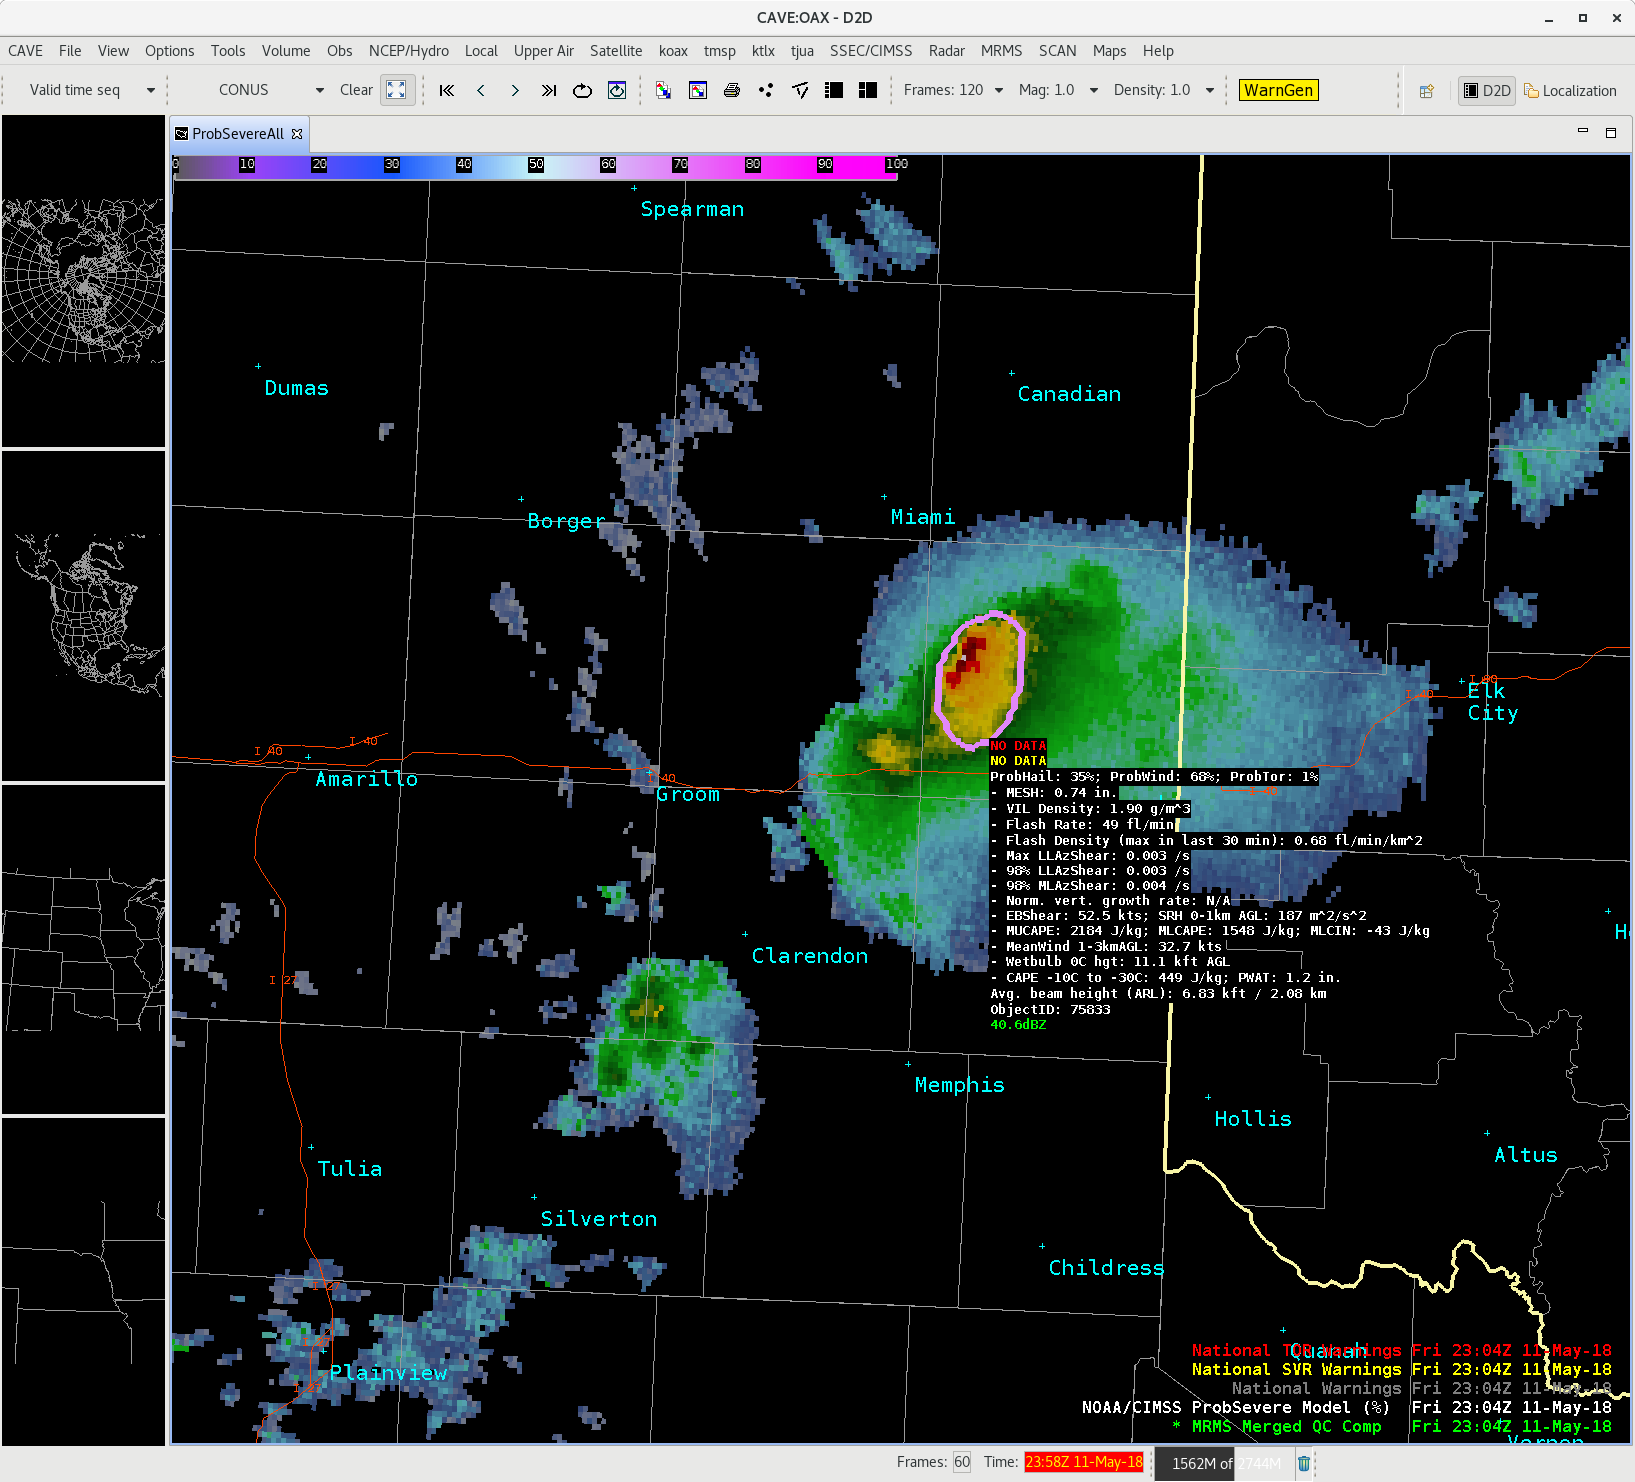
NOAA/CIMSS ProbSevere readout for the Severe Pyrocumulonimbus, on top of MRMS Reflectivity, 2304 UTC on 11 May 2018 (Click to enlarge)
How did NOAA/CIMSS ProbSevere handle this severe storm? The image above (all ProbSevere imagery here courtesy John Cintineo, CIMSS) shows the ProbSevere readout at 2304 UTC. An animation of ProbSevere for this radar object is available here. ProbHail and especially ProbWind showed high values with this storm prior to the observed hail.
Time-series of ProbSevere (version 1) are shown below. Effective Bulk Shear, Lightning Flash Rate and Storm-relative Helicity seemed to be the principal drivers in the product for this event.
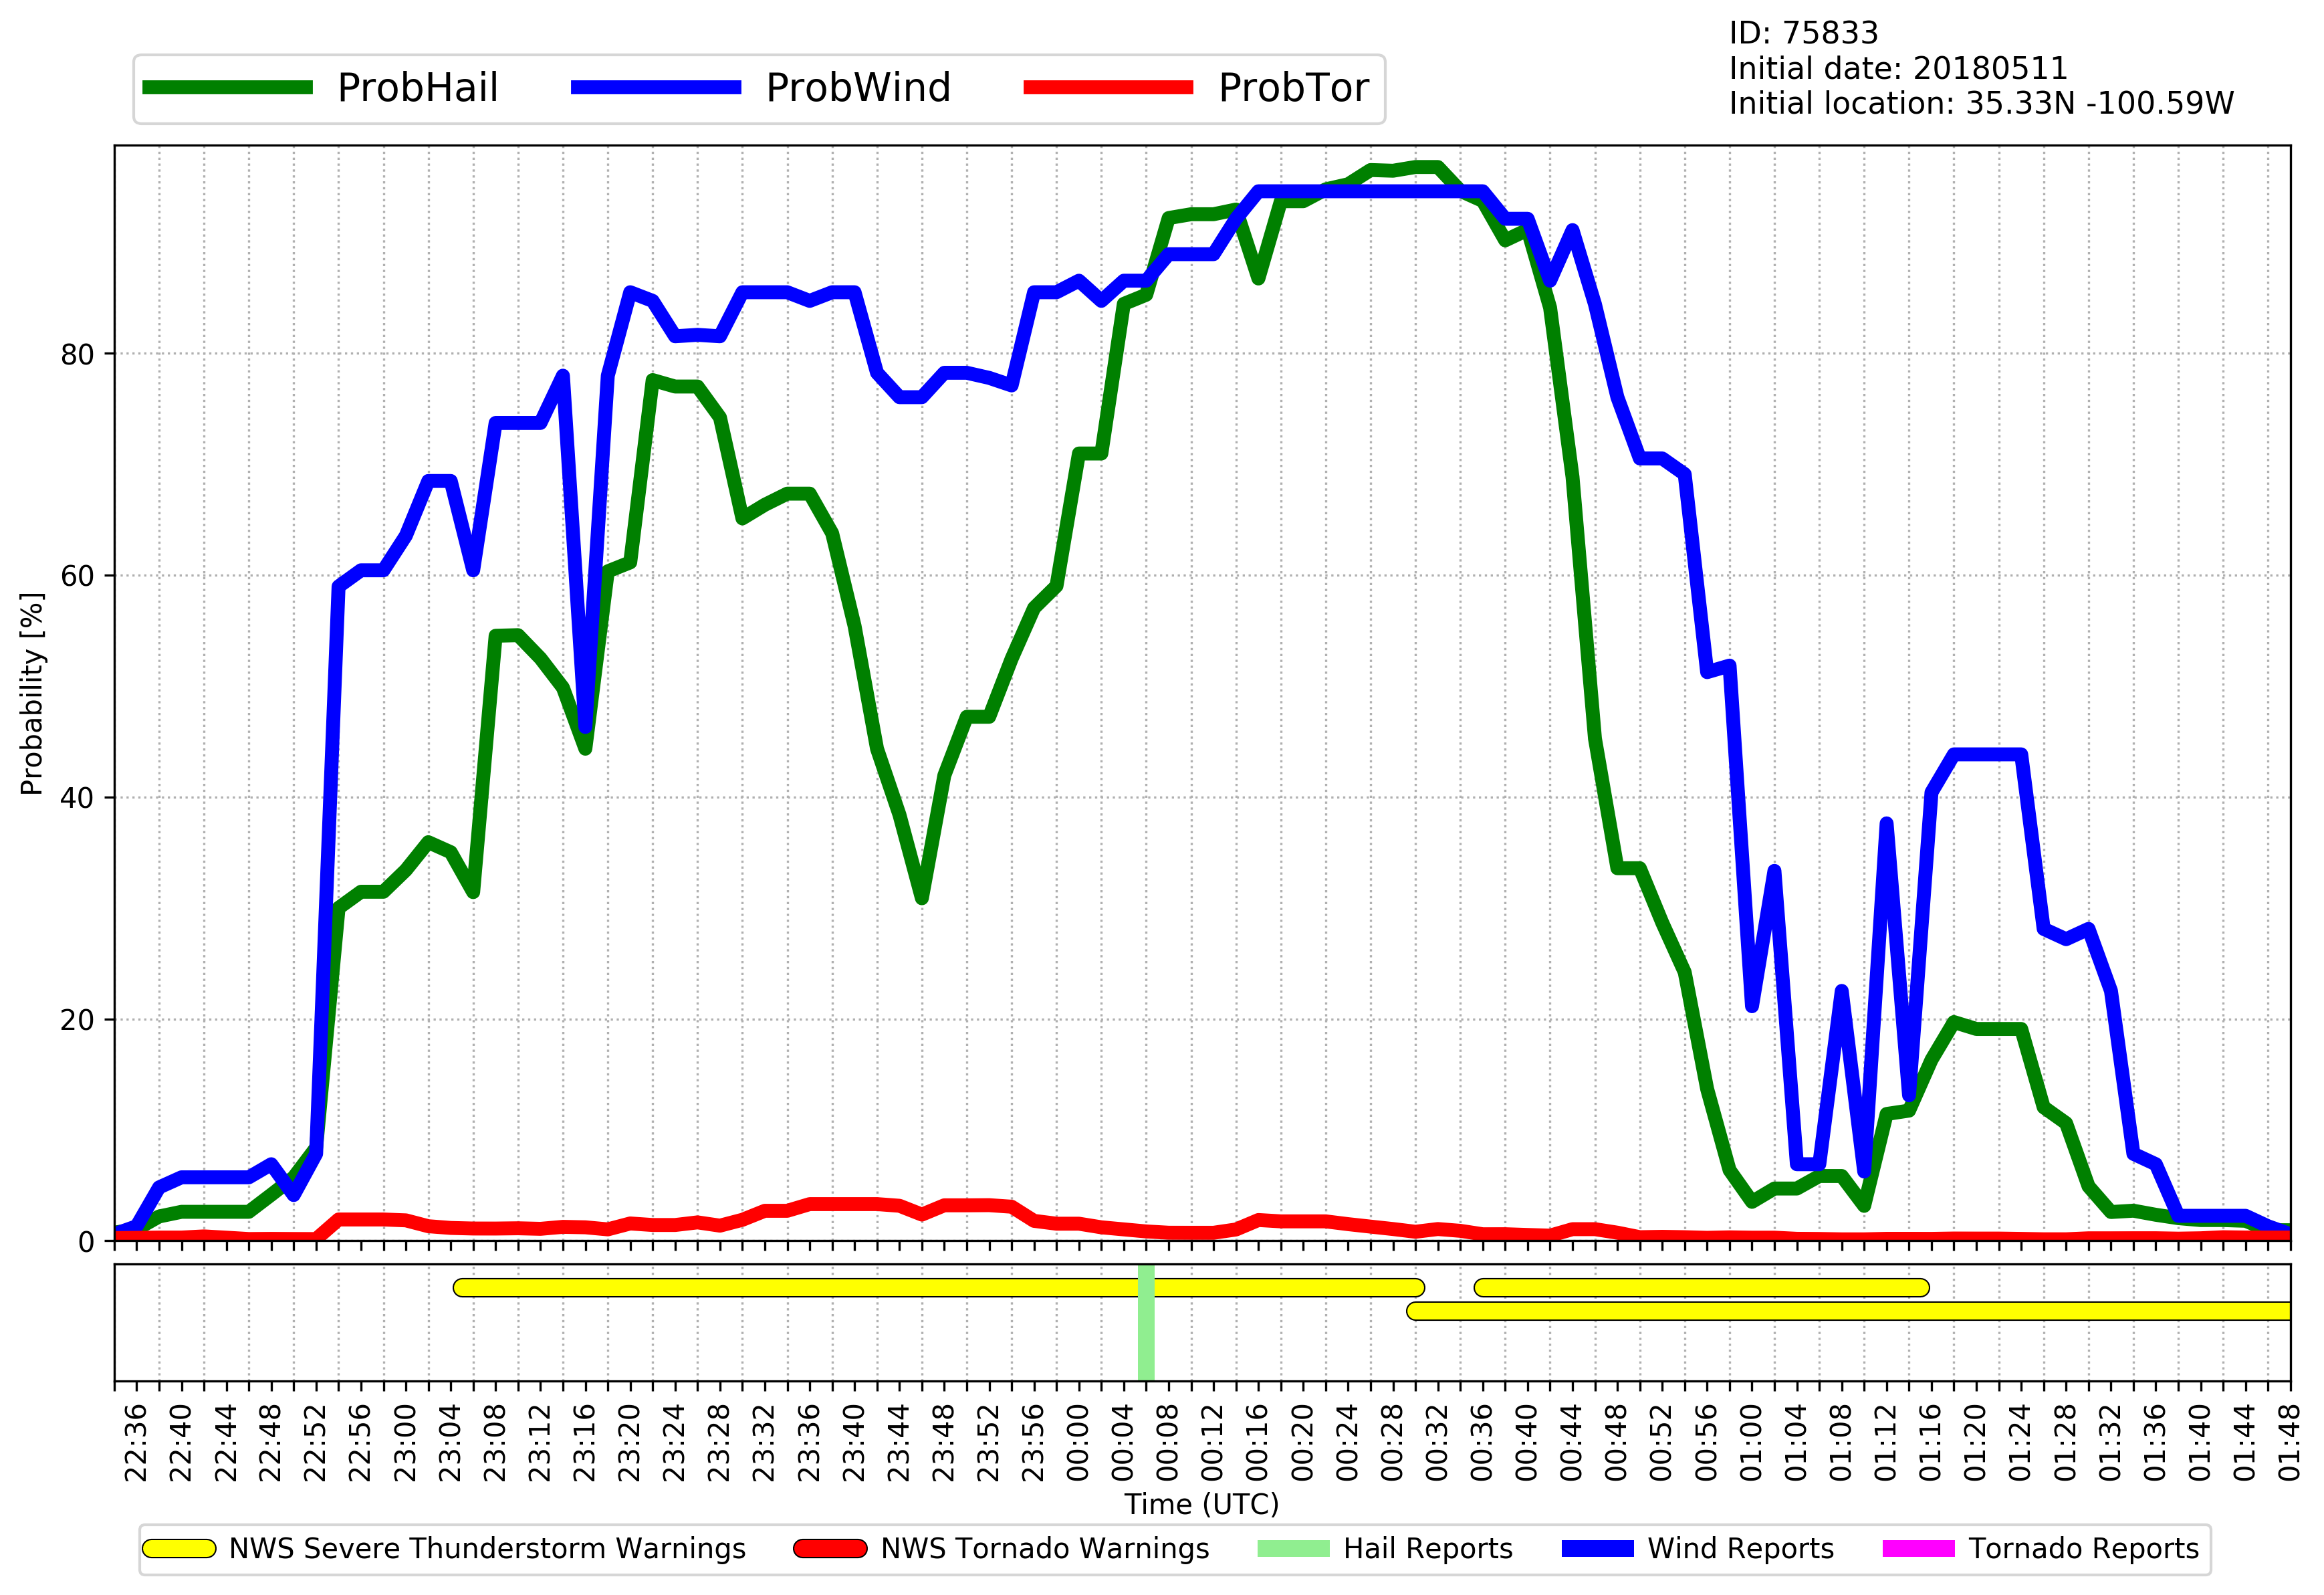
ProbWind, ProbHail and ProbTor values for the Radar Object associated with the Severe Storm that dropped 1-inch hail (the time of the observed severe hail is indicated by the green vertical line along the x-axis). ProbWind is consistently high before the severe event, ProbHail is smaller, and both increase in magnitude after the observation (Click to enlarge)
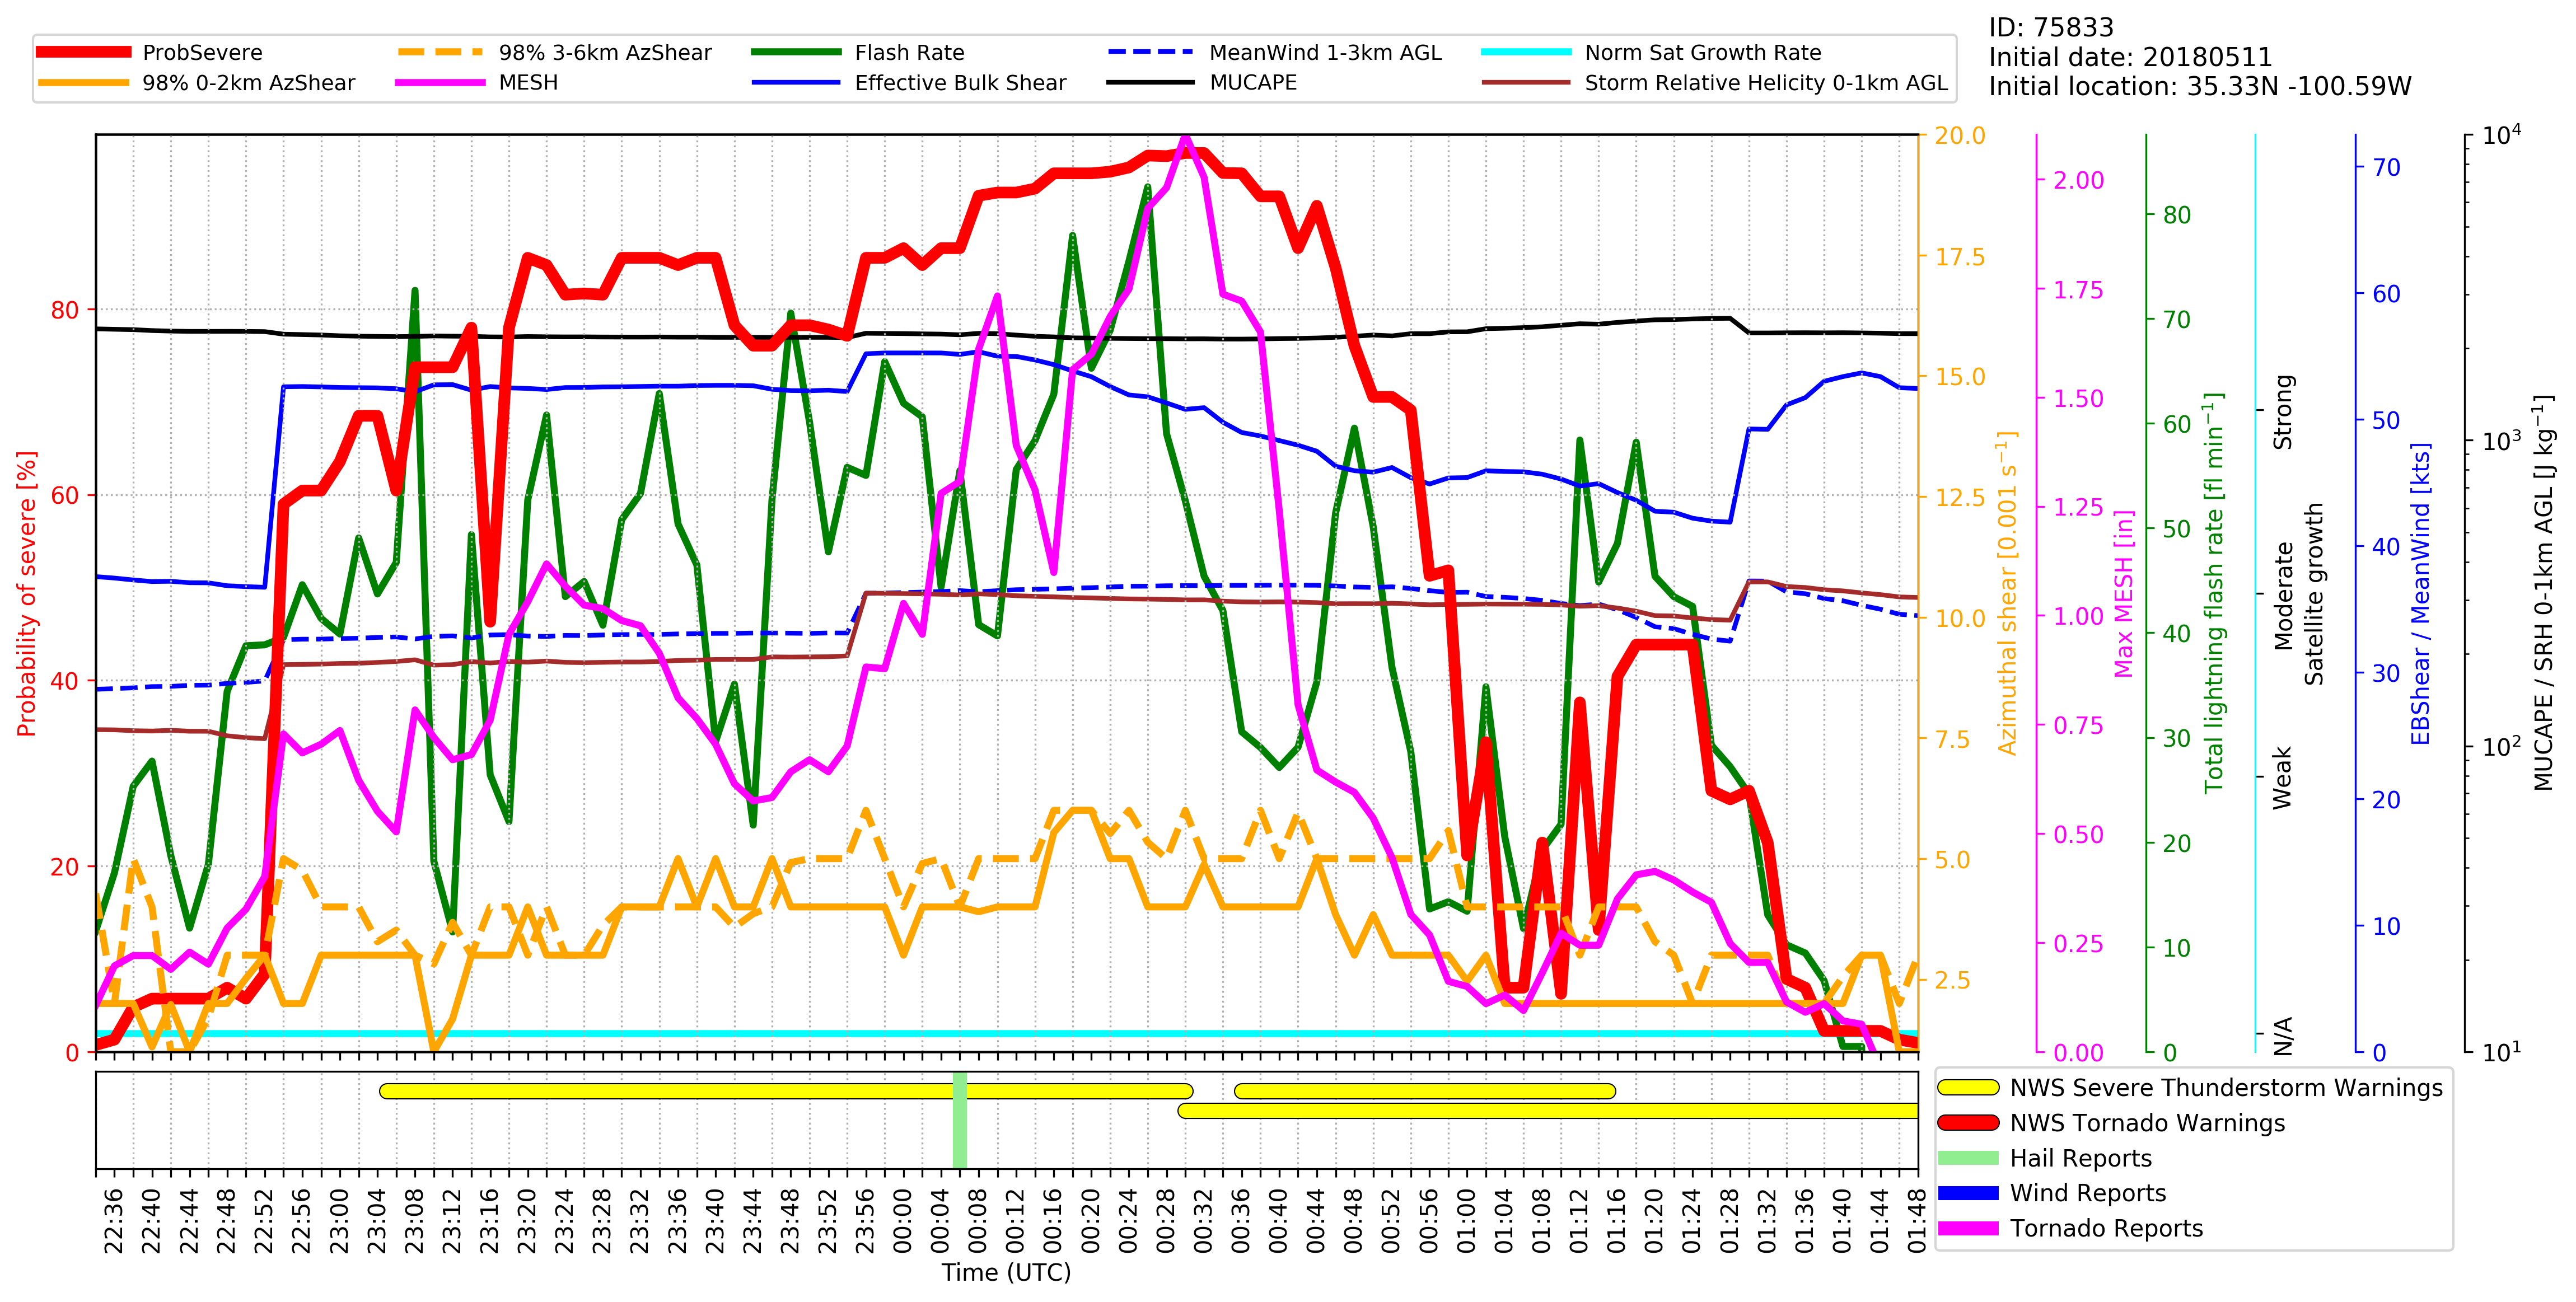
NOAA/CIMSS ProbSevere components for the times surrounding the severe hail deposited by the Mallard Storm (Click to enlarge)