Tropical Storm Barry
![GOES-16 "Red" Visible (0.64 µm) and "Clean" Infrared Window (10.35 µm) images, with plots of buoy and ship reports [click to play MP4 animation]](https://cimss.ssec.wisc.edu/satellite-blog/wp-content/uploads/sites/5/2019/07/barry_vis-20190711_150110.png)
GOES-16 “Red” Visible (0.64 µm) and “Clean” Infrared Window (10.35 µm) images, with plots of buoy and ship reports [click to play MP4 animation]
As was seen in an animation of GOES-16 Infrared imagery from the CIMSS Tropical Cyclones site (below), Barry was in an environment of low deep-layer wind shear — a factor that was favorable for further intensification.
![GOES-16 Infrared (11.2 µm) images, with contours of deep-layer wind shear [click to enlarge]](https://cimss.ssec.wisc.edu/satellite-blog/wp-content/uploads/sites/5/2019/07/190711_goes16_ir_shear_Barry_anim.gif)
GOES-16 Infrared (11.2 µm) images, with contours of deep-layer wind shear [click to enlarge]
===== 12 July Update =====

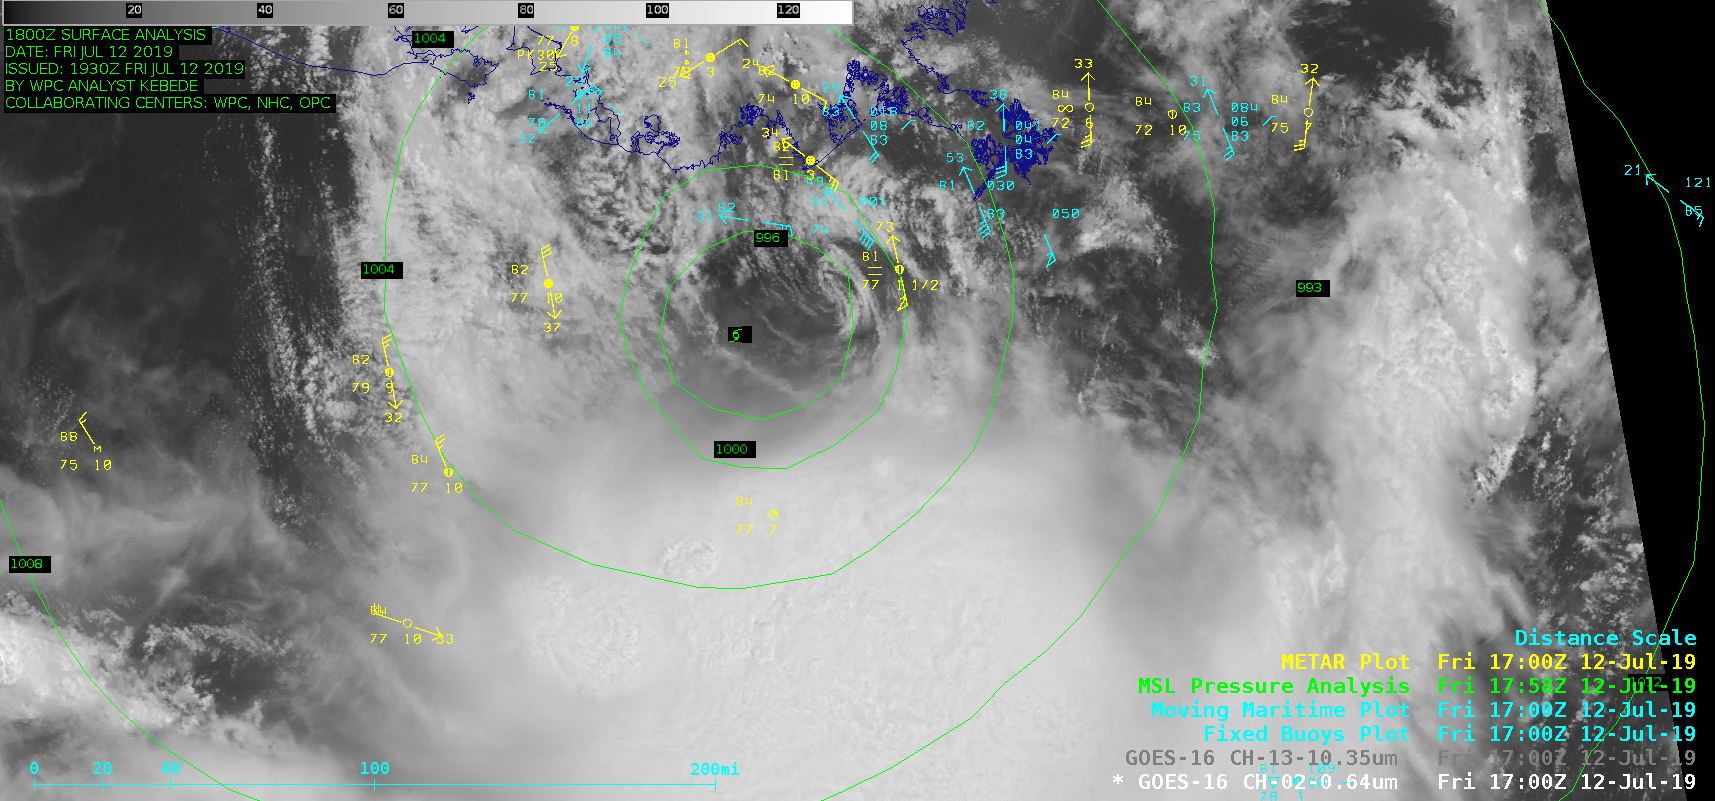
GOES-16 “Red” Visible (0.64 µm) images [click to play animation | MP4]
The corresponding GOES-16 Infrared images (below) showed that deep convection remained to the south of the center of Barry.
![GOES-16 "Clean" Infrared Window (10.35 µm) images [click to play animation | MP4]](https://cimss.ssec.wisc.edu/satellite-blog/wp-content/uploads/sites/5/2019/07/190712_goes16_infrared_Barry_anim.gif)
GOES-16 “Clean” Infrared Window (10.35 µm) images [click to play animation | MP4]
===== 17 July Update =====
![Aqua MODIS Sea Surface Temperature product [click to enlarge]](https://cimss.ssec.wisc.edu/satellite-blog/wp-content/uploads/sites/5/2019/07/modis_sst-20190709_073100.png)
Aqua MODIS Sea Surface Temperature product on 09 July [click to enlarge]
8 days later, a Terra MODIS SST image (below) revealed values predominantly in the lower to middle 80s F (green to yellow enhancement) — the slow movement of Barry as it eventually reached hurricane intensity just prior to landfall induced an upwelling of cooler sub-surface water over that area.
![Terra MODIS Sea Surface Temperature product on 17 July [click to enlarge]](https://cimss.ssec.wisc.edu/satellite-blog/wp-content/uploads/sites/5/2019/07/modis_sst-20190717_040600.png)
Terra MODIS Sea Surface Temperature product on 17 July [click to enlarge]