GCOM-W1 AMSR2 microwave products
![GCOM-W! AMSR2 Total Precipitable Water and Wind Speed products, from 2256 UTC on 28 November to 1692 UTC on 30 November [click to play animation]](https://cimss.ssec.wisc.edu/satellite-blog/wp-content/uploads/sites/5/2018/11/181128_181130_amsr2_totalPrecipitableWater_windSpeed_global_anim.gif)
GCOM-W1 AMSR2 Total Precipitable Water and Wind Speed products, from 2256 UTC on 28 November to 1692 UTC on 30 November [click to play animation]
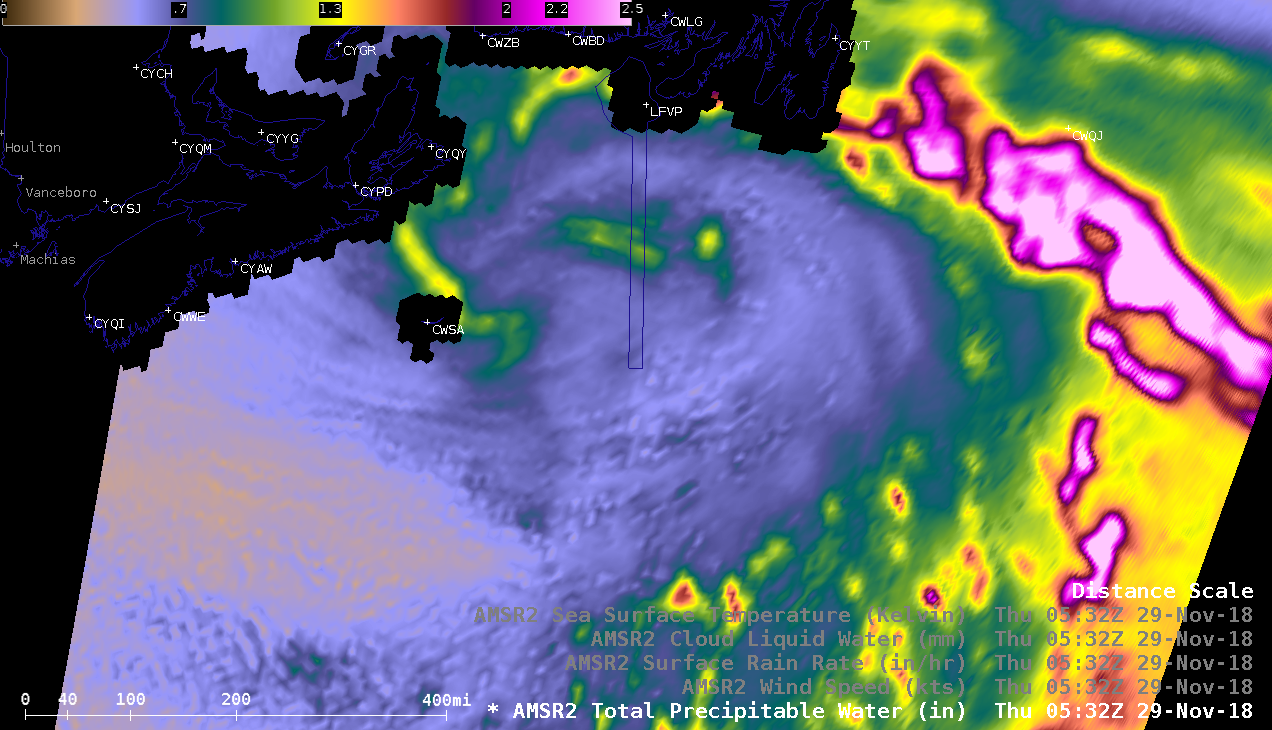
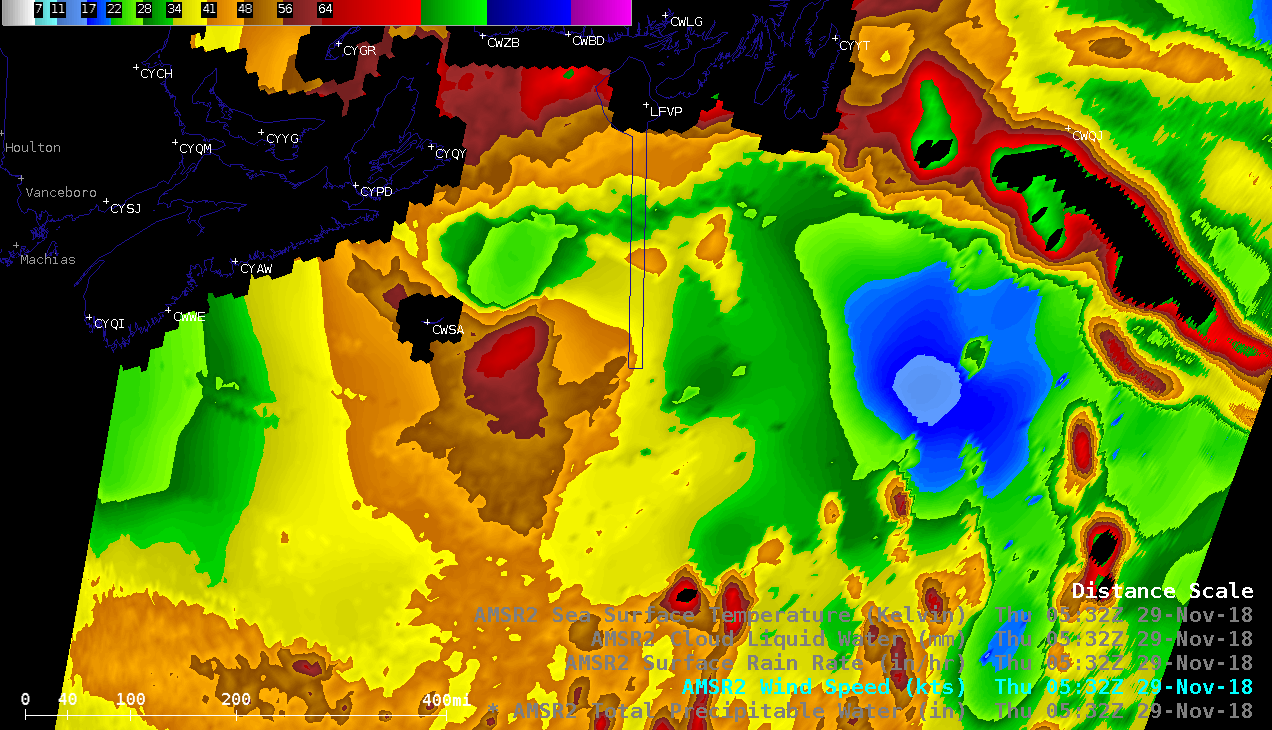
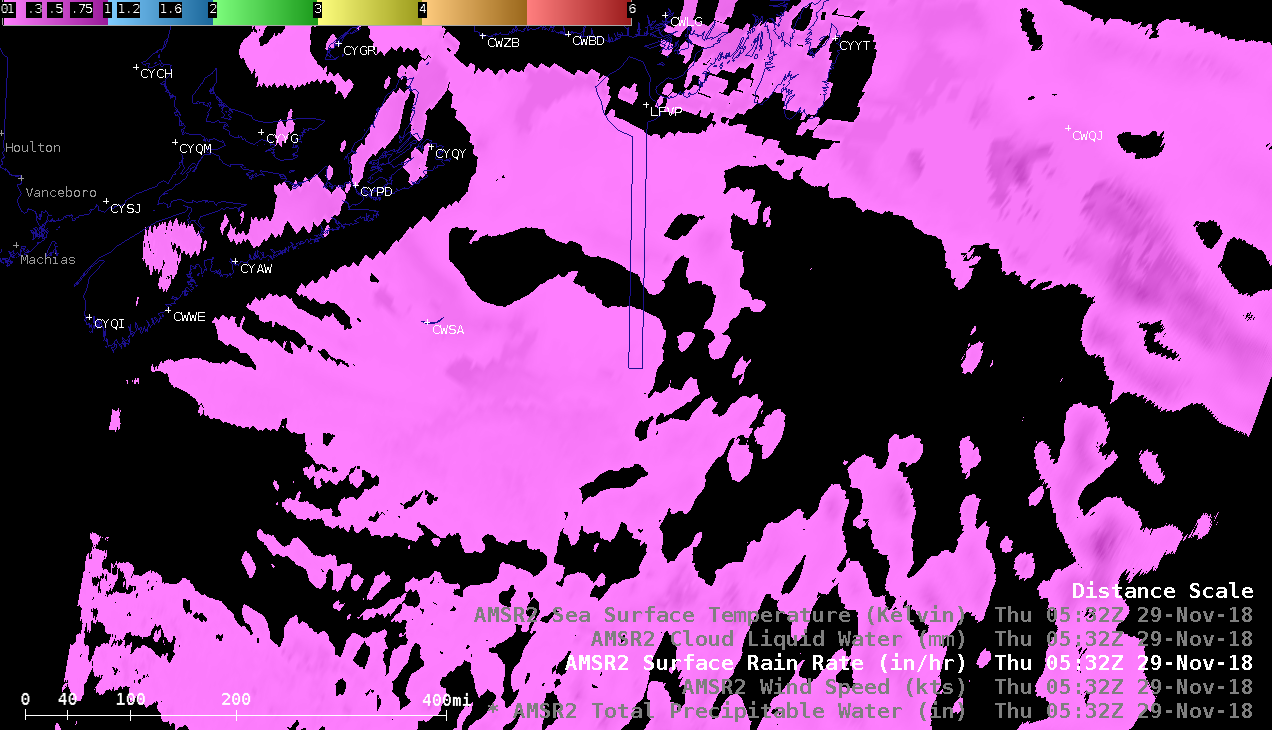
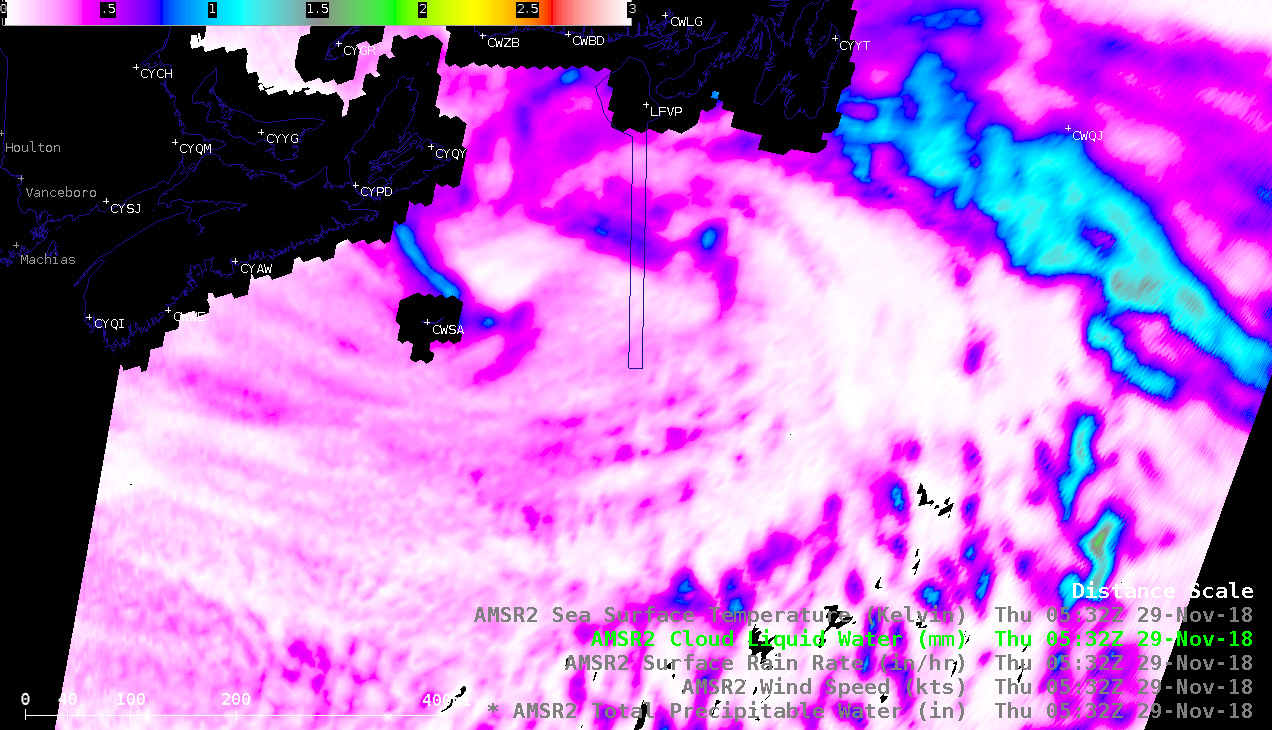
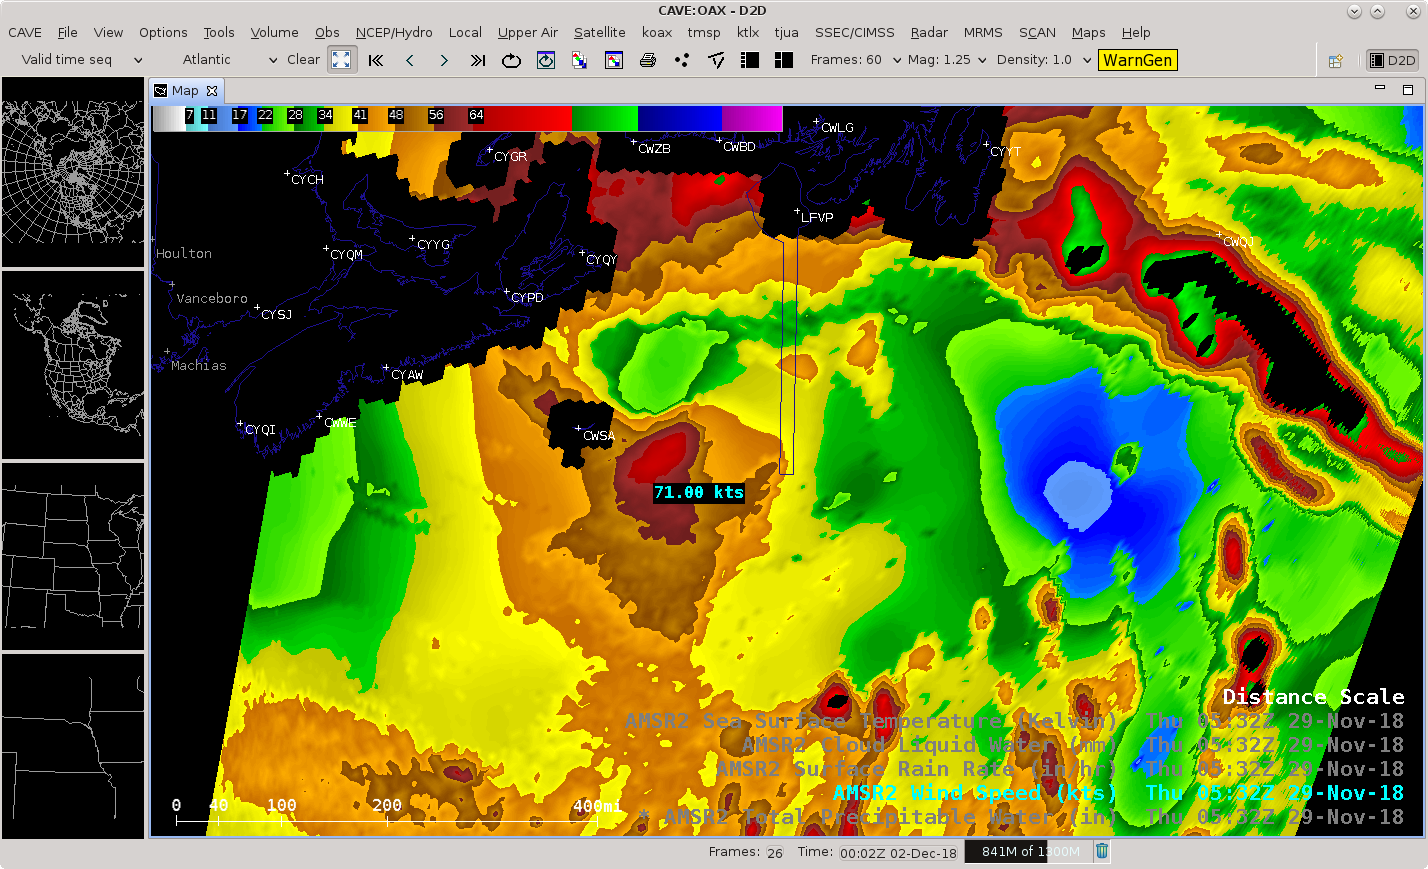
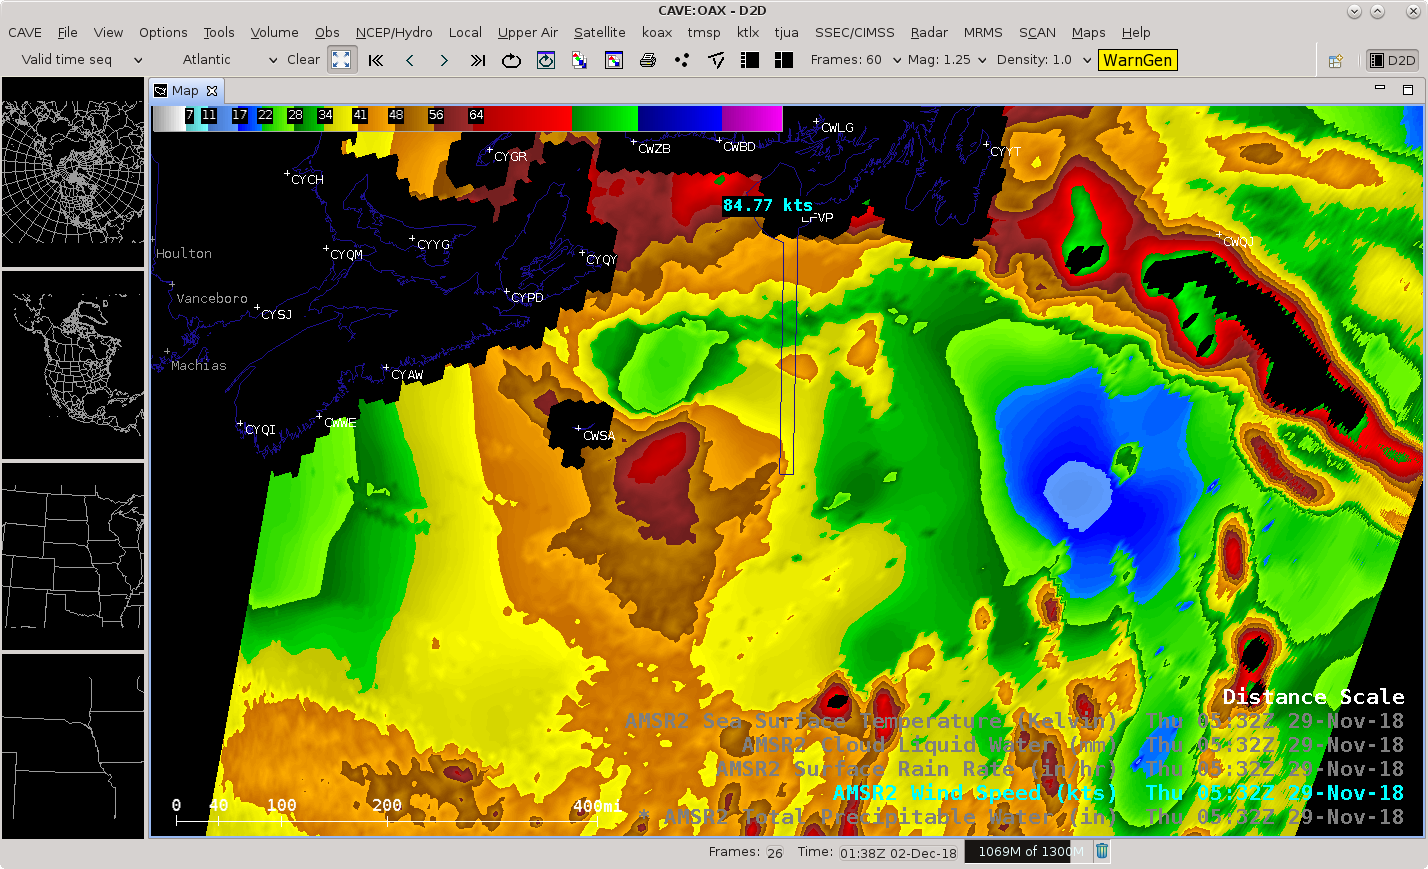
![GCOM-W1 AMSR2 Total Precipitable Water, Wind Speed, Surface Rain Rate and Cloud Liquid Water products [click to enlarge]](https://cimss.ssec.wisc.edu/satellite-blog/wp-content/uploads/sites/5/2018/11/181129_0532utc_gcomW1_amsr2_tpw_windspeed_rainRate_cloudLiquidWater_Canadian_Maritimes_anim.gif)
GCOM-W1 AMSR2 Total Precipitable Water, Wind Speed, Surface Rain Rate and Cloud Liquid Water products [click to enlarge]
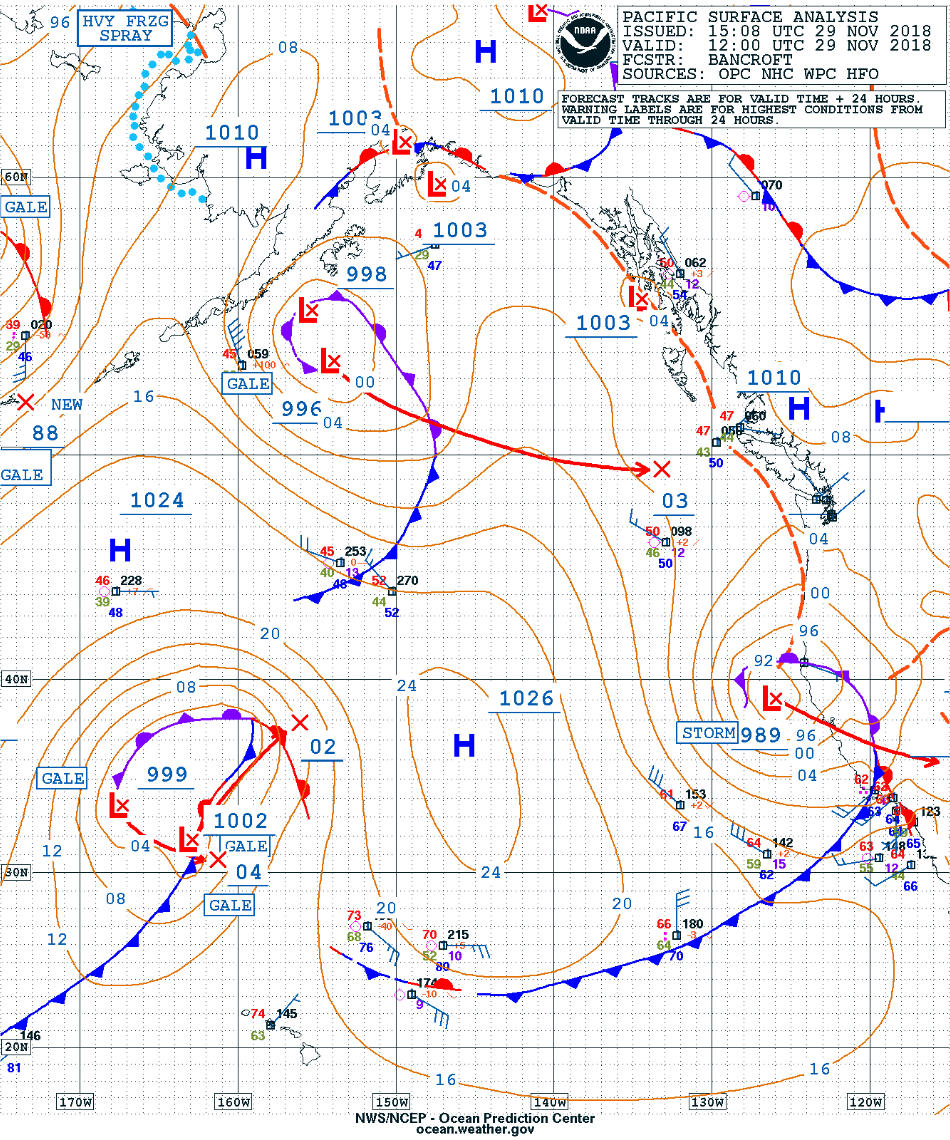
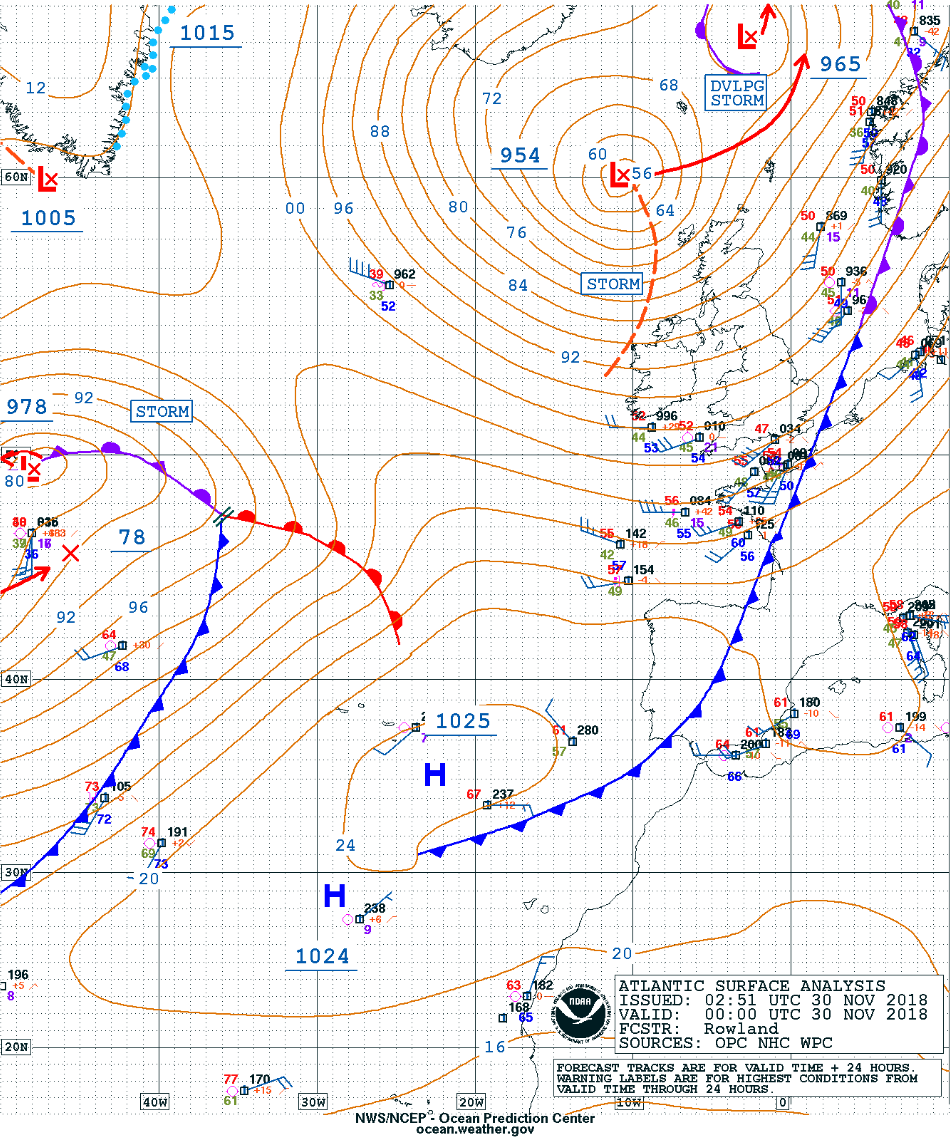
Surface analyses from the OPC (below) classified this low pressure system as Hurricane Force at 00 UTC and Storm Force at 06 UTC — however, AMSR2 ocean surface wind speeds were as high as 71 knots west of the surface low, 84.8 knots north of the low and 95.6 knots in the vicinity of the occluded front.
![Surface analyses at 00 UTC and 06 UTC [click to enlarge]](https://cimss.ssec.wisc.edu/satellite-blog/wp-content/uploads/sites/5/2018/11/181129_00utc_06utc_surface_analyses_anim.gif)
Surface analyses at 00 UTC and 06 UTC [click to enlarge]
![Aqua MODIS Water Vapor (6.7 µm) and Infrared Window (11.0 µm) images at 0543 UTC [click to enlarge]](https://cimss.ssec.wisc.edu/satellite-blog/wp-content/uploads/sites/5/2018/11/181129_0543utc_aqua_modis_waterVapor_infraredWindow_Canadian_Maritimes_anim.gif)
Aqua MODIS Water Vapor (6.7 µm) and Infrared Window (11.0 µm) images at 0543 UTC [click to enlarge]
![NOAA-20 VIIRS Day/Night Band (0.7 µm) and Infrared Window (11.45 µm) images at 0557 UTC [click to enlarge]](https://cimss.ssec.wisc.edu/satellite-blog/wp-content/uploads/sites/5/2018/11/181129_0557utc_noaa20_viirs_dayNightBand_infraredWindow_Canadian_Maritimes_anim.gif)
NOAA-20 VIIRS Day/Night Band (0.7 µm) and Infrared Window (11.45 µm) images at 0557 UTC [click to enlarge]
![GCOM-W1 AMSR2 Total Precipitable Water, Wind Speed at 0532 and 1529 UTC [click to enlarge]](https://cimss.ssec.wisc.edu/satellite-blog/wp-content/uploads/sites/5/2018/11/181129_0532utc_1520utc_gcomW1_amsr2_totalPrecipitableWater_windSpeed_Atlantic_anim.gif)
GCOM-W1 AMSR2 Total Precipitable Water and Wind Speed products at 0532 and 1529 UTC [click to enlarge]
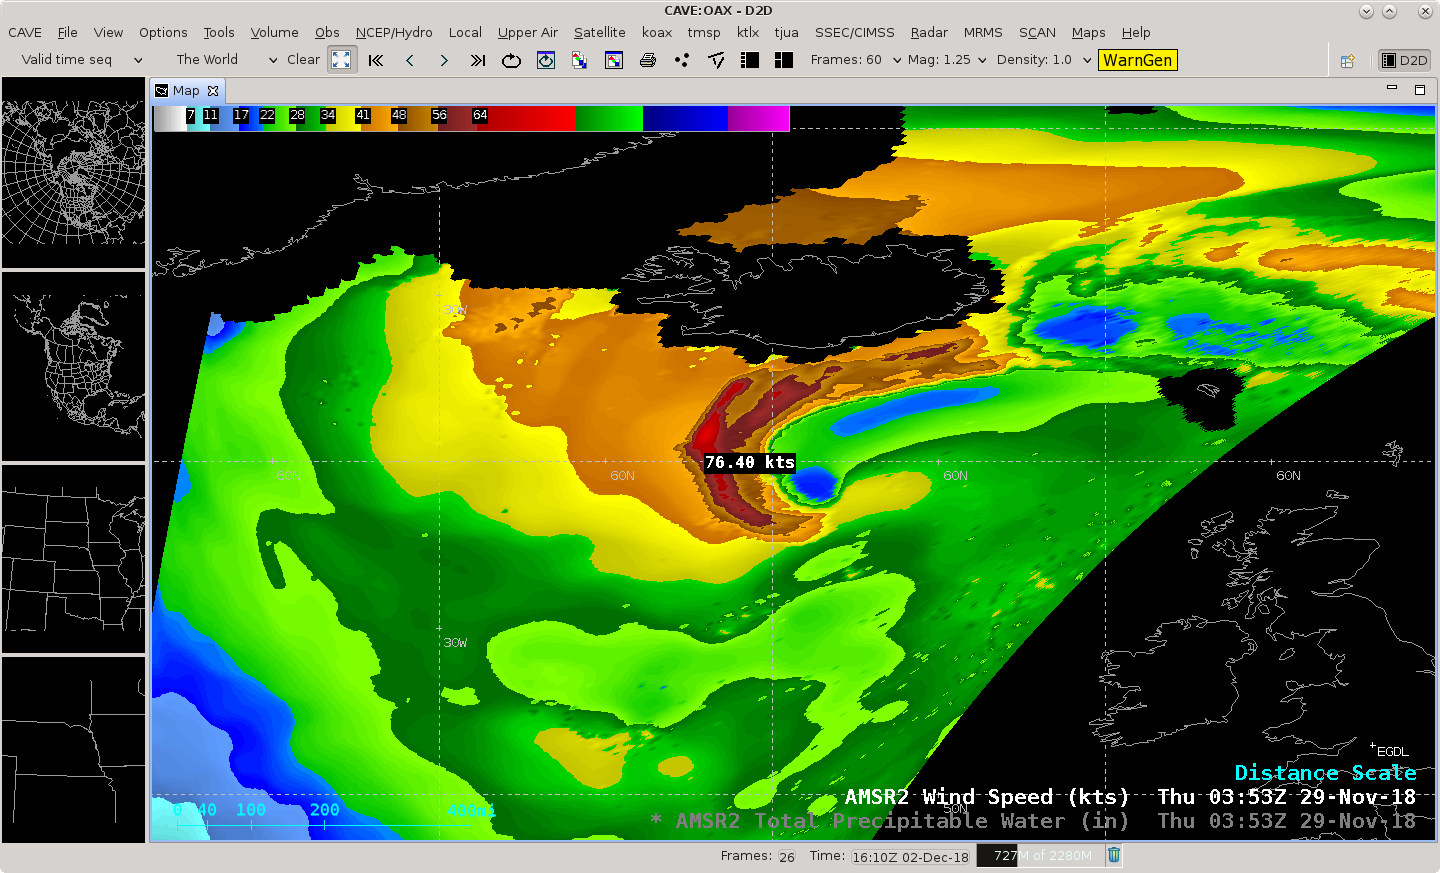
![GCOM-W1 AMSR2 Total Precipitable Water and Wind Speed products at 0353 UTC on 29 November [click to enlarge]](https://cimss.ssec.wisc.edu/satellite-blog/wp-content/uploads/sites/5/2018/11/181129_0353utc_gcomW1_amsr2_totalPrecipitableWater_windSpeed_Iceland_anim.gif)
GCOM-W1 AMSR2 Total Precipitable Water and Wind Speed products south of Iceland at 0353 UTC on 29 November [click to enlarge]
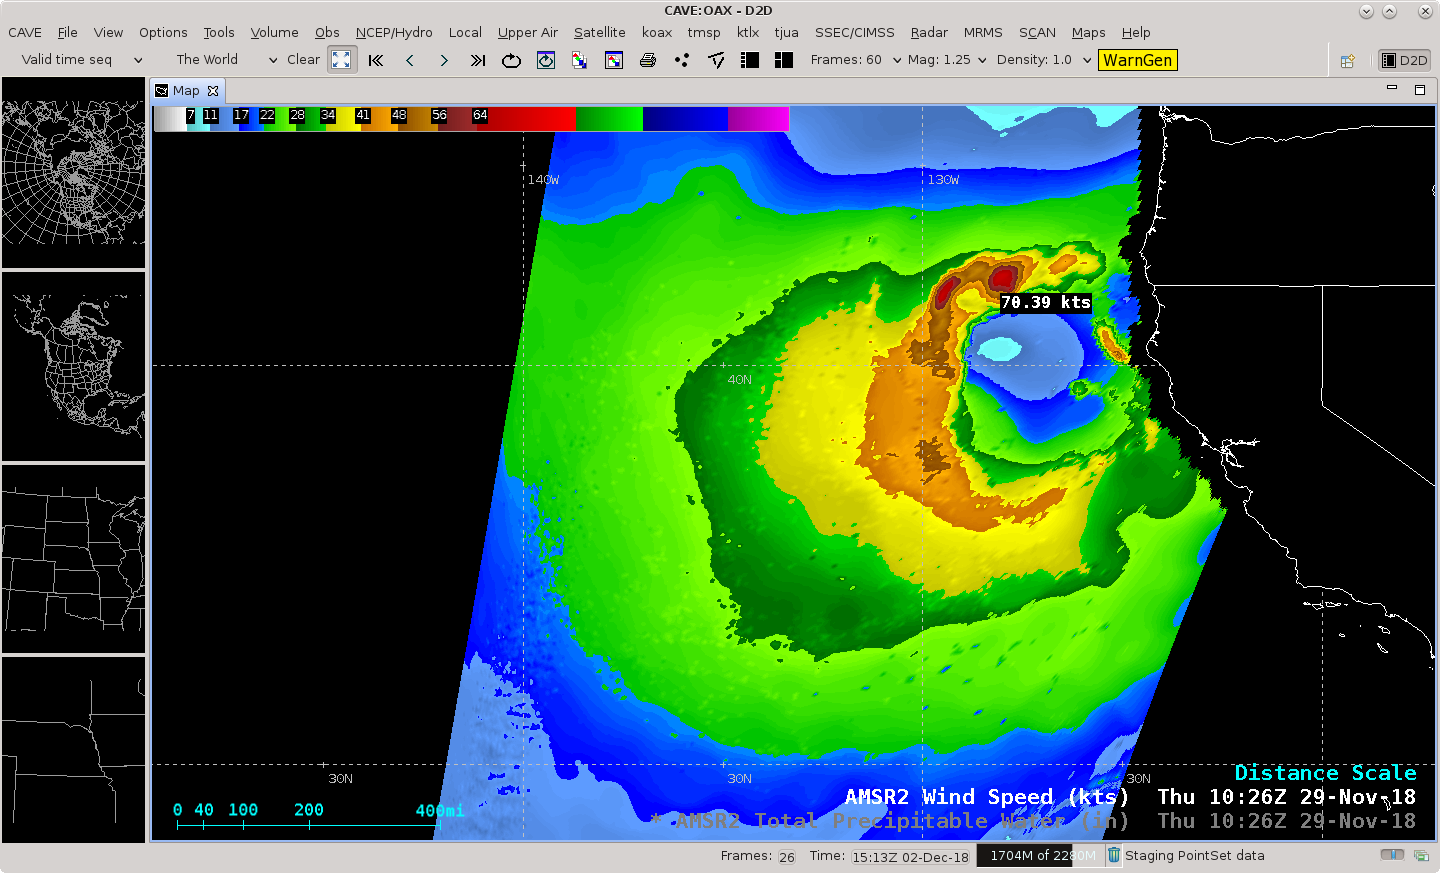
![GCOM-W1 AMSR2 Total Precipitable Water and Wind Speed products off the US West Coast at 1026 UTC on 29 November [click to enlarge]](https://cimss.ssec.wisc.edu/satellite-blog/wp-content/uploads/sites/5/2018/11/181129_1026utc_gcomW1_amsr2_totalPrecipitableWater_windSpeed_US_West_Coast_anim.gif)
GCOM-W1 AMSR2 Total Precipitable Water and Wind Speed products off the US West Coast at 1026 UTC on 29 November [click to enlarge]
![GCOM-W1 AMSR2 Total Precipitable Water and Wind Speed products north of Hawai'i at 1202 UTC on 29 November [click to enlarge]](https://cimss.ssec.wisc.edu/satellite-blog/wp-content/uploads/sites/5/2018/11/181129_1202utc_gcomW1_amsr2_totalPrecipitableWater_windSpeed_Hawaii_anim.gif)
GCOM-W1 AMSR2 Total Precipitable Water and Wind Speed products north of Hawai’i at 1202 UTC on 29 November [click to enlarge]
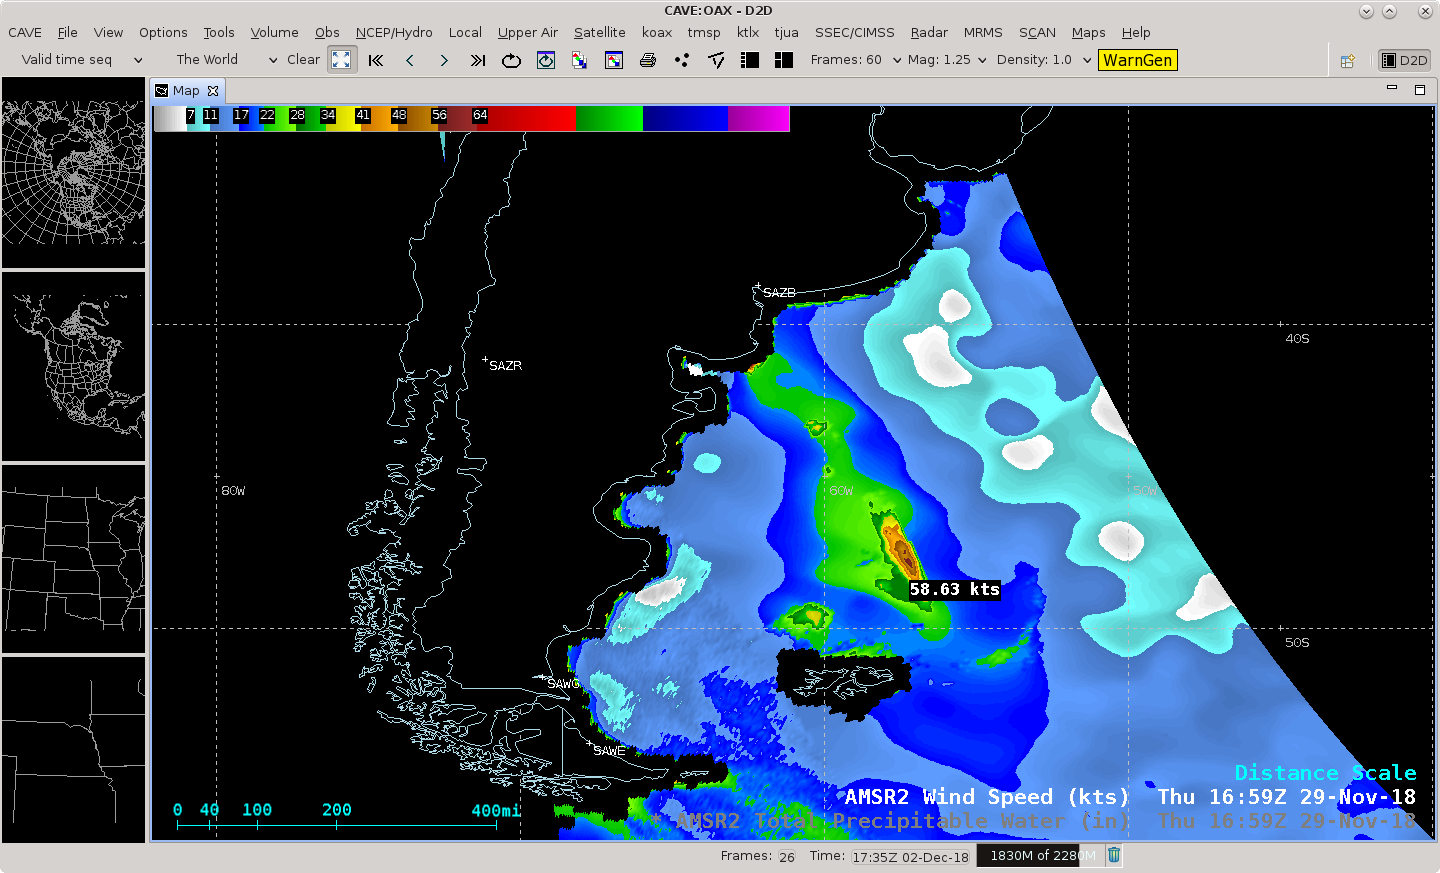
![GCOM-W1 AMSR2 Total Precipitable Water and Wind Speed products southwest of Australia at 1659 UTC on 29 November [click to enlarge]](https://cimss.ssec.wisc.edu/satellite-blog/wp-content/uploads/sites/5/2018/11/181129_1659utc_gcomW1_amsr2_totalPrecipitableWater_windSpeed_Australia_anim.gif)
GCOM-W1 AMSR2 Total Precipitable Water and Wind Speed products southwest of Australia at 1659 UTC on 29 November [click to enlarge]
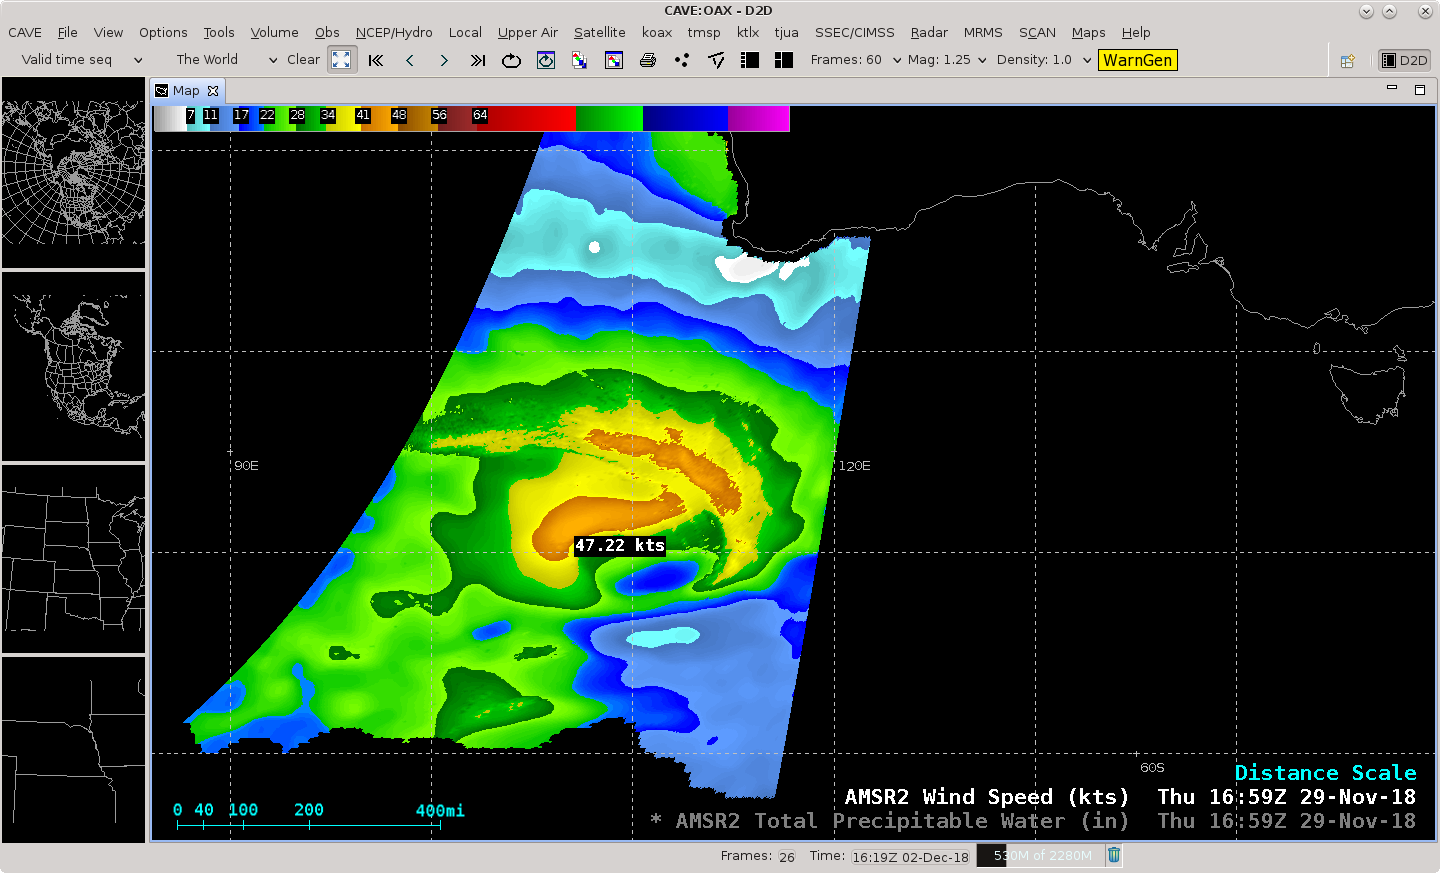
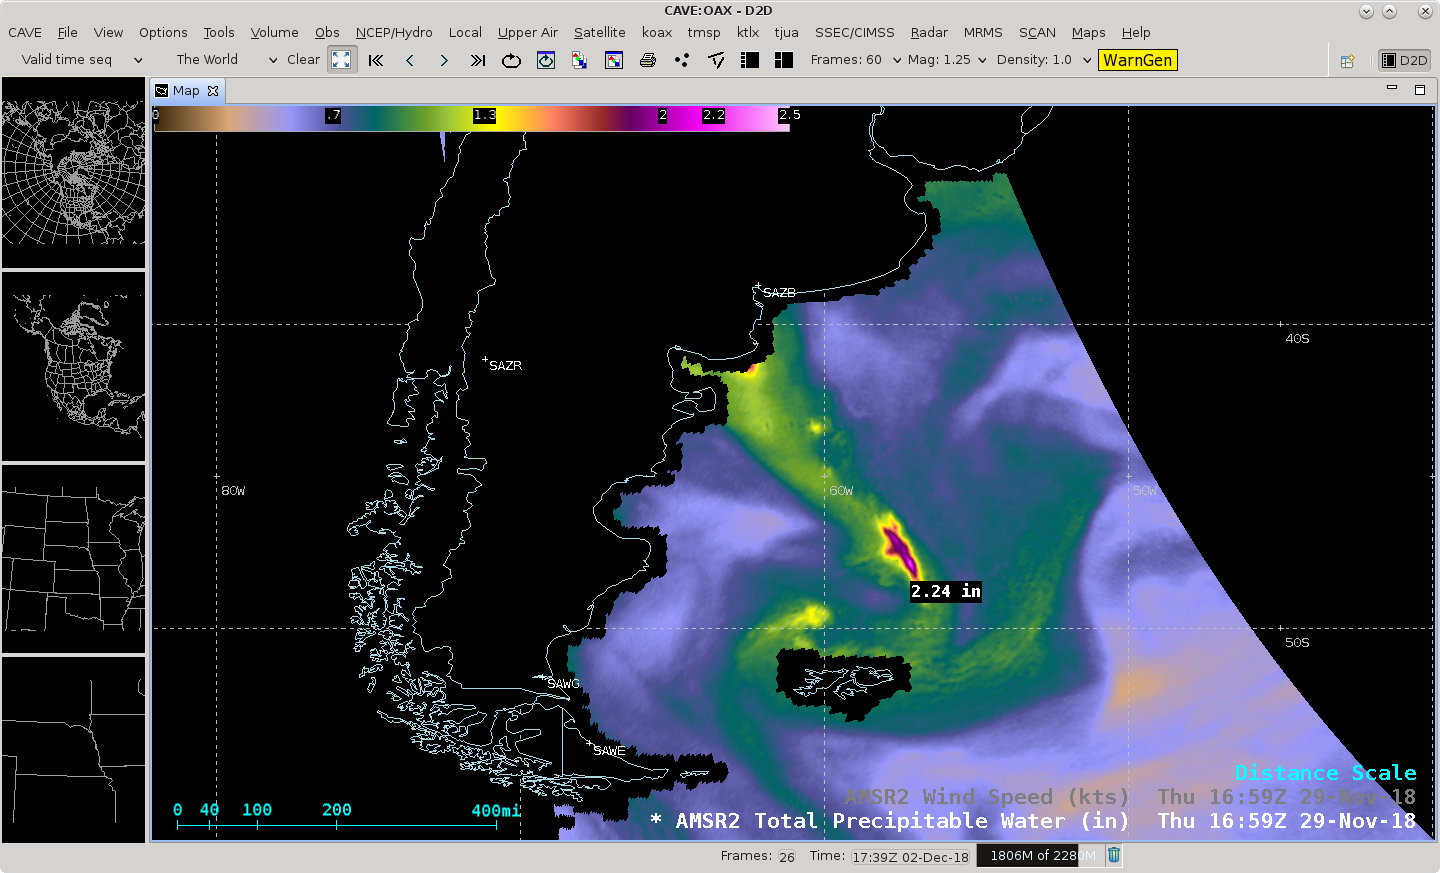
![GCOM-W1 AMSR2 Total Precipitable Water and Wind Speed products southeast of Argentina at 1659 UTC on 29 November [click to enlarge]](https://cimss.ssec.wisc.edu/satellite-blog/wp-content/uploads/sites/5/2018/11/181129_1659utc_181129_1659utc_gcomW1_amsr2_totalPrecipitableWater_windSpeed_Argentina_anim.gif)
GCOM-W1 AMSR2 Total Precipitable Water and Wind Speed products southeast of Argentina at 1659 UTC on 29 November [click to enlarge]
![GCOM-W1 AMSR2 Total Precipitable Water and Wind Speed products over the North Sea at 0259 UTC on 30 November [click to enlarge]](https://cimss.ssec.wisc.edu/satellite-blog/wp-content/uploads/sites/5/2018/11/181130_0259utc_gcomW1_amsr2_totalPrecipitableWater_windSpeed_North_Sea_anim.gif)
GCOM-W1 AMSR2 Total Precipitable Water and Wind Speed products over the Norwegian Sea at 0259 UTC on 30 November [click to enlarge]
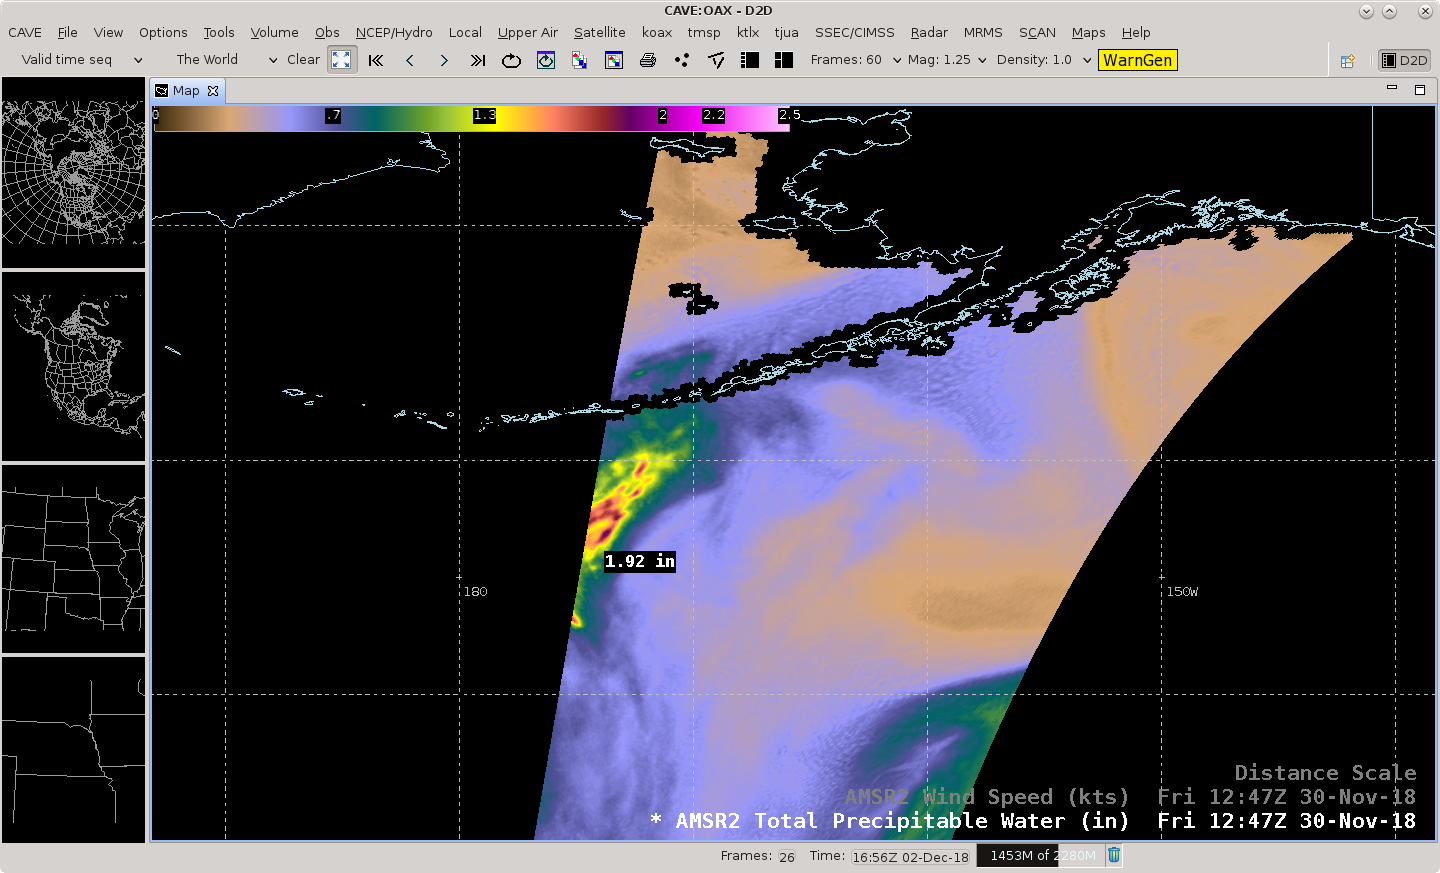
![GCOM-W1 AMSR2 Total Precipitable Water and Wind Speed products over the Aleutian Islands at 1247 UTC on 30 November [click to enlarge]](https://cimss.ssec.wisc.edu/satellite-blog/wp-content/uploads/sites/5/2018/11/181130_1247utc_gcomW1_amsr2_totalPrecipitableWater_windSpeed_Aleutians_anim.gif)
GCOM-W1 AMSR2 Total Precipitable Water and Wind Speed products over the Aleutian Islands at 1247 UTC on 30 November [click to enlarge]
Due to the frequent overlap of polar-orbiting satellite swaths at high latitudes, some locations can have data coverage from numerous consecutive overpasses. The example below shows the Barents Sea — between 70-80º N latitude — during 7 consecutive swaths from 2256 UTC on 28 November to 0847 UTC on 29 November.
![GCOM-W1 AMSR2 Total Precipitable Water and Wind Speed products over the Barents Sea from 2256 UTC on 28 November to 0847 UTC on 29 November [click to enlarge]](https://cimss.ssec.wisc.edu/satellite-blog/wp-content/uploads/sites/5/2018/11/181128_181129_gcomW1_amsr2_totalPrecipitableWater_windSpeed_Barents_Sea_anim.gif)
GCOM-W1 AMSR2 Total Precipitable Water and Wind Speed products over the Barents Sea from 2256 UTC on 28 November to 0847 UTC on 29 November [click to enlarge]