Train of standing waves south of Hawai’i
![GOES-17 Low-level (7.3 µm), Mid-level (6.9 µm) and Upper-level (6.2 µm) Water Vapor images [click to play animation | MP4]](https://cimss.ssec.wisc.edu/satellite-blog/wp-content/uploads/sites/5/2018/11/181125_goes17_waterVapor_standing_waves_Hawaii_anim.gif)
GOES-17 Low-level (7.3 µm), Mid-level (6.9 µm) and Upper-level (6.2 µm) Water Vapor images [click to play animation | MP4]
* GOES-17 images shown here are preliminary and non-operational *
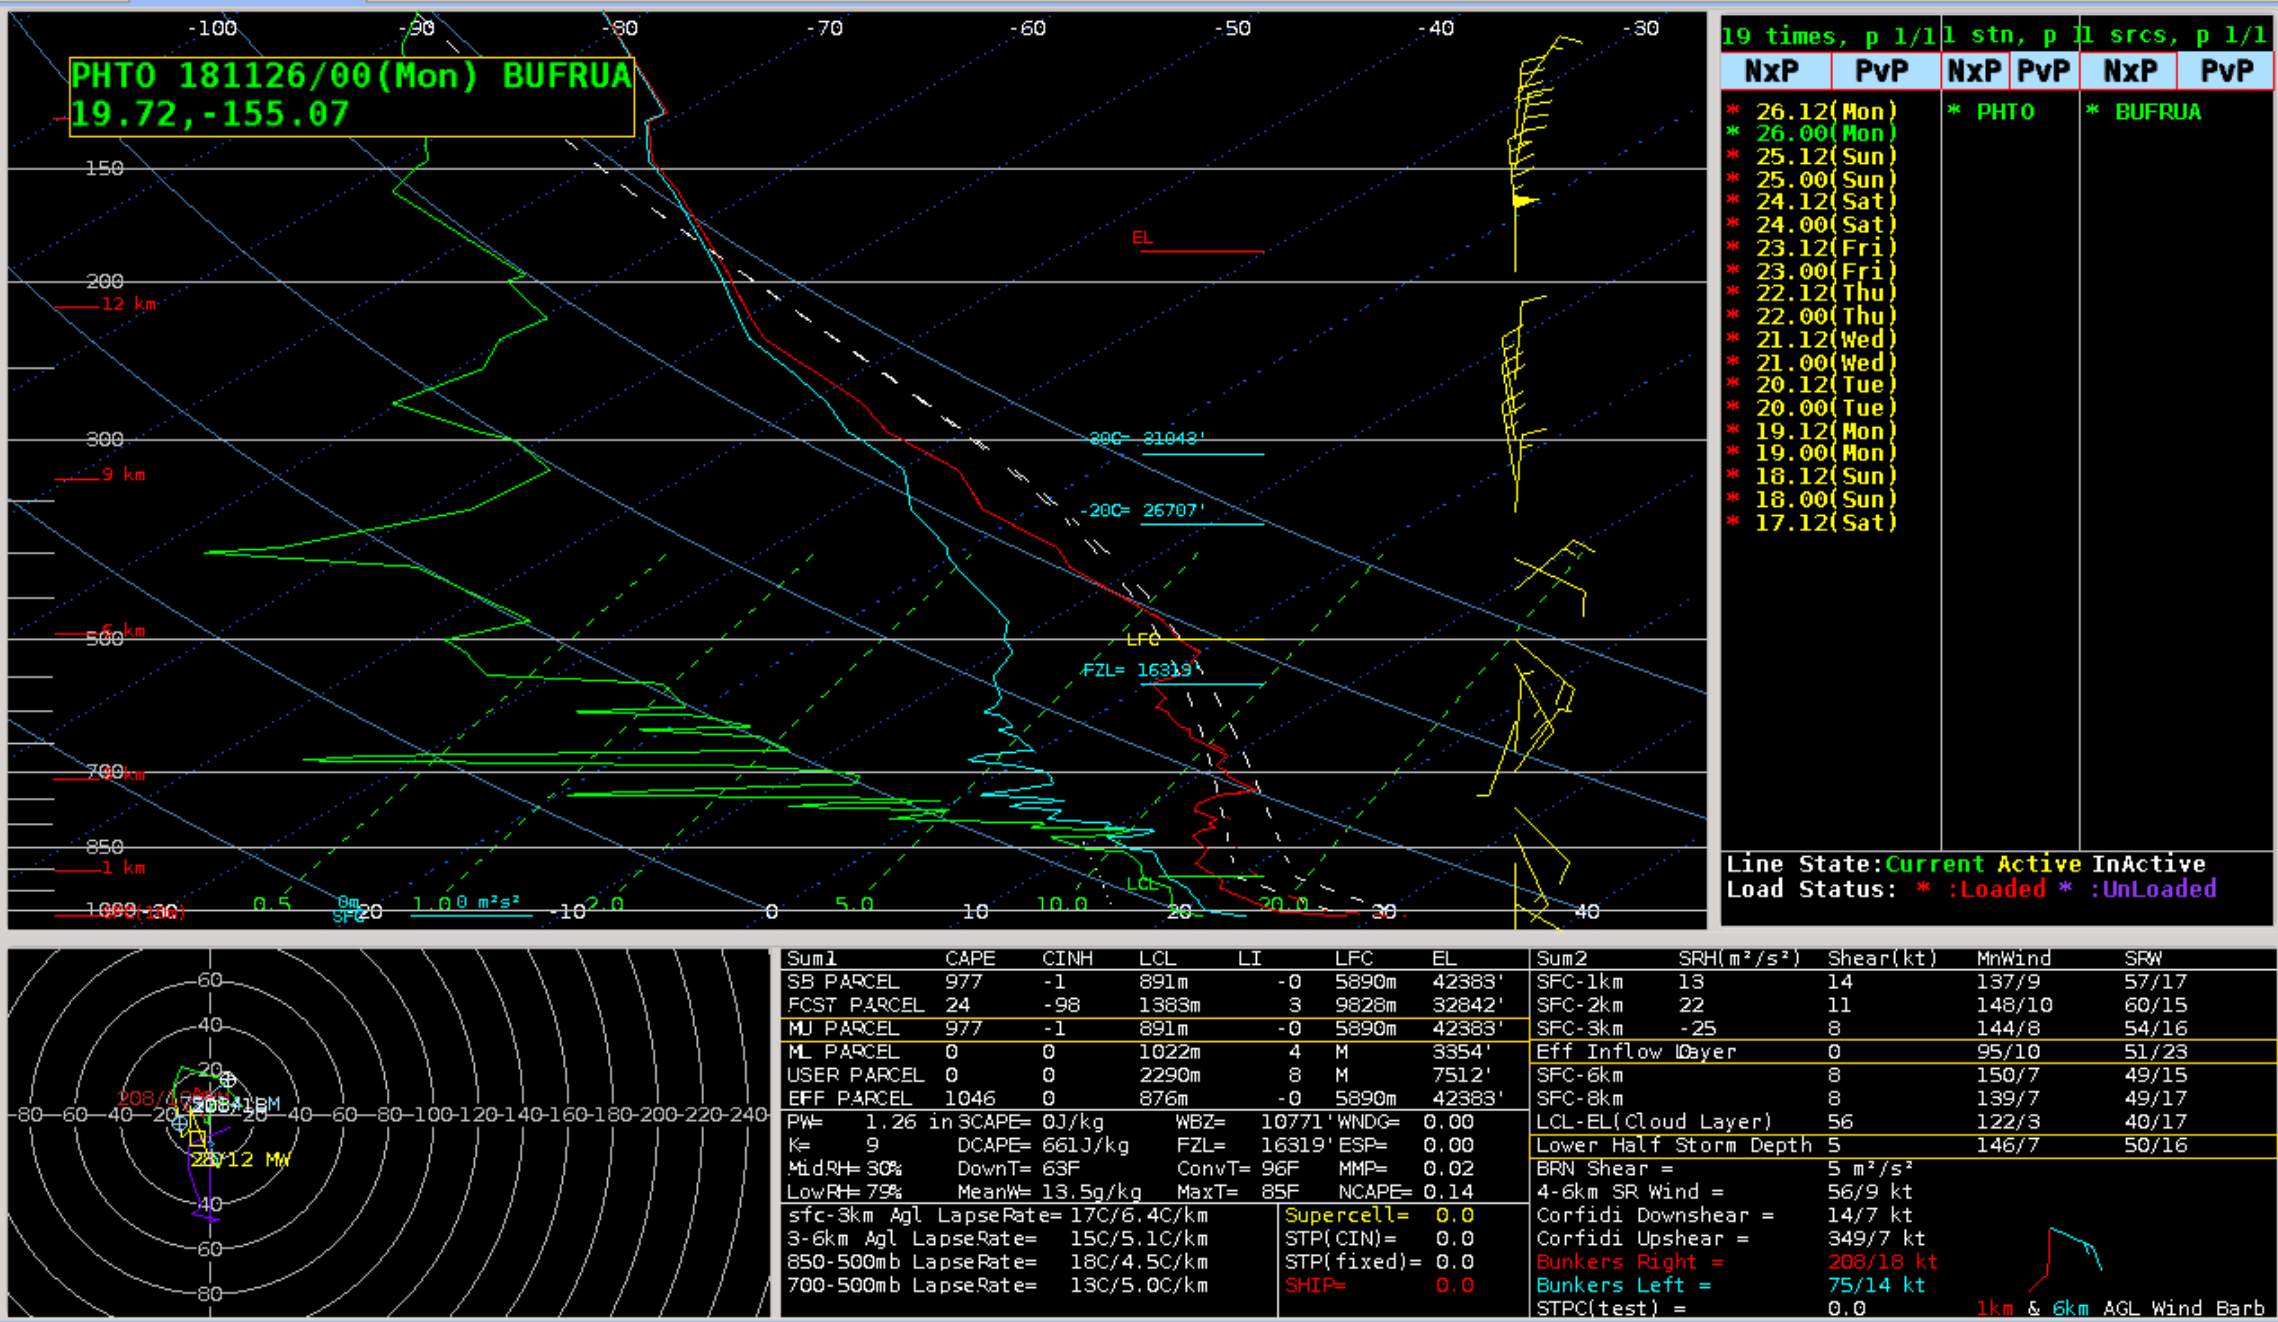
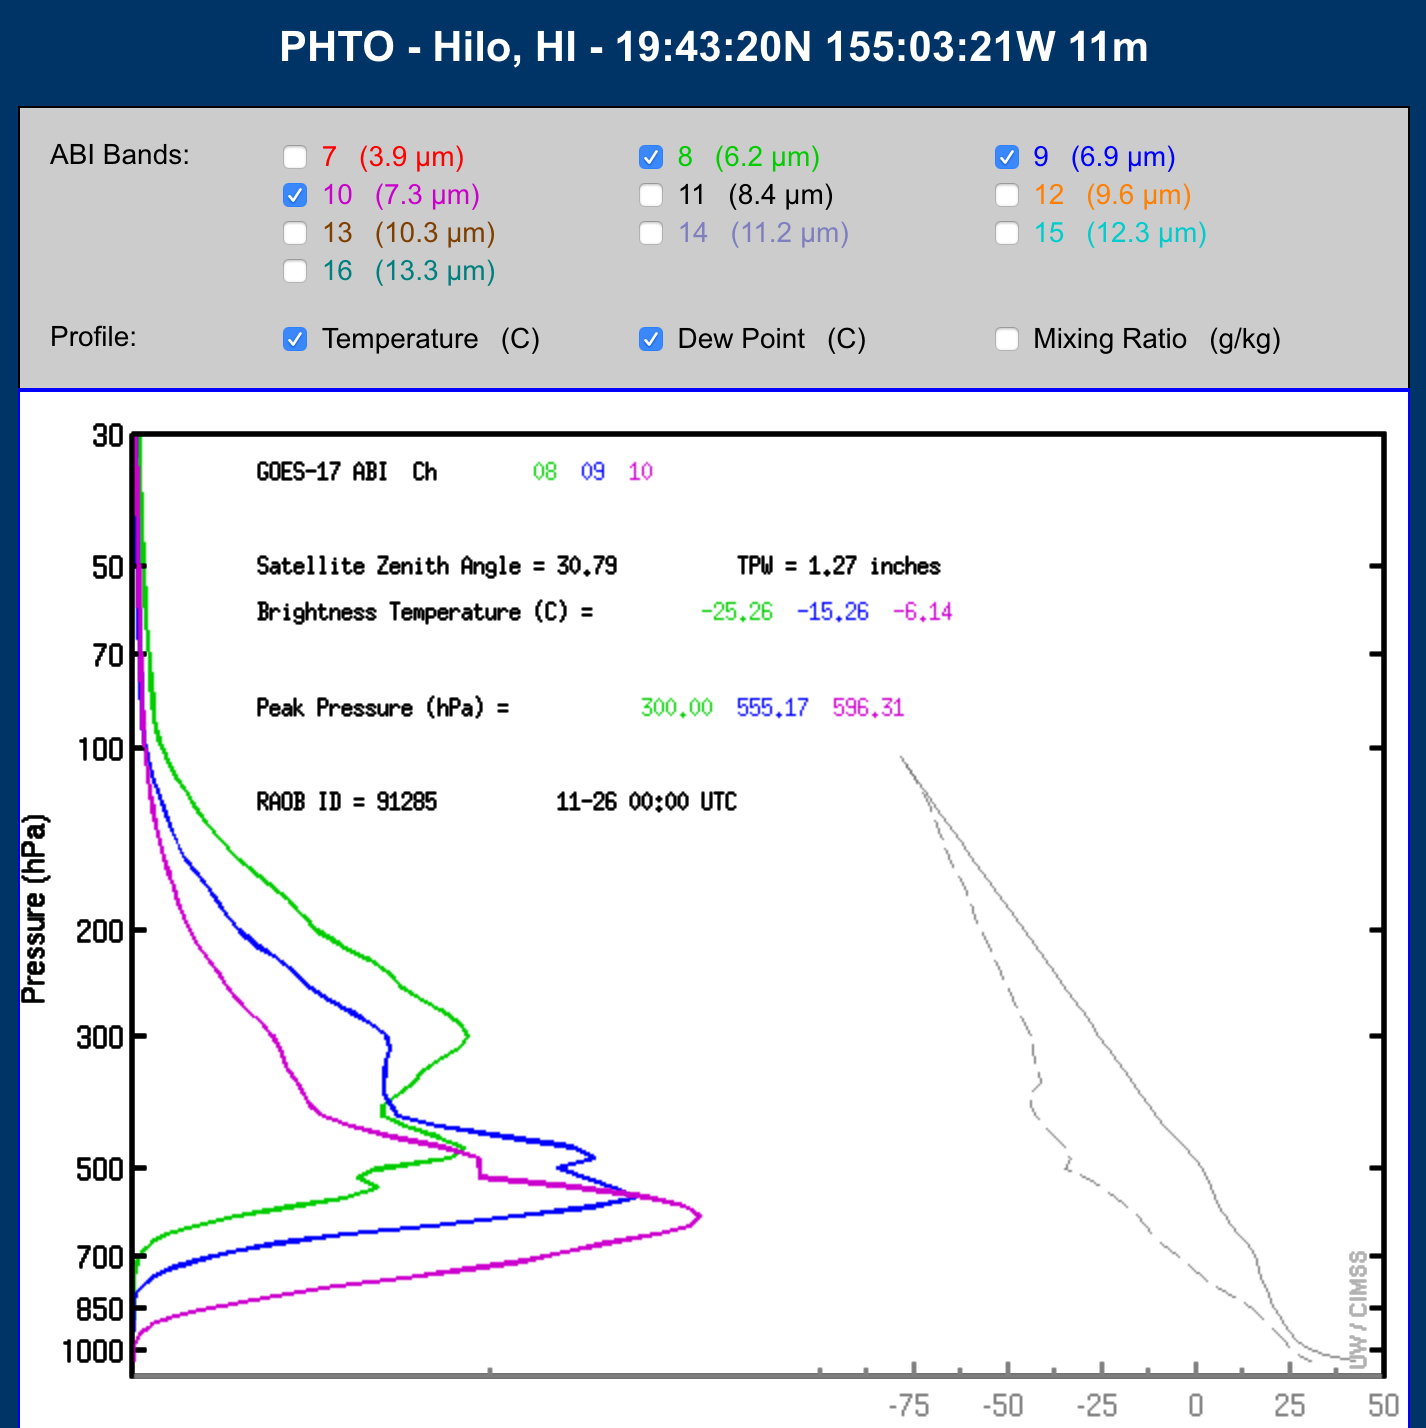
GOES-17 Low-level (7.3 µm), Mid-level (6.9 µm) and Upper-level (6.2 µm) Water Vapor images (above) revealed an interesting train of standing waves about 100-150 miles south of the Big Island of Hawai’i on 25 November 2018. With the presence of moisture aloft, the 3 water vapor weighting functions — calculated using the 00 UTC Hilo sounding — were shifted to high enough altitudes to eliminate the sensing of radiation from features in the lower troposphere. There were no pilot reports of turbulence in the vicinity of these standing waves — but they were located outside of the primary commercial air traffic corridors to/from the islands.
GOES-17 “Clean” Infrared Window (10.3 µm) and Near-Infrared “Cirrus” (1.37 µm) images (below) showed that these wave clouds were radiometrically transparent to longwave thermal energy being emitted from/near the surface — note that marine boundary layer stratocumulus clouds could be seen drifting westward within the easterly trade wind flow. As a result, the satellite-sensed 10.3 µm infrared brightness temperatures of the standing wave clouds were significantly warmer than that of the air at higher altitudes where they existed. These standing wave cloud features were, however, very apparent in 1.37 µm Cirrus imagery, along with what appeared to be other thin filaments of cirrus cascading southward overhead. The southward motion of the features seen on Cirrus imagery suggests that they existed at pressure levels of 370 hPa (26,900 feet / 8.2 km) or higher — altitudes where northerly winds were found on the Hilo sounding.
![GOES-17 "Clean" Infrared Window (10.3 µm) and Near-Infrared "Cirrus" (1.37 µm) images [click to play animation | MP4]](https://cimss.ssec.wisc.edu/satellite-blog/wp-content/uploads/sites/5/2018/11/181125_goes17_infraredWindow_nearInfraredCirrus_standing_waves_Hawaii_anim.gif)
GOES-17 “Clean” Infrared Window (10.3 µm) and Near-Infrared “Cirrus” (1.37 µm) images [click to play animation | MP4]
![GOES-17 images of all 16 ABI bands [click to play animation | MP4]](https://cimss.ssec.wisc.edu/satellite-blog/wp-content/uploads/sites/5/2018/11/181125_goes17_16panel_standing_waves_HI_anim.gif)
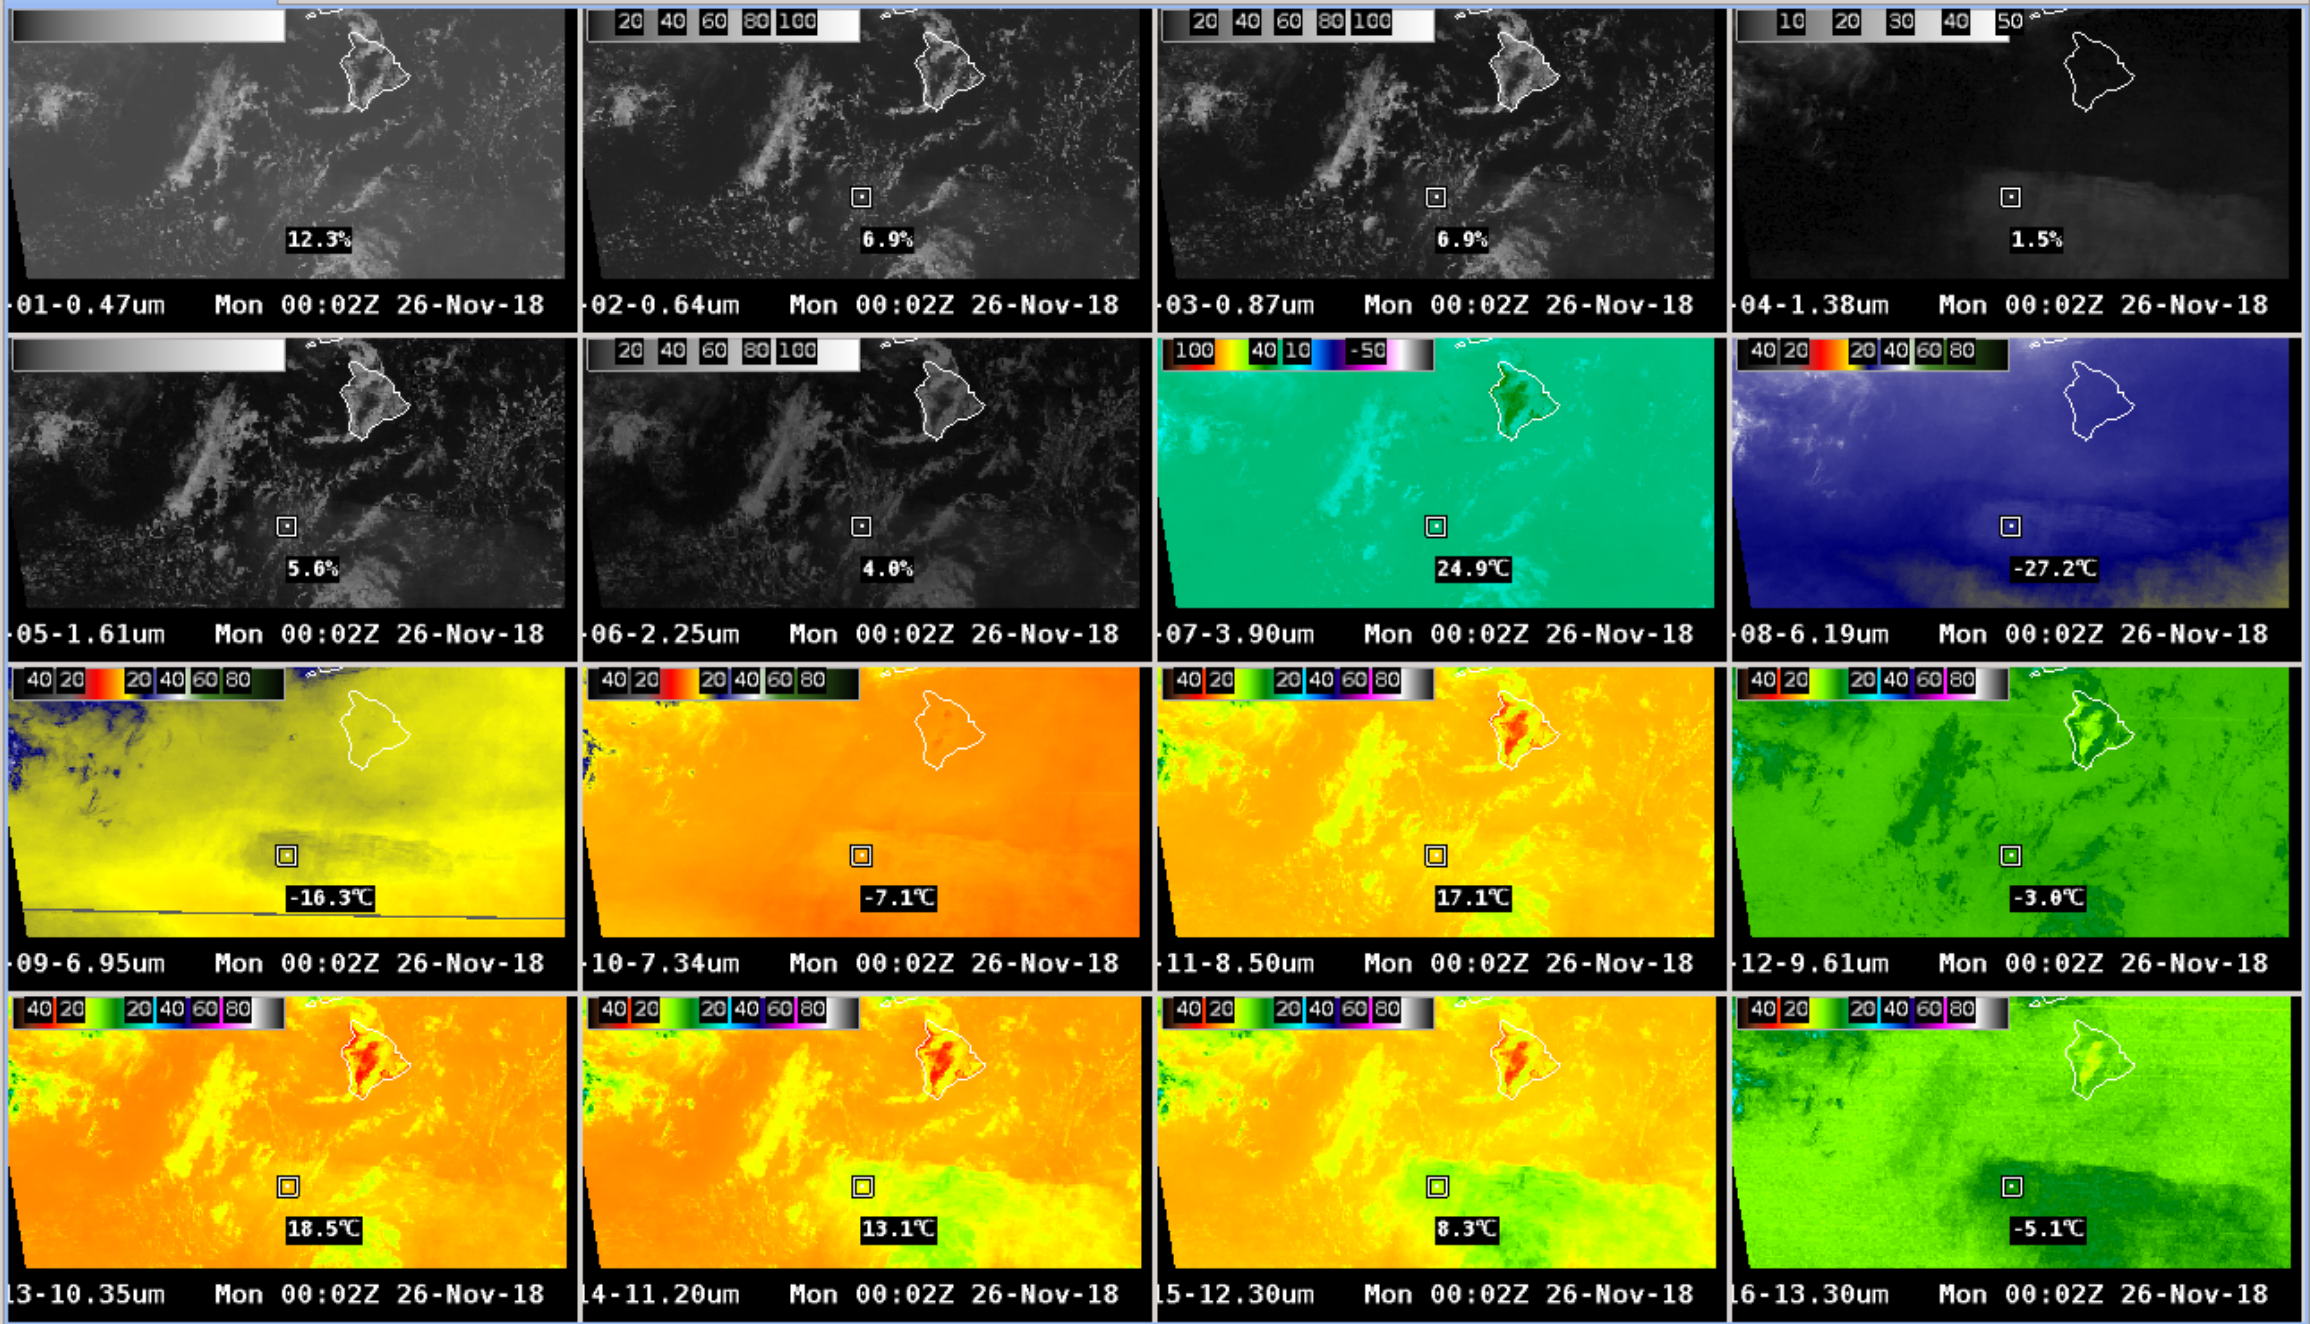
GOES-17 images of all 16 ABI spectral bands [click to play animation | MP4]
![GOES-15 Water Vapor (6.5 µm, keft), Infrared Window (10.7 µm, center) and Infraered CO2 (13.3 µm, right) images [click to play animation | MP4]](https://cimss.ssec.wisc.edu/satellite-blog/wp-content/uploads/sites/5/2018/11/181125_goes15_waterVapor_infraredWindow_infraredCO2_HI_anim.gif)
GOES-15 Water Vapor (6.5 µm, keft), Infrared Window (10.7 µm, center) and Infraered CO2 (13.3 µm, right) images [click to play animation | MP4]
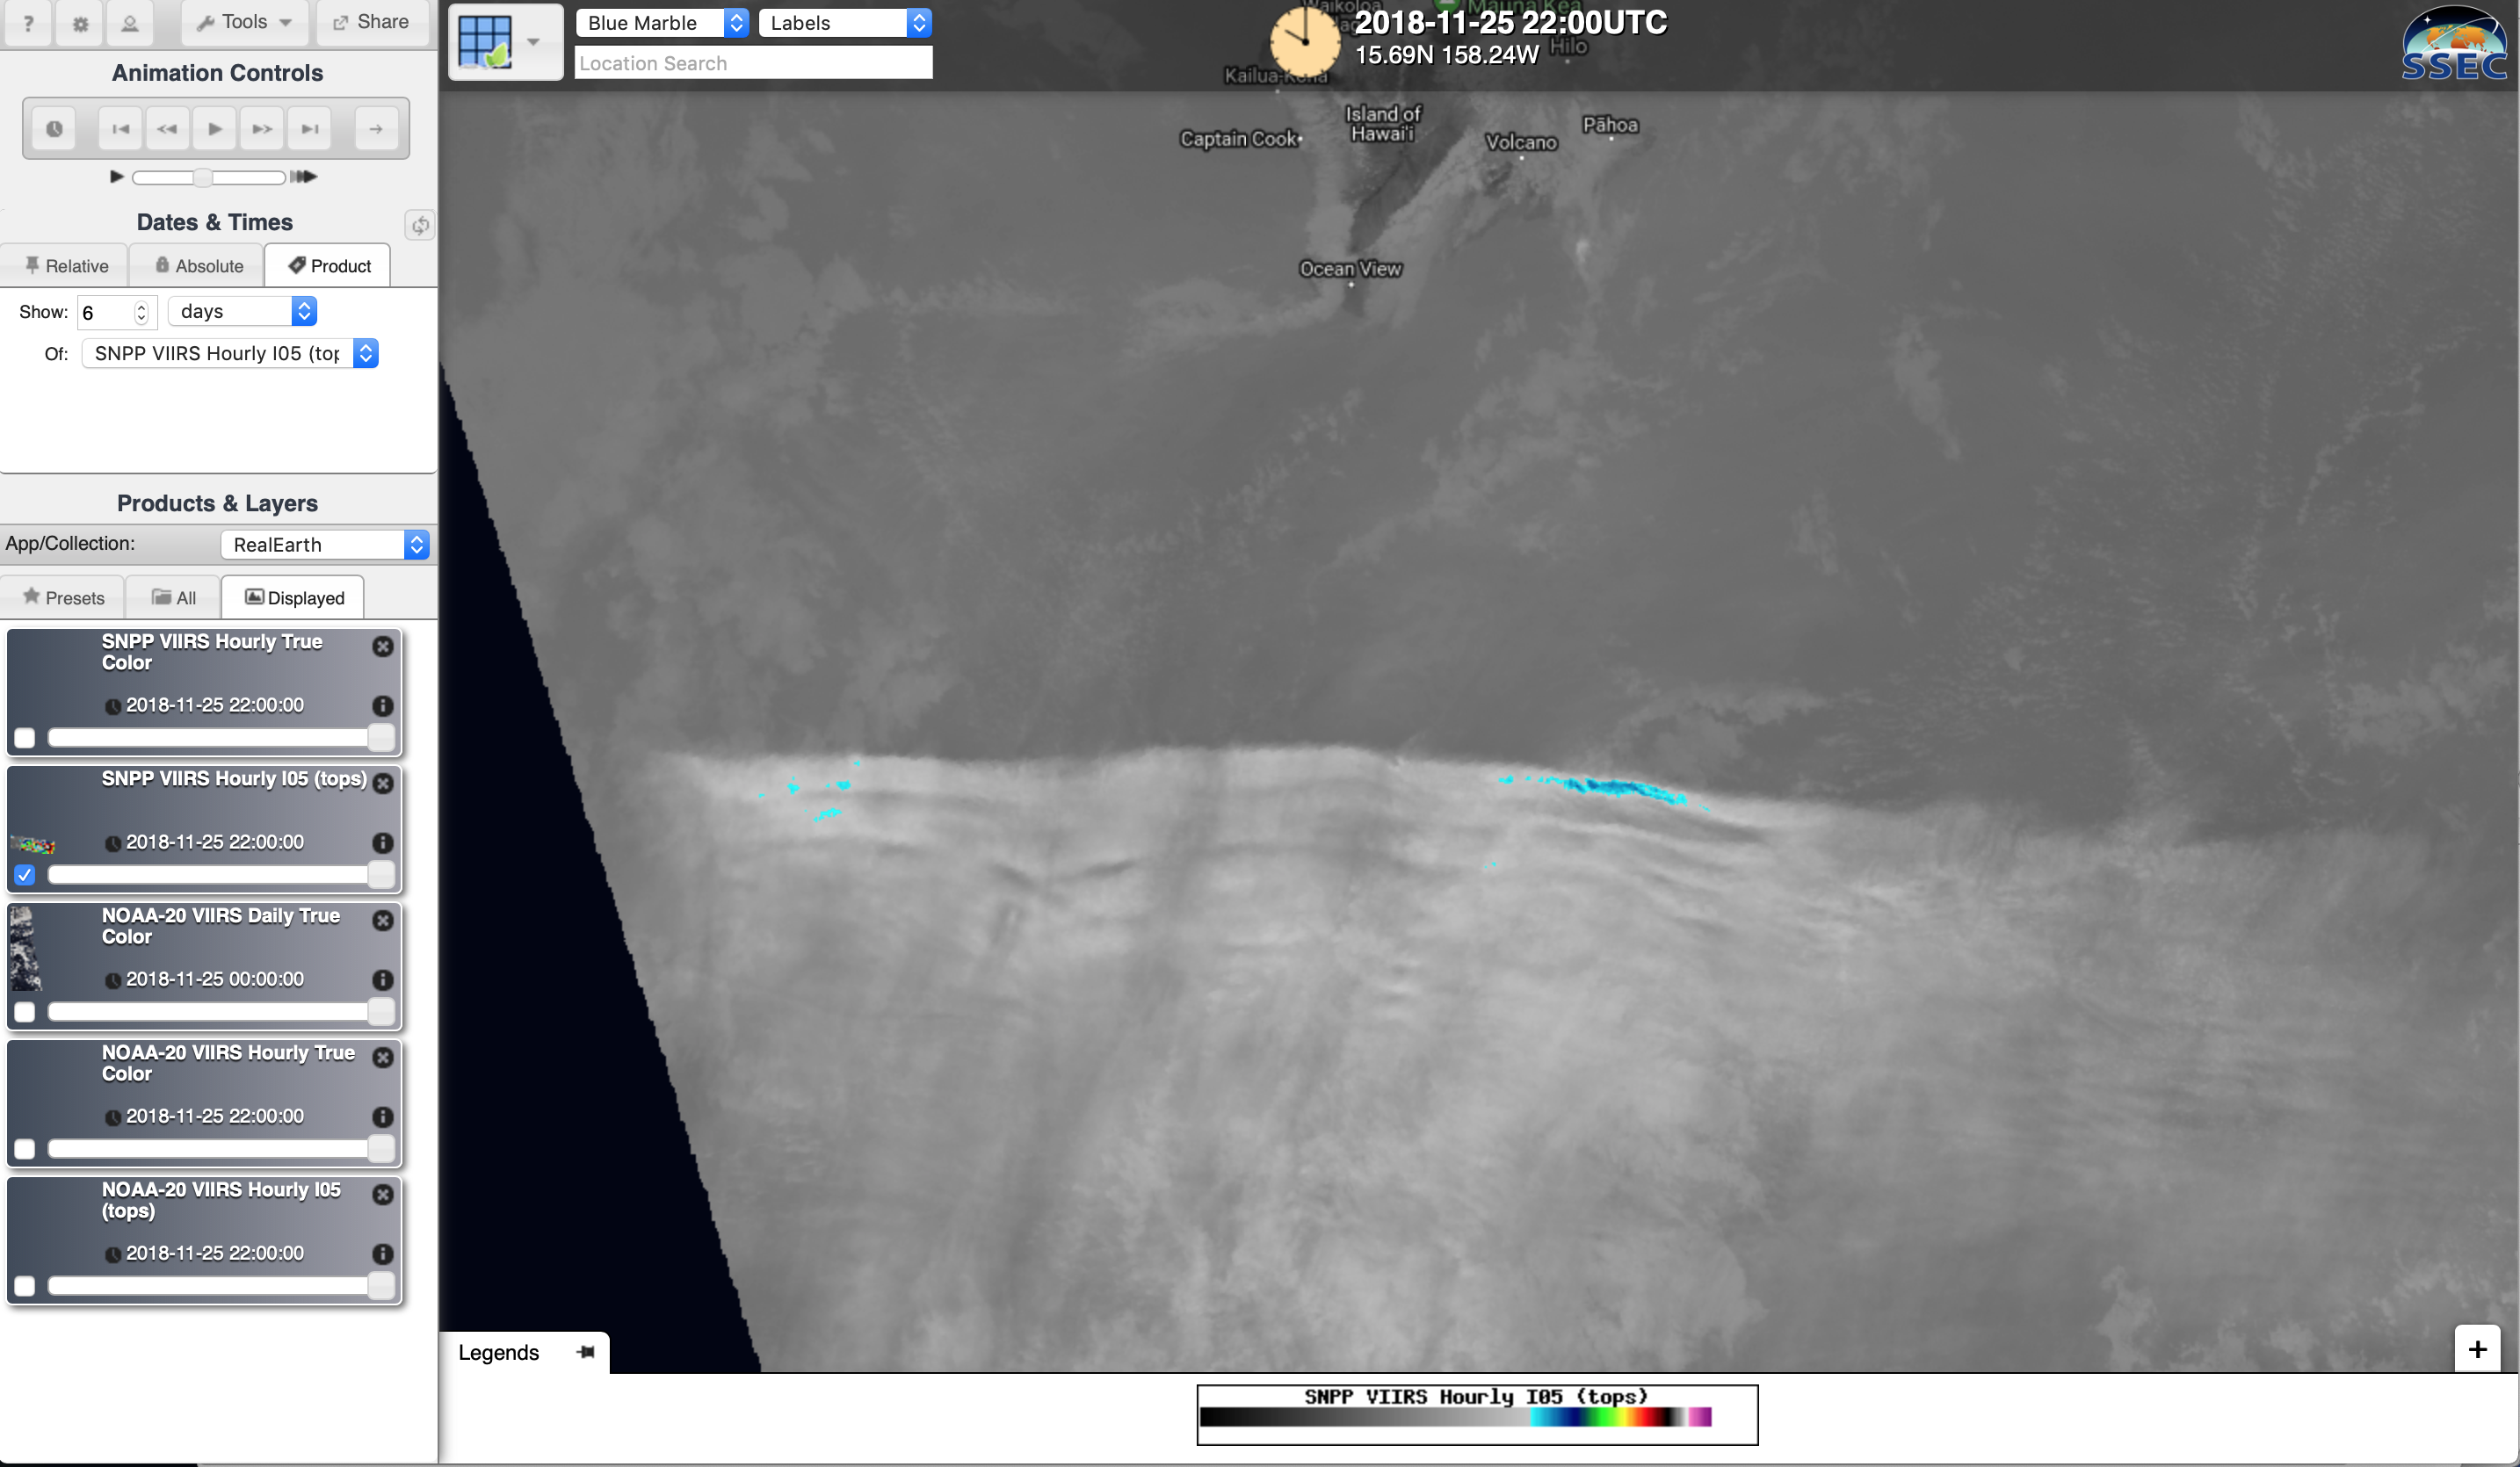
![Suomi NPP VIIRS True Color RGB and Infrared Window (11.45 µm) images at 2256 UTC [click to enlarge]](https://cimss.ssec.wisc.edu/satellite-blog/wp-content/uploads/sites/5/2018/11/181125_2246utc_snpp_viirs_truecolor_infraredWindow_HI_anim.gif)
Suomi NPP VIIRS True Color RGB and Infrared Window (11.45 µm) images at 2256 UTC [click to enlarge]
![NOAA-20 VIIRS True Color RGB and Infrared Window (11.45 µm) images at 2336 UTC [click to enlarge]](https://cimss.ssec.wisc.edu/satellite-blog/wp-content/uploads/sites/5/2018/11/181125_2336utc_noaa20_viirs_truecolor_infraredWindow_HI_anim.gif)
NOAA-20 VIIRS True Color RGB and Infrared Window (11.45 µm) images at 2336 UTC [click to enlarge]
![Suomi NPP VIIRS True Color RGB and Infrared Window (11.45 µm) images at 0028 UTC [click to enlarge]](https://cimss.ssec.wisc.edu/satellite-blog/wp-content/uploads/sites/5/2018/11/181126_0028utc_snpp_viirs_truecolor_infraredWindow_HI_anim.gif)
Suomi NPP VIIRS True Color RGB and Infrared Window (11.45 µm) images at 0028 UTC [click to enlarge]
![Terra MODIS True Color RGB image and retrievals of Cloud Phase, Cloud Top Temperature, Cloud Top Height and Cloud Top Pressure at 2043 UTC [click to enlarge]](https://cimss.ssec.wisc.edu/satellite-blog/wp-content/uploads/sites/5/2018/11/181125_2043utc_terra_modis_truecolor_cloudPhase_cloudTopTemperature_cloudTopHeight_cloudTopPressure_HI_anim.gif)
Terra MODIS True Color RGB image and retrievals of Cloud Phase, Cloud Top Temperature, Cloud Top Height and Cloud Top Pressure at 2043 UTC [click to enlarge]
![Aqua MODIS True Color RGB image and retrievals of Cloud Phase, Cloud Top Temperature, Cloud Top Height and Cloud Top Pressure at 2347 UTC [click to enlarge]](https://cimss.ssec.wisc.edu/satellite-blog/wp-content/uploads/sites/5/2018/11/181125_2347utc_aqua_modis_truecolor_cloudPhase_cloudTopTemperature_cloudTopHeight_cloudTopPressure_HI_anim.gif)
Aqua MODIS True Color RGB image and retrievals of Cloud Phase, Cloud Top Temperature, Cloud Top Height and Cloud Top Pressure at 2347 UTC [click to enlarge]
![GOES-17 Cloud Type product [click to play animation | MP4]](https://cimss.ssec.wisc.edu/satellite-blog/wp-content/uploads/sites/5/2018/11/181125_goes17_cloudType_HI_anim.gif)
GOES-17 Cloud Type product [click to play animation | MP4]
![GOES-17 Cloud Top Temperature product [click to play animation | MP4]](https://cimss.ssec.wisc.edu/satellite-blog/wp-content/uploads/sites/5/2018/11/181125_goes17_cloudTopTemperature_HI_anim.gif)
GOES-17 Cloud Top Temperature product [click to play animation | MP4]
![GOES-17 Cloud Top Height product [click to play animation | MP4]](https://cimss.ssec.wisc.edu/satellite-blog/wp-content/uploads/sites/5/2018/11/181125_goes17_cloudTopHeight_HI_anim.gif)
GOES-17 Cloud Top Height product [click to play animation | MP4]
![GOES-17 False Color RGB images [click to play animation | MP4]](https://cimss.ssec.wisc.edu/satellite-blog/wp-content/uploads/sites/5/2018/11/181125_goes17_falsecolor_rgb_HI_anim.gif)
GOES-17 False Color RGB images [click to play animation | MP4]
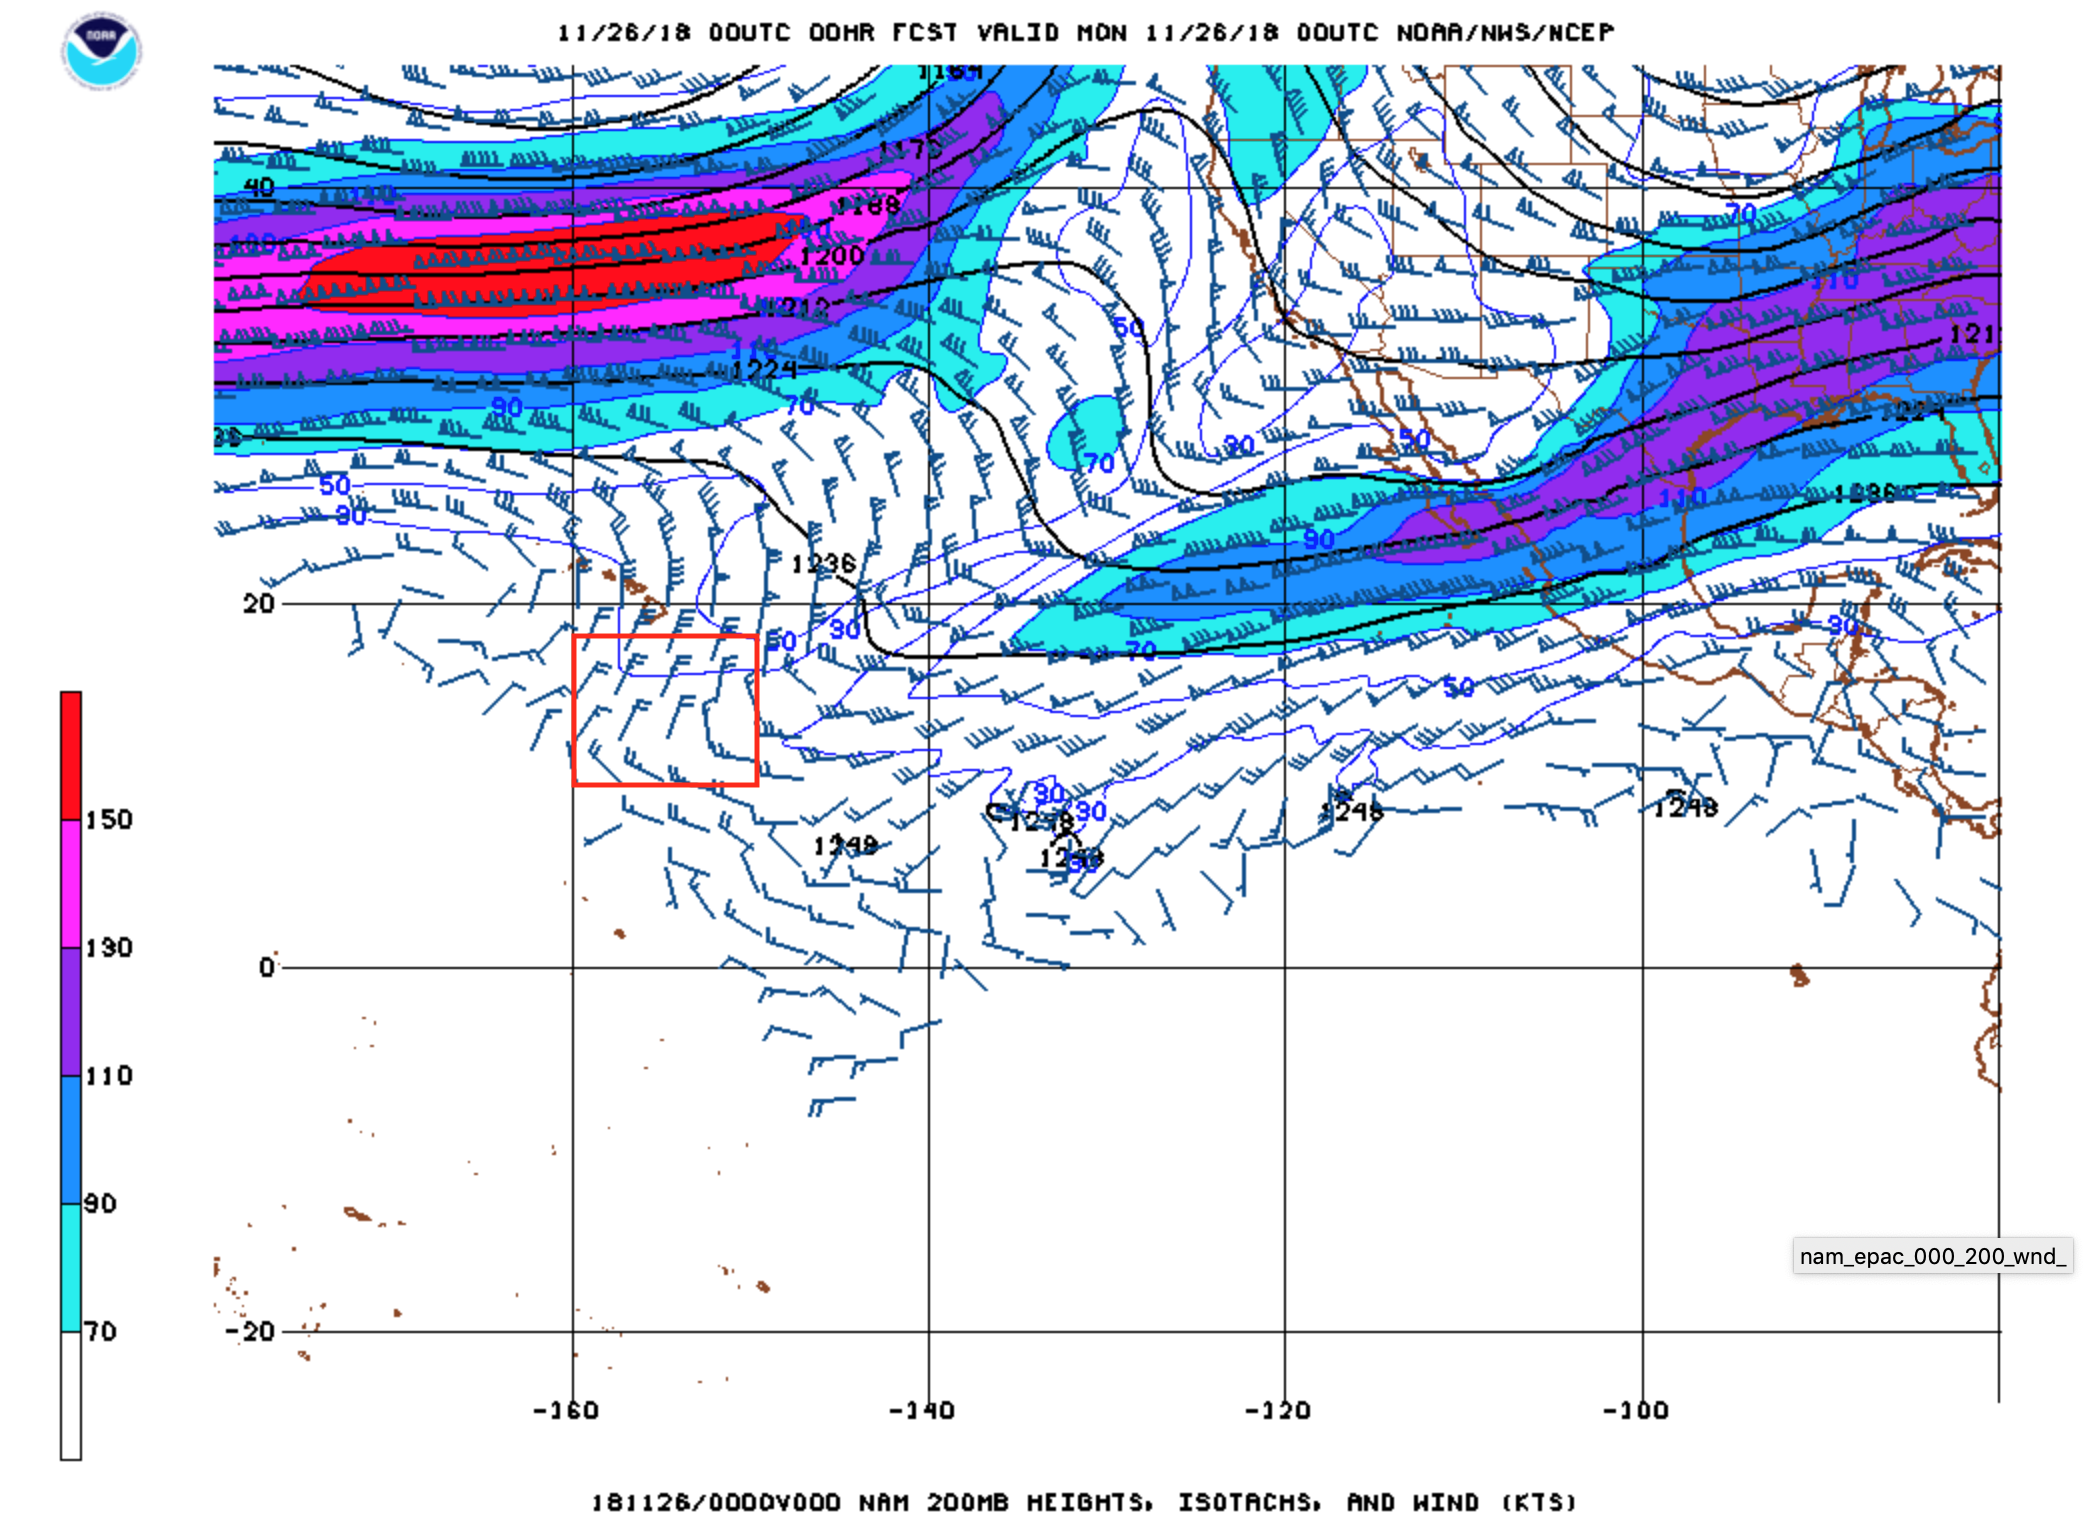
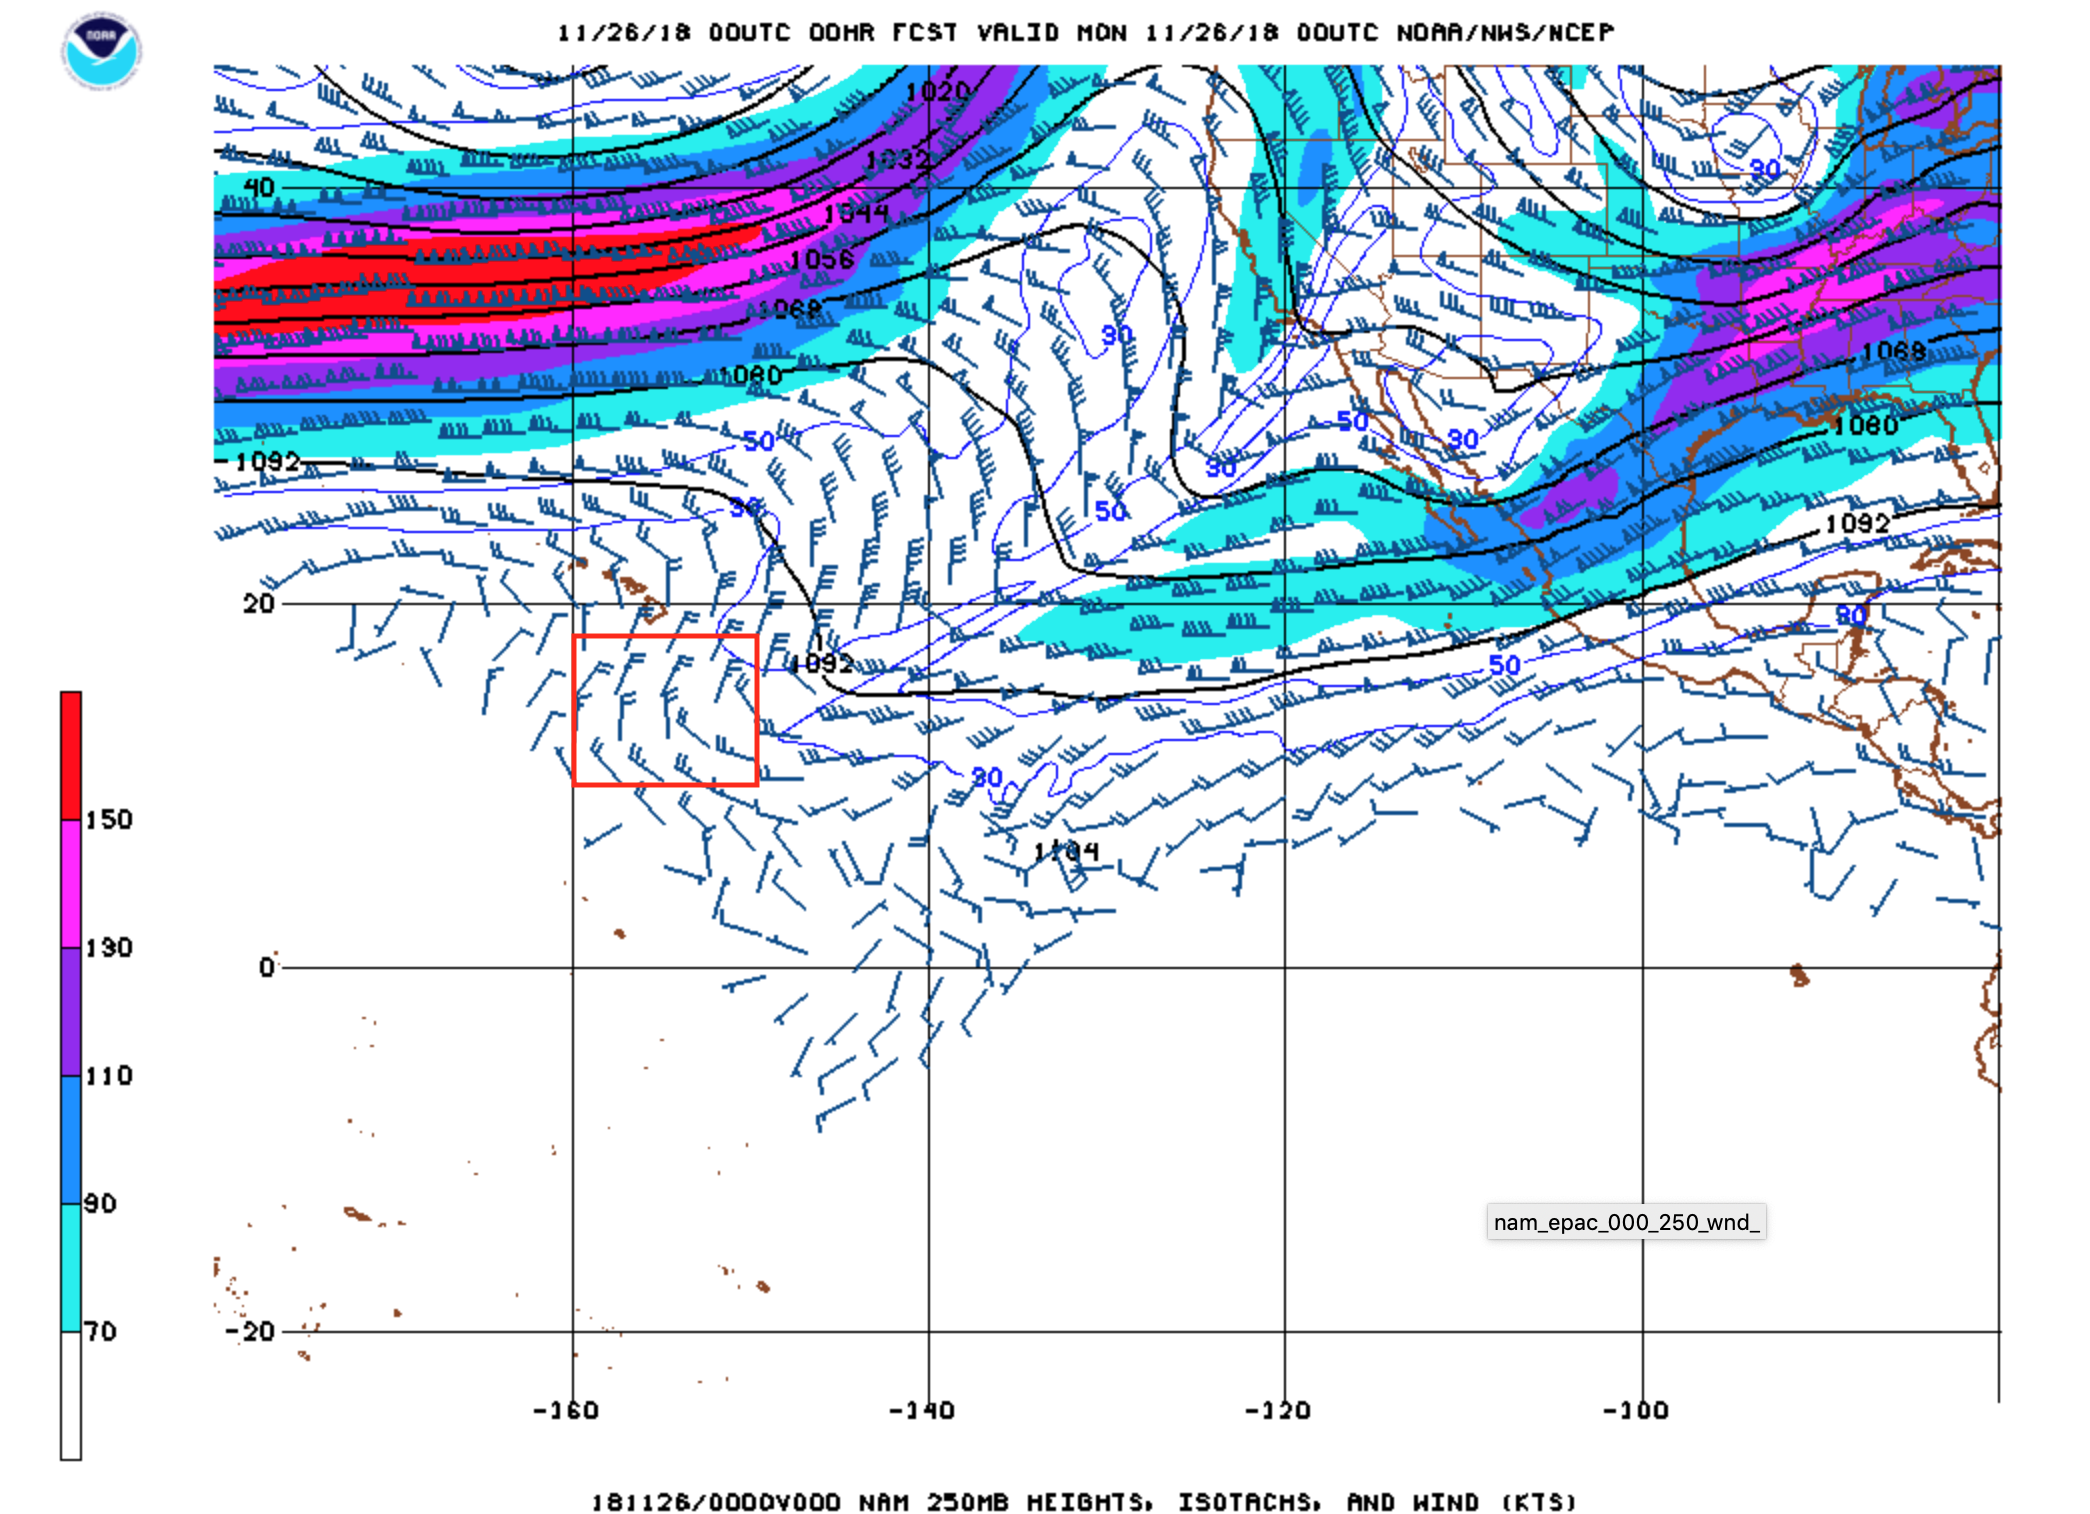
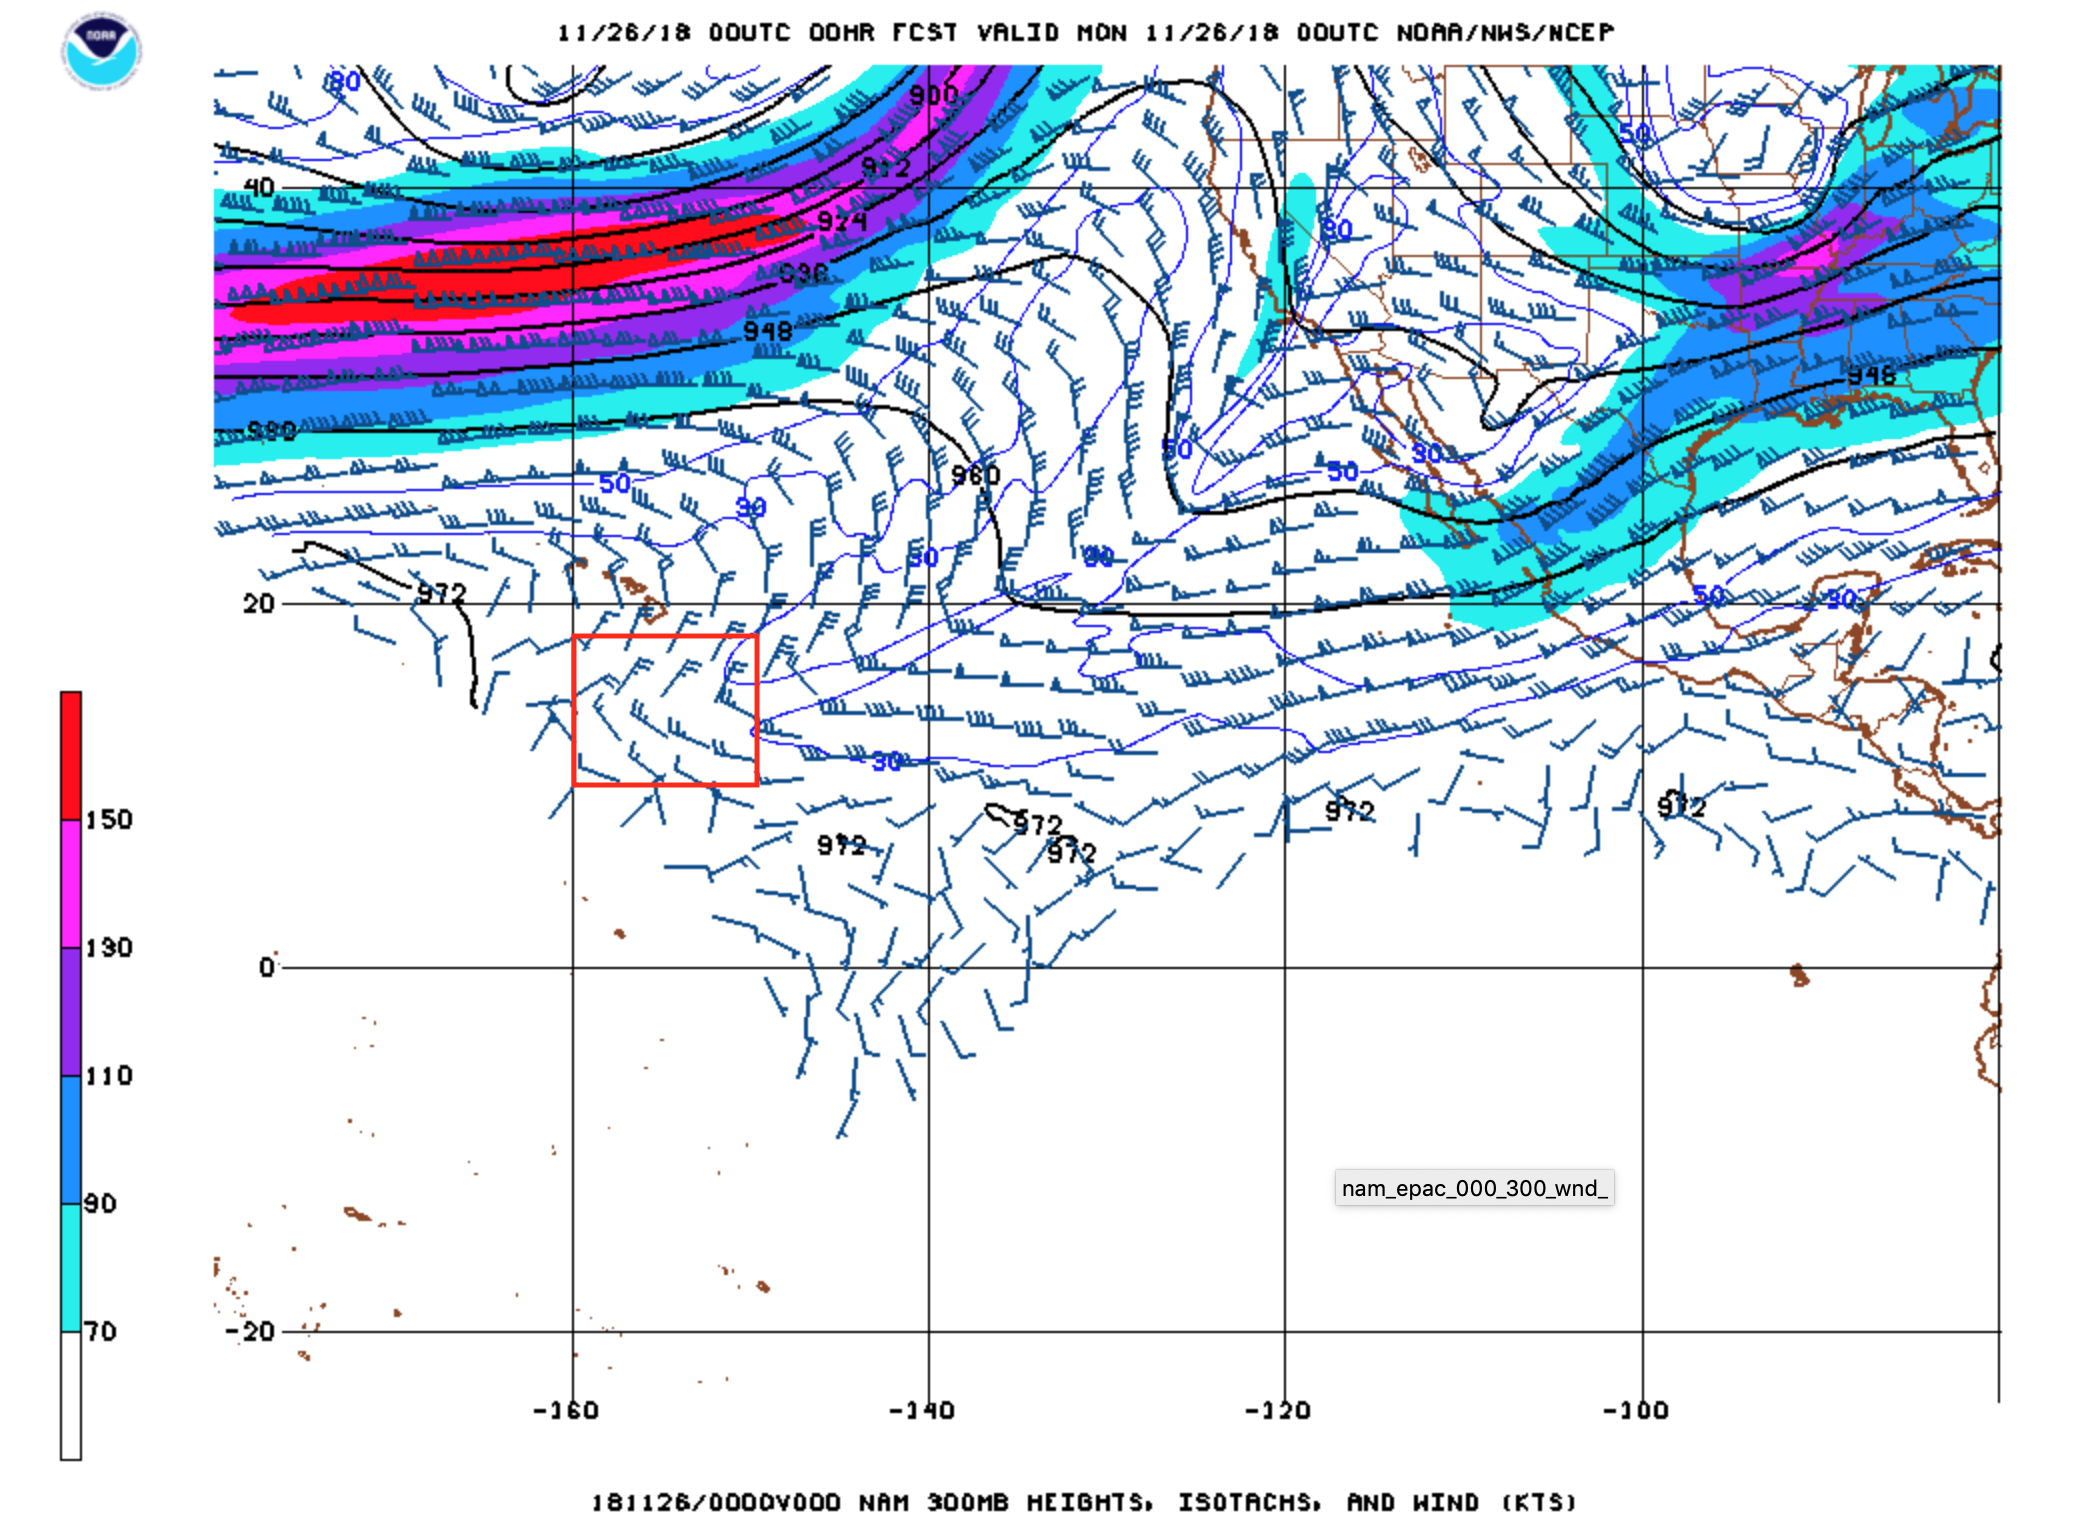
![NAM Winds at 200 hPa, 250 hPa and 300 hPa [click to enlarge]](https://cimss.ssec.wisc.edu/satellite-blog/wp-content/uploads/sites/5/2018/11/181126_00utc_nam_200_250_300_winds_HI_anim.gif)
NAM Winds at 200 hPa, 250 hPa and 300 hPa [click to enlarge]