Large grass fires continue to burn in the southern Plains
![GOES-16 Shortwave Infrared (3.9 µm) images, with hourly plots of surface reports [click to play MP4 animation]](https://cimss.ssec.wisc.edu/satellite-blog/wp-content/uploads/sites/5/2018/04/G16_SWIR_FIRES_CO_OK_17APR2018_960x1280_B7_2018107_235931_0001PANEL_00480.GIF)
GOES-16 Shortwave Infrared (3.9 µm) images, with hourly plots of surface reports [click to play MP4 animation]
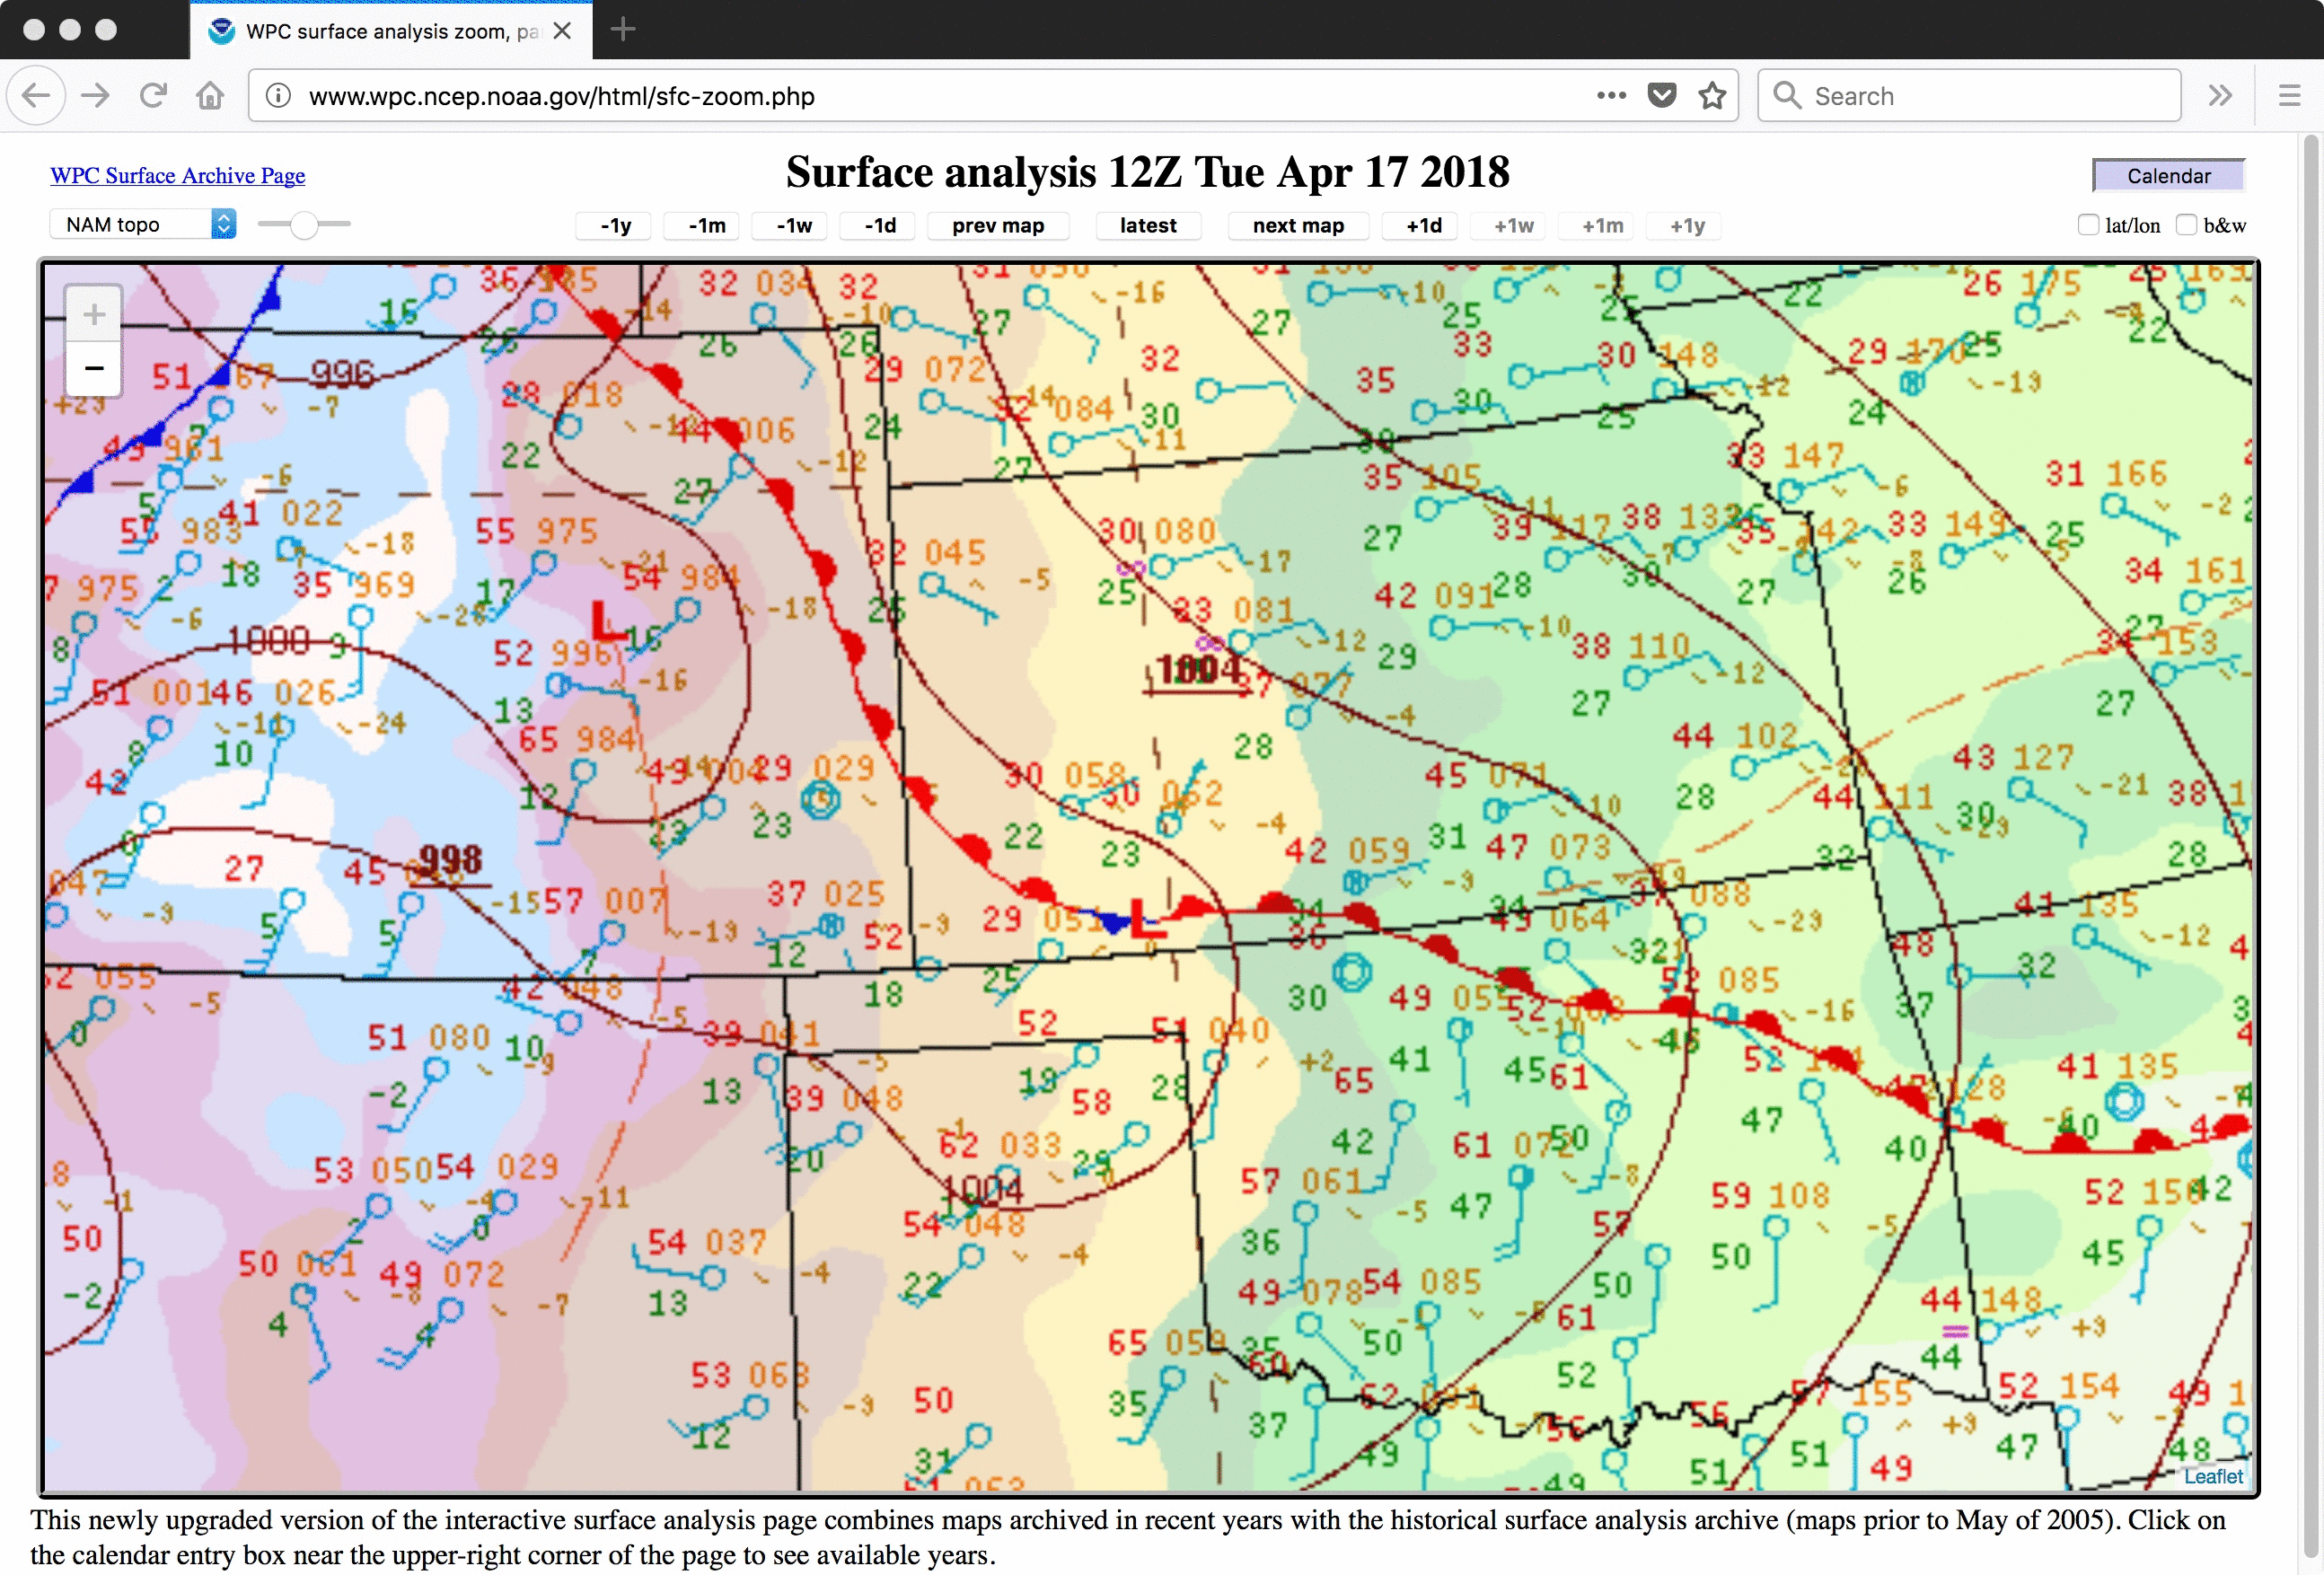
During the subsequent nighttime hours, a strong cold front plunged southeastward across the region (surface analyses) — and on a closer view of GOES-16 Shortwave Infrared images (below), 2 different behaviors were seen for 2 of the larger fires. As the cold front moved over the Badger Hole Fire that was burning along the Colorado/Kansas border, an immediate decreasing trend in hot spot intensity and coverage was noted. Farther to the southeast, when the cold front later moved over the Rhea Fire in northwest Oklahoma a flare-up in hot spot intensity and coverage was evident.
![GOES-16 Shortwave Infrared (3.9 µm) images, with hourly plots of surface reports [click to play MP4 animation]](https://cimss.ssec.wisc.edu/satellite-blog/wp-content/uploads/sites/5/2018/04/G16_SWIR_FIRES_CO_OK_ZOOM_17APR2018_960x1280_B7_2018108_011731_0001PANEL_00378.GIF)
GOES-16 Shortwave Infrared (3.9 µm) images, with hourly plots of surface reports [click to play MP4 animation]
===== 18 April Update =====
A nighttime comparison of (Preliminary, Non-Operational) NOAA-20 VIIRS Day/Night Band (0.7 µm), I-Band Shortwave Infrared (3.75 µm), M-Band Shortwave Infrared (4.05 µm), and M-Band Near-Infrared (1.61 µm and 2.25 µm) images (below; courtesy of William Straka, CIMSS) showed a variety of fire detection signatures associated with the Rhea Fire (283,095 acres, 3% contained) in northwest Oklahoma.
![NOAA-20 Day/Night Band (0.7 µm), I-Band Shortwave Infrared (3.75 µm), M-Band Shortwave Infrared (4.05 µm), M-Band Near-Infrared (1.61 µm and 2.25 µm) images [click to enlarge]](https://cimss.ssec.wisc.edu/satellite-blog/wp-content/uploads/sites/5/2018/04/180418_0802utc_noaa20_viirs_Rhea_Fire_OK_anim.gif)
NOAA-20 VIIRS Day/Night Band (0.7 µm), I-Band Shortwave Infrared (3.75 µm), M-Band Shortwave Infrared (4.05 µm), M-Band Near-Infrared (1.61 µm and 2.25 µm) images [click to enlarge]
![Aqua MODIS Land Surface Temperature product [click to enlarge]](https://cimss.ssec.wisc.edu/satellite-blog/wp-content/uploads/sites/5/2018/04/MODIS_LST_20180418_1919_OK.png)
Aqua MODIS Land Surface Temperature product [click to enlarge]
===== 19 April Update =====
A 30-meter resolution Landsat-8 false-color image from RealEarth (below) provided a detailed view of the Badger Hole Fire, which had burned 48,400 acres along the Colorado/Kansas border.
![Landsat-8 false-color image [click to enlarge]](https://cimss.ssec.wisc.edu/satellite-blog/wp-content/uploads/sites/5/2018/04/180419_1725utc_landsat8_falsecolor_BadgerHoleFire_CO_KS_burn_scar.jpeg)
Landsat-8 false-color image [click to enlarge]