Impact of Local Fires On Snowpack
Katrina Simon, Katharine Hulse and Ella Stannard - Mission Viejo High School, Mission Viejo, CACOACH: Peg Kozick-Kingston
|
ABSTRACT: This project was both a very challenging and helpful learning experience. When we began looking at the satellite images and pictures one of the first things our group noticed was how much California's snowpack varies from year to year. This leads us to wonder why and jump-started our journey to find the answer. After some research online we made the connection that California’s wildfire count also varies every year. That is when we conjured our hypothesis that the amount of wildfires in a year affects the amount of snowpack depth. We thought this because assumed that the smoke from the wildfires landing on the snow would increase the speed of the snow melting. To begin our research, we studied snowfall and snow depth in California Mountain Ranges. We found that more recently in time the snowfall and death grew larger. Years 2016-17 had more snowpack, while 2014-15 had low snow depth. Next, we needed to compare this information with wildfire analysis. After this investigation, we concluded that the wildfire evidence did not correspond with the snowfall evidence. The most wildfires took place in more recent years when snow depth was at its highest and the least in years such as 2014-15. All of our groundwork is displayed on several graphs on the poster and represents and backs up our conclusion. Snowpack and wildfires are not correlated and do not affect each other. |  |
The Effect of Humidity on the Number of Lightning Storms in Texas
Danica Bjornestad, Alison Alves, Rebekah Konecky and Katharine Hulse - Mission Viejo High School, Mission Viejo, CACOACH: Peg Kozick-Kingston
|
ABSTRACT: The topic we chose is lightning storms in Texas. We chose this topic because we wanted to analyze the relationship between humidity to the number of lightning storms. We researched the causes of these storms. Lightning storms are caused by positive and negative charges and humidity contributes to the frequency of these storms. Based on this background research, we formed a hypothesis of: If Texas has many lightning storms because of the humidity and temperature of the Gulf of Mexico, then California is likely to have few because it is near the cold, less humid Pacific Ocean. From our research, we found that as you get closer to the gulf, the humidity rises, resulting in more thunderstorms. The average humidity is about 89% near the gulf. To contrast, California’s average humidity near the Pacific Ocean is 70%, thus having less lightning storms. Furthermore, we found that temperature has an effect on the number of storms. As a result, our hypothesis was supported because Texas does have more lightning storms than California because it is near the humid, Gulf of Mexico. |  |
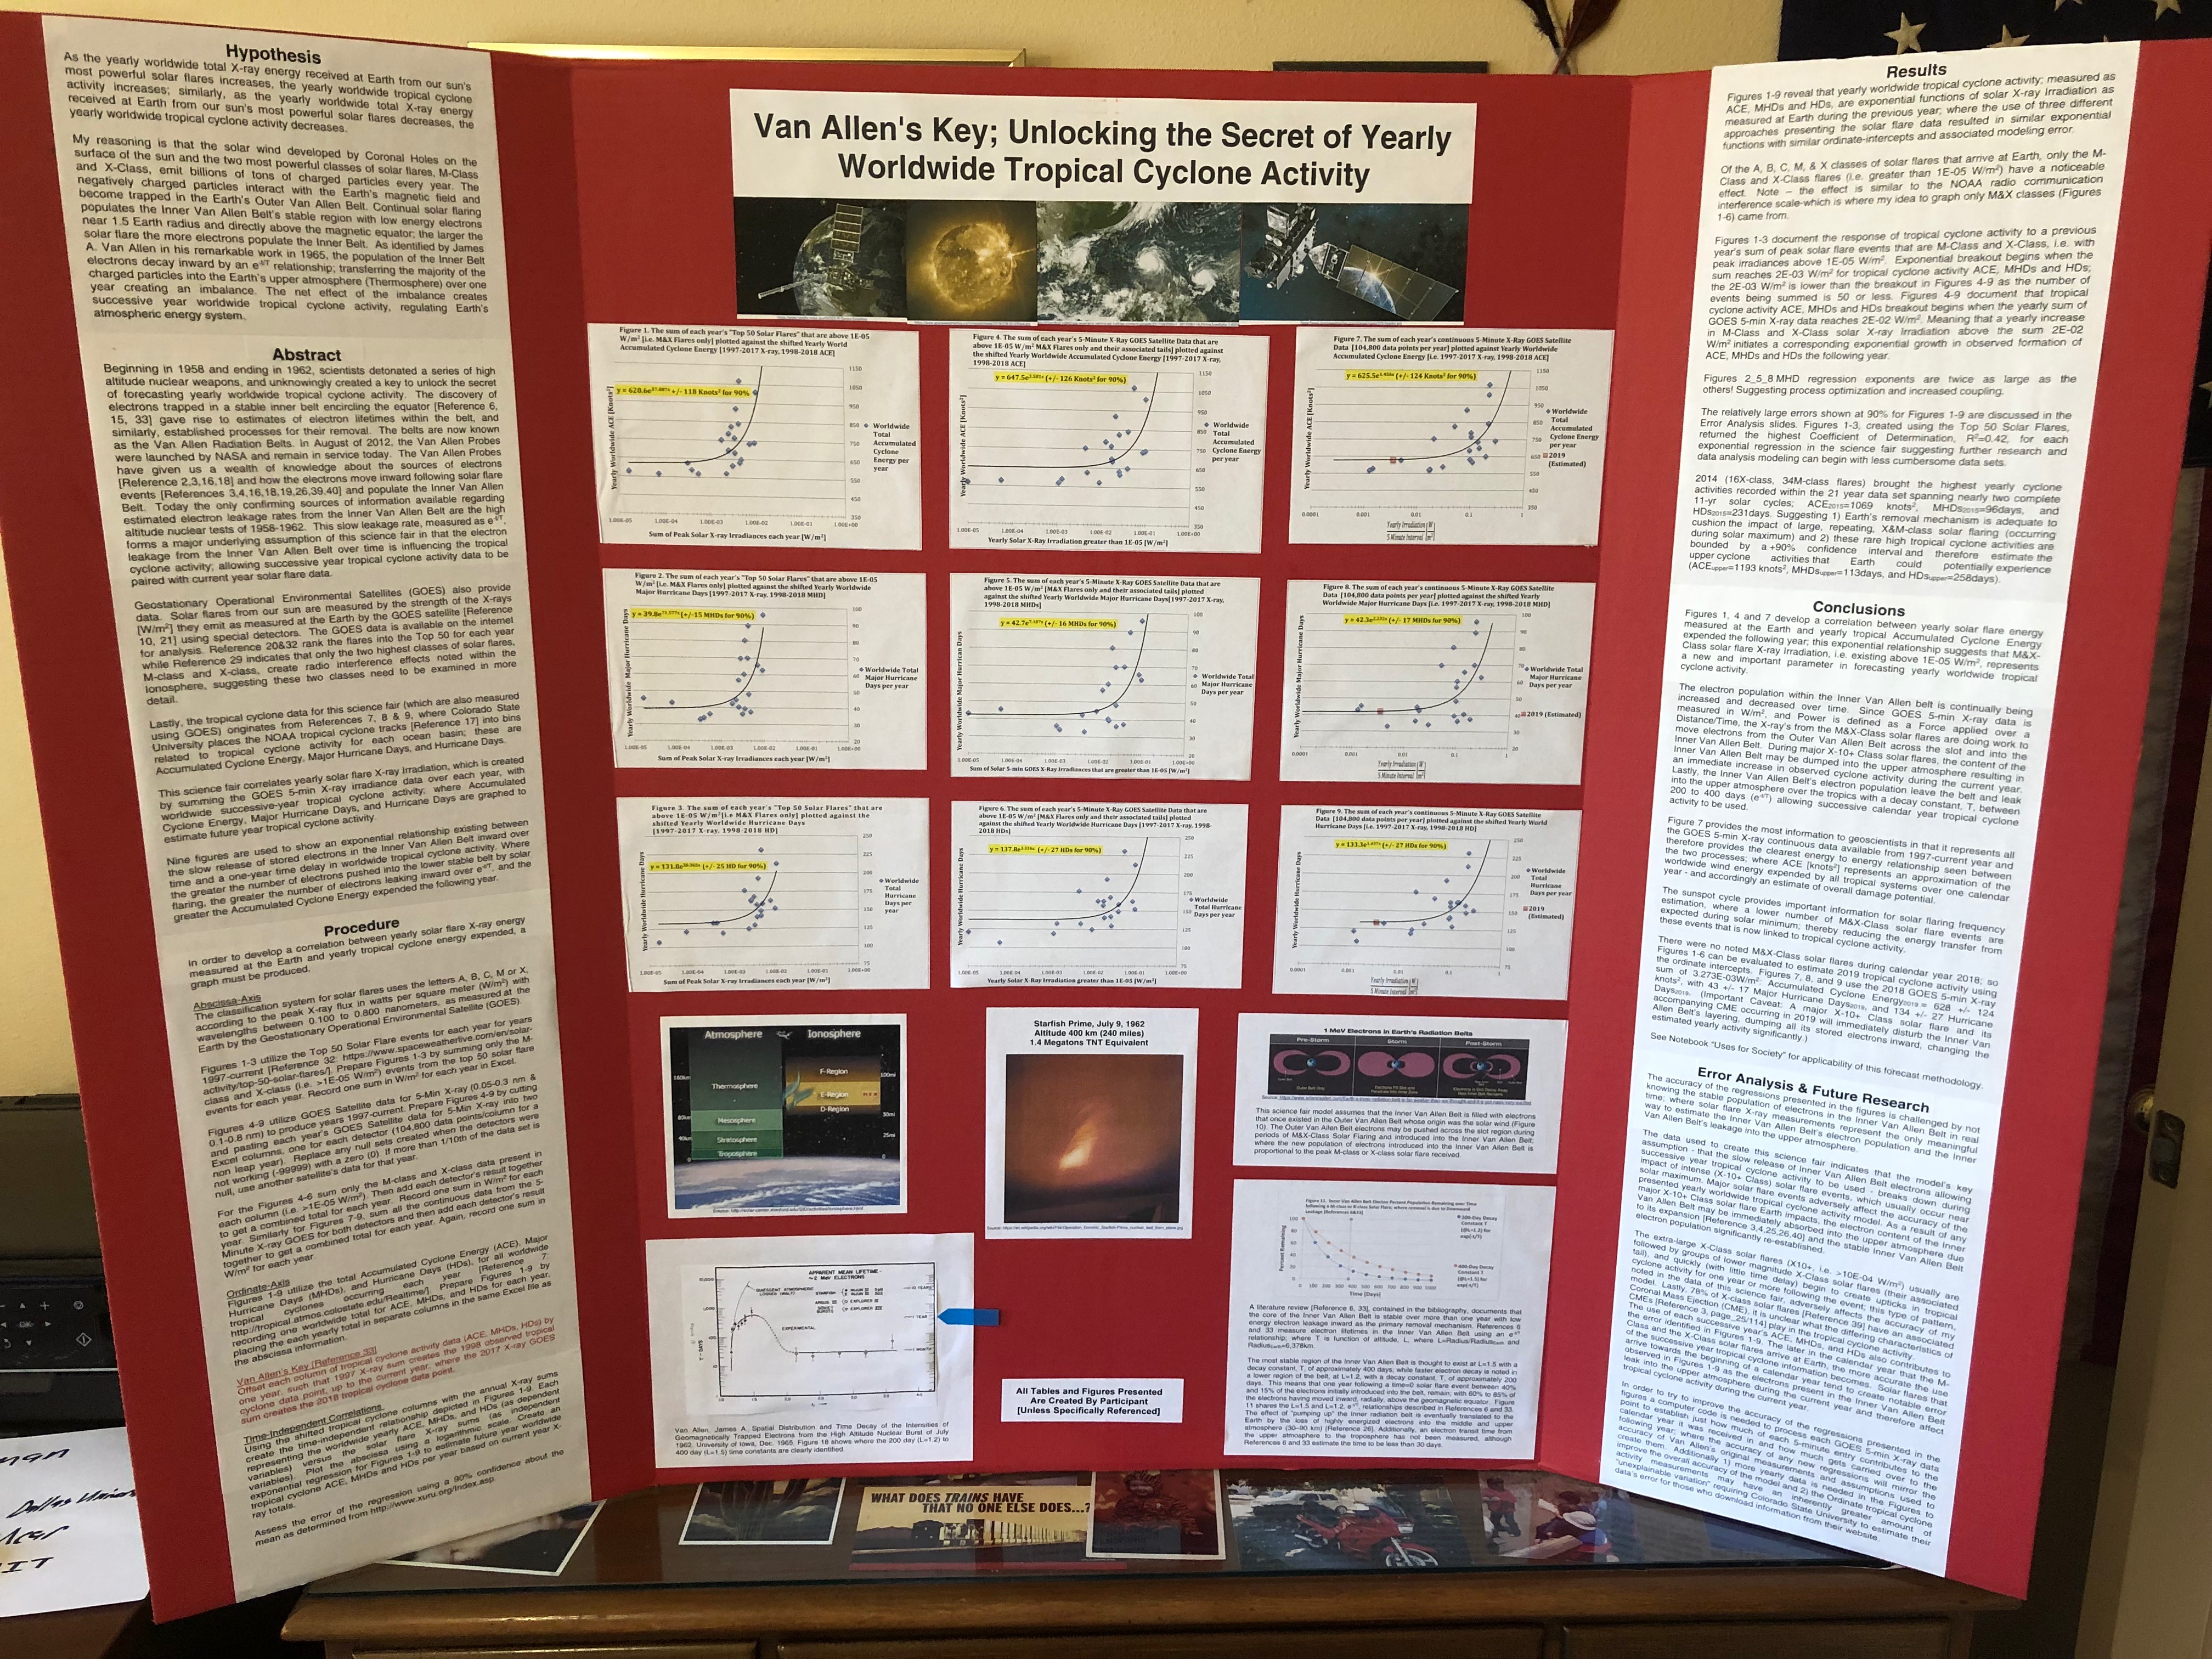
Van Allen's Key; Unlocking the Secret of Yearly Worldwide Tropical Cyclone Activity
Faris Wald - Santa Fe High School, Santa Fe, NMCOACH: Derek Buschman
|
ABSTRACT: This science fair project develops a correlation between yearly solar flare X-ray Irradiation and worldwide yearly tropical cyclone activity; where Accumulated Cyclone Energy, Major Hurricane Days, and Hurricane Days, are graphed in an effort to estimate future year tropical cyclone activity. Google was accessed to locate and download yearly Geostationary Operational Environmental Satellite (GOES) X-ray 5-minute data which measures solar flare X-ray irradiance in W/m2 at Earth. Similarly Google was also accessed to locate yearly sums of worldwide Accumulated Cyclone Energy (ACE), Major Hurricane Days (MHDs), and Hurricane Days (HDs). Nine figures are used to demonstrate that an exponential relationship exists between the slow release of stored electrons in the Inner Van Allen Belt inward over time and a one-year time delay in tropical cyclone activity. As the sum of each year's 5-minute X-ray GOES data representing irradiances above 1E-05 W/m2 [M&X Flares only] are plotted against worldwide yearly ACE, MHDs, and HDs for each successive year [i.e. 1997-2017 X-ray, 1998-2018 ACE, MHDs, HDs]; a time-independent exponential relationship is formed which estimates future year worldwide ACE, MHDs, and HDs. The accuracy of the models is presented statistically and graphically. The year 2018 has been a quiet year with regard to solar flare activity with no M or X class solar flares being recorded by NOAA GOES-16. The exponential regressions contained in Figures 7, 8 and 9 return 2019 tropical cyclone activity estimates: ACE2019= 628 +/- 124 knots2; with 43 +/- 17 MHDs2019, and 134 +/- 27 HDs2019. | 
|  |
Extreme and excessive rain patterns in the mid to east U.S.A.
Zachary Margala and Patrick Wisniewiski - Mission Viejo High School, Mission Viejo, CACOACH: Peg Kozick-Kingston
|
ABSTRACT: The weather scenario currently being investigated is the excessive rainfall within the southern regions of the United States. As seen from Real Earth's current world display, heavy rainfall and flooding has been prevalent in the Eastern side of Texas and in all of Louisiana. Giving from data over the course of three days and due to strong winds based around the current area, it is hypothesized that the storm will head up North towards Maine, New York, Delaware, ect. And will also split south into Florida, Louisiana, and Mississippi. This particular storm has been noted to cause heavy flooding in Houston, therefore making it’s center most active. And the center of the storm has remained static throughout the three days, which has lead to the assumption that louisiana will receive heavy flooding along with Mississippi as well as Tennesse in the next upcoming days. Since the winds described in the hypothesis have been centered about the center of the United States, they will draft down towards Texas, pickup thes storm and split it into two. The first have will curve around the states, following up the East coast into Tennessee until reaching Maine where the Storm will leading into the Ocean and dissipate. The Second part will head towards Florida and rain for a couple days until it too reaches the ocean and disipates. |  |
Effect of Wildfires
Brandon Ngo, Bryan Ngo, Valio Marconi, Rhys Chappell, and Erik Garay - Mission Viejo High School, Mission Viejo, CACOACH: Peg Kozick-Kingston
|
ABSTRACT: The oregon lake fire, is a large wildfire located inside the Delta Junction of Alaska. The Oregon lakes fire has currently burned 12,904 acres of land, and is still rapidly growing. This fire was said to have reportedly started on April 30, 2019, and is said to be fully contained by october 2019. The weather has impacted the land of the surrounding area greatly. There was very little precipitation during the months of january, february, and march. In fact there was only about 0.01 inches of precipitation in March, which is low compared to previous years. By having little to no rainfall in the early months of 2019, it allowed the tall grasses that had grown during the wet winter months to become dry and very flammable. This lack of rainfall affected the land where this fire was started, by having the majority of it consisting of tall dry grass, and downed trees. This created the perfect scenario for the fire to erupt. The tall dry grass was easily set afire, and is still continuing to burn and provide fuel for the raging fire. The only hope firefighters shave for stopping this fire from spreading so fast is by making multiple control lines. This means that in order to contain the fire they will have to clear miles of brush in order to get rid of anything that the fire will use to continue burning. The environment and surrounding areas have affected this wildfire greatly. It has made it so the fire has lots of fuel to burn, and so it is very hard to send firefighters and equipment to stop the fire. Another environmental impact is the fact that the surrounding area is mainly consisted of wildlife, and not to many urban environments. This means that there are less people that could be affected by this fire. However, it also means that there is more land to be burned and fewer resources needed to stop the fire. |  |