Tropical Depression 2 becomes Tropical Storm Barry in the far southwestern Gulf of Mexico
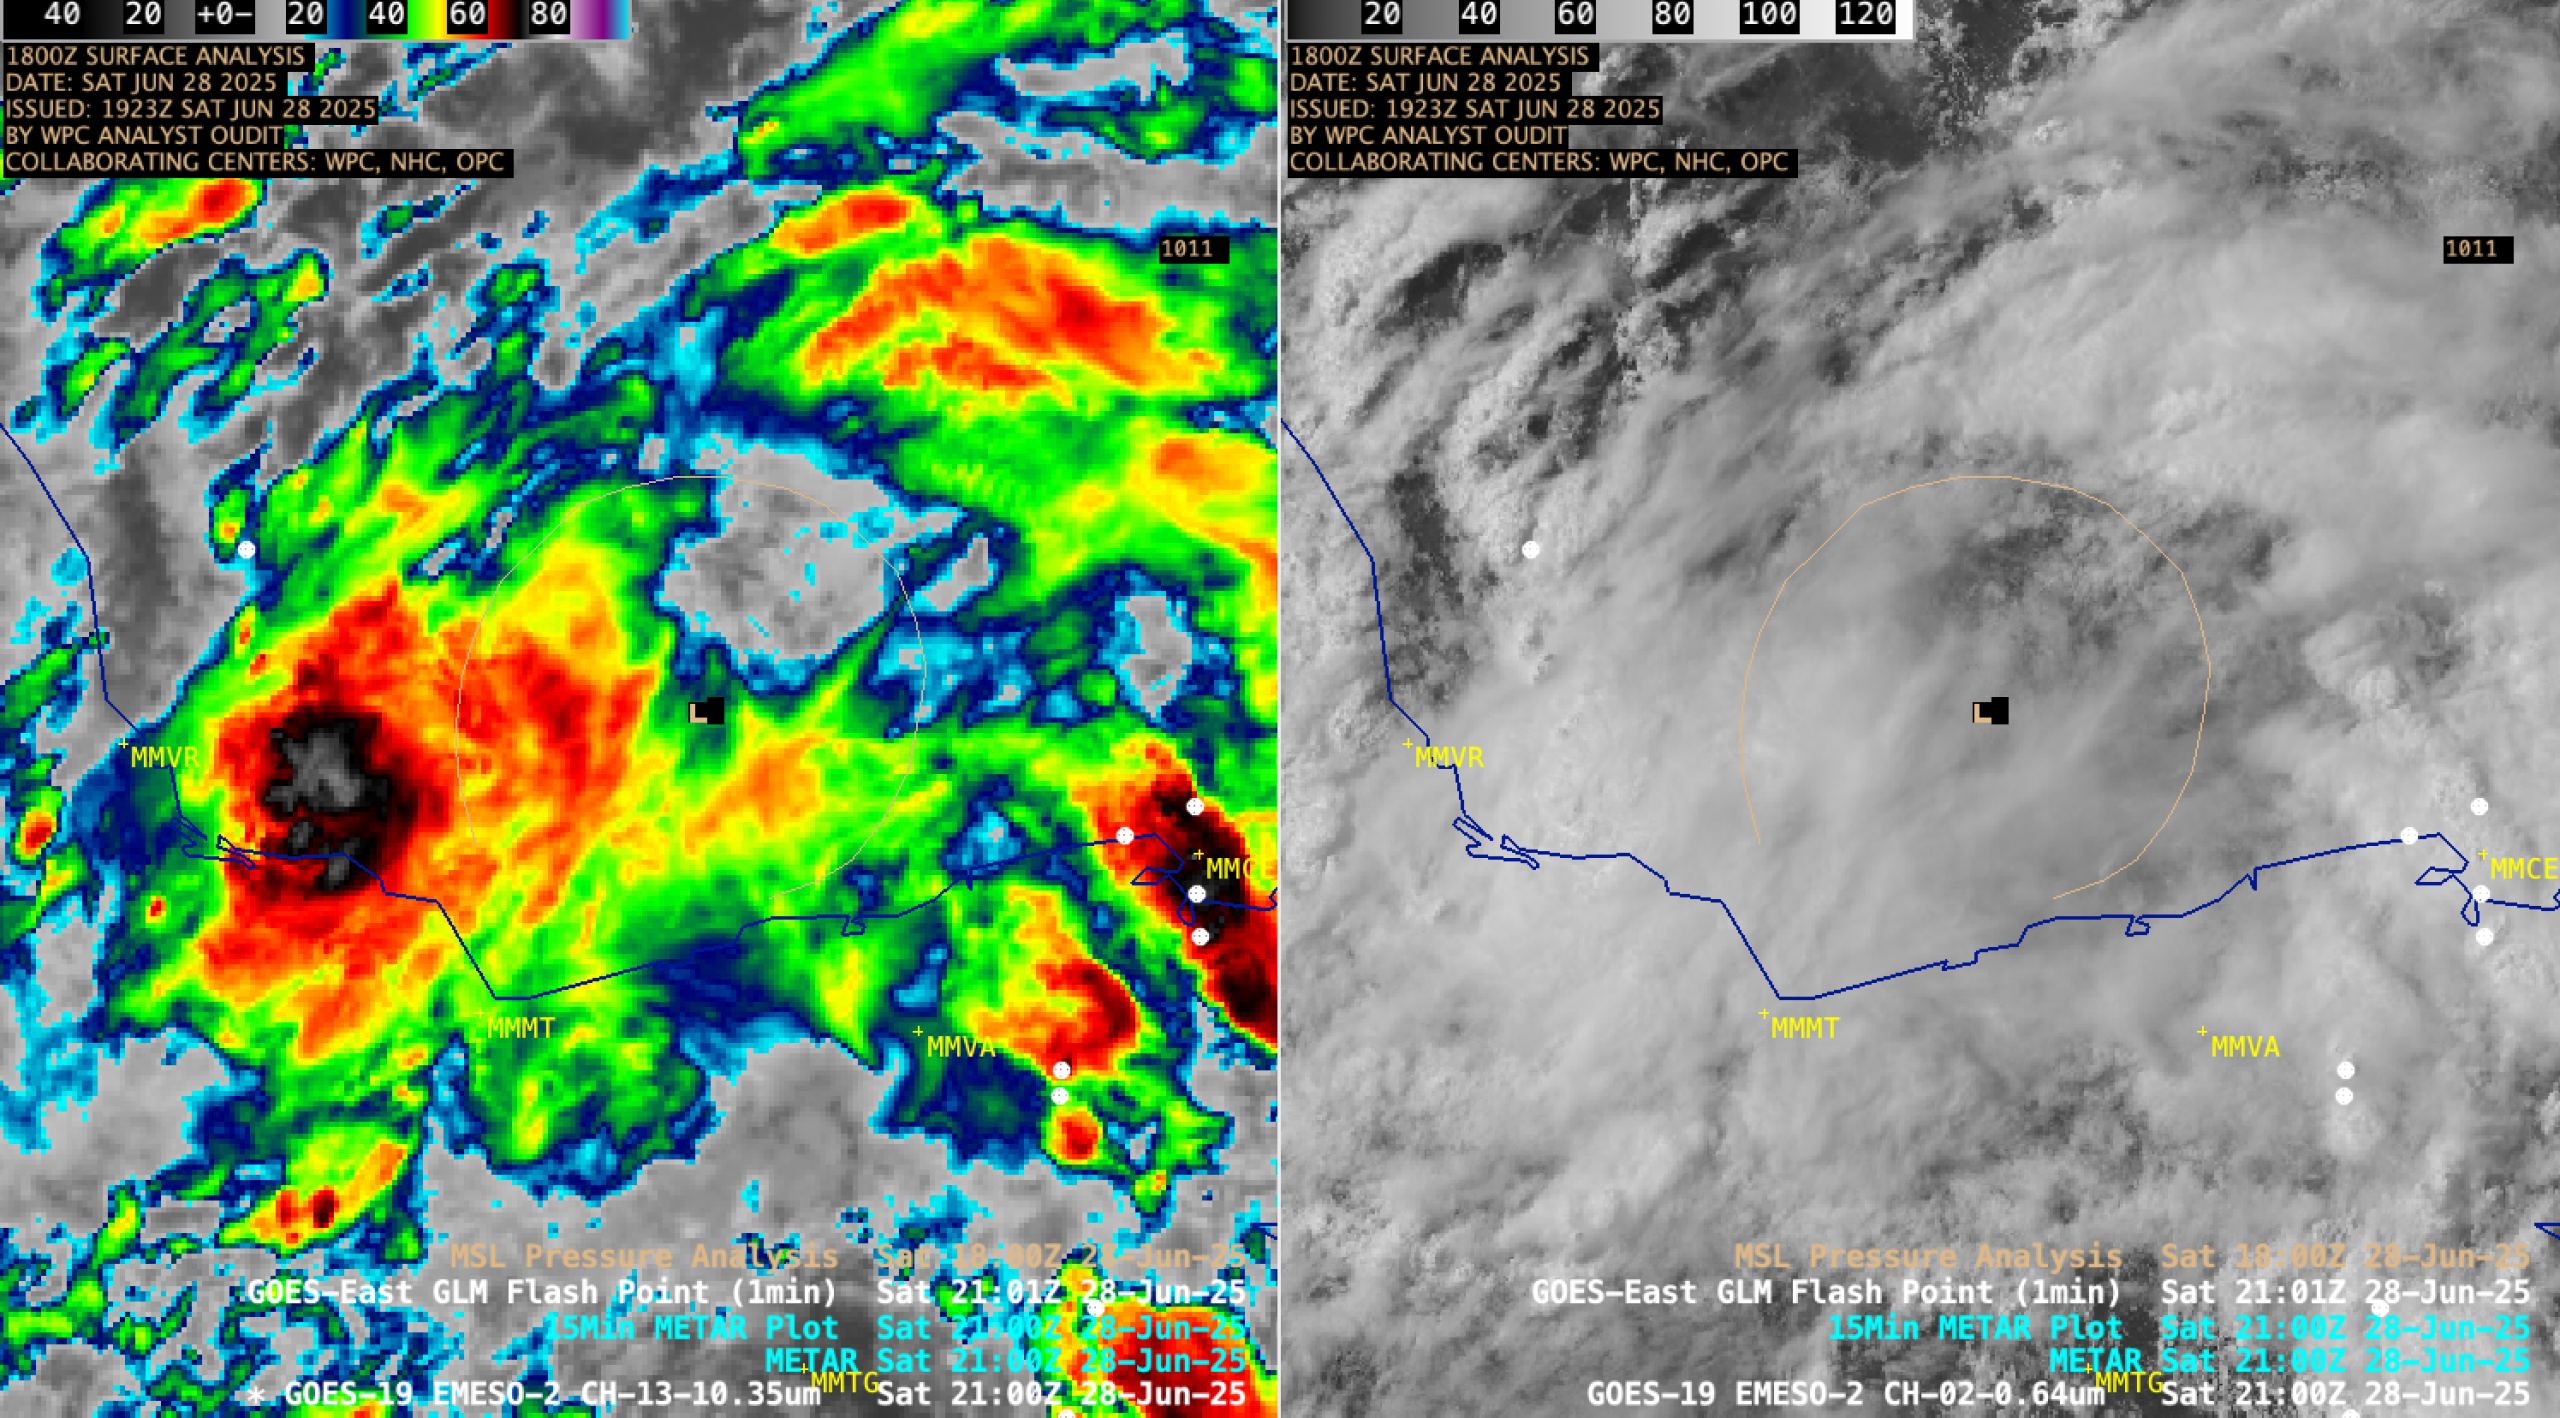
1-minute Mesoscale Domain Sector GOES-19 (GOES-East) Infrared and Visible images (above) showed persistent deep convection (with sporadic lightning activity) near the center of circulation of Tropical Depression 2 (TD2), which developed in the Bay of Campeche (just off the coast of Mexico) around 2100 UTC on 28 June 2025. Periodic convective bursts contained... Read More