Hurricane Erick makes landfall along the Pacific coast of Mexico
1-minute GOES-19 Visible (0.64 µm) and Infrared (10.3 µm) images, from 1800 UTC on 18 June to 0053 UTC on 19 June [click to play animated GIF]
Erick was moving through an environment characterized by low values of deep-layer wind shear (below) — a factor that favored further intensification.
GOES-19 Infrared images, with an overlay of deep-layer wind shear at 0000 UTC on 19 June
A DMSP-18 Microwave image at 2154 UTC on 18 June (below) displayed a large outer eyewall (and hints of a partial inner eyewall), suggesting that an eyewall replacement cycle might soon occur.
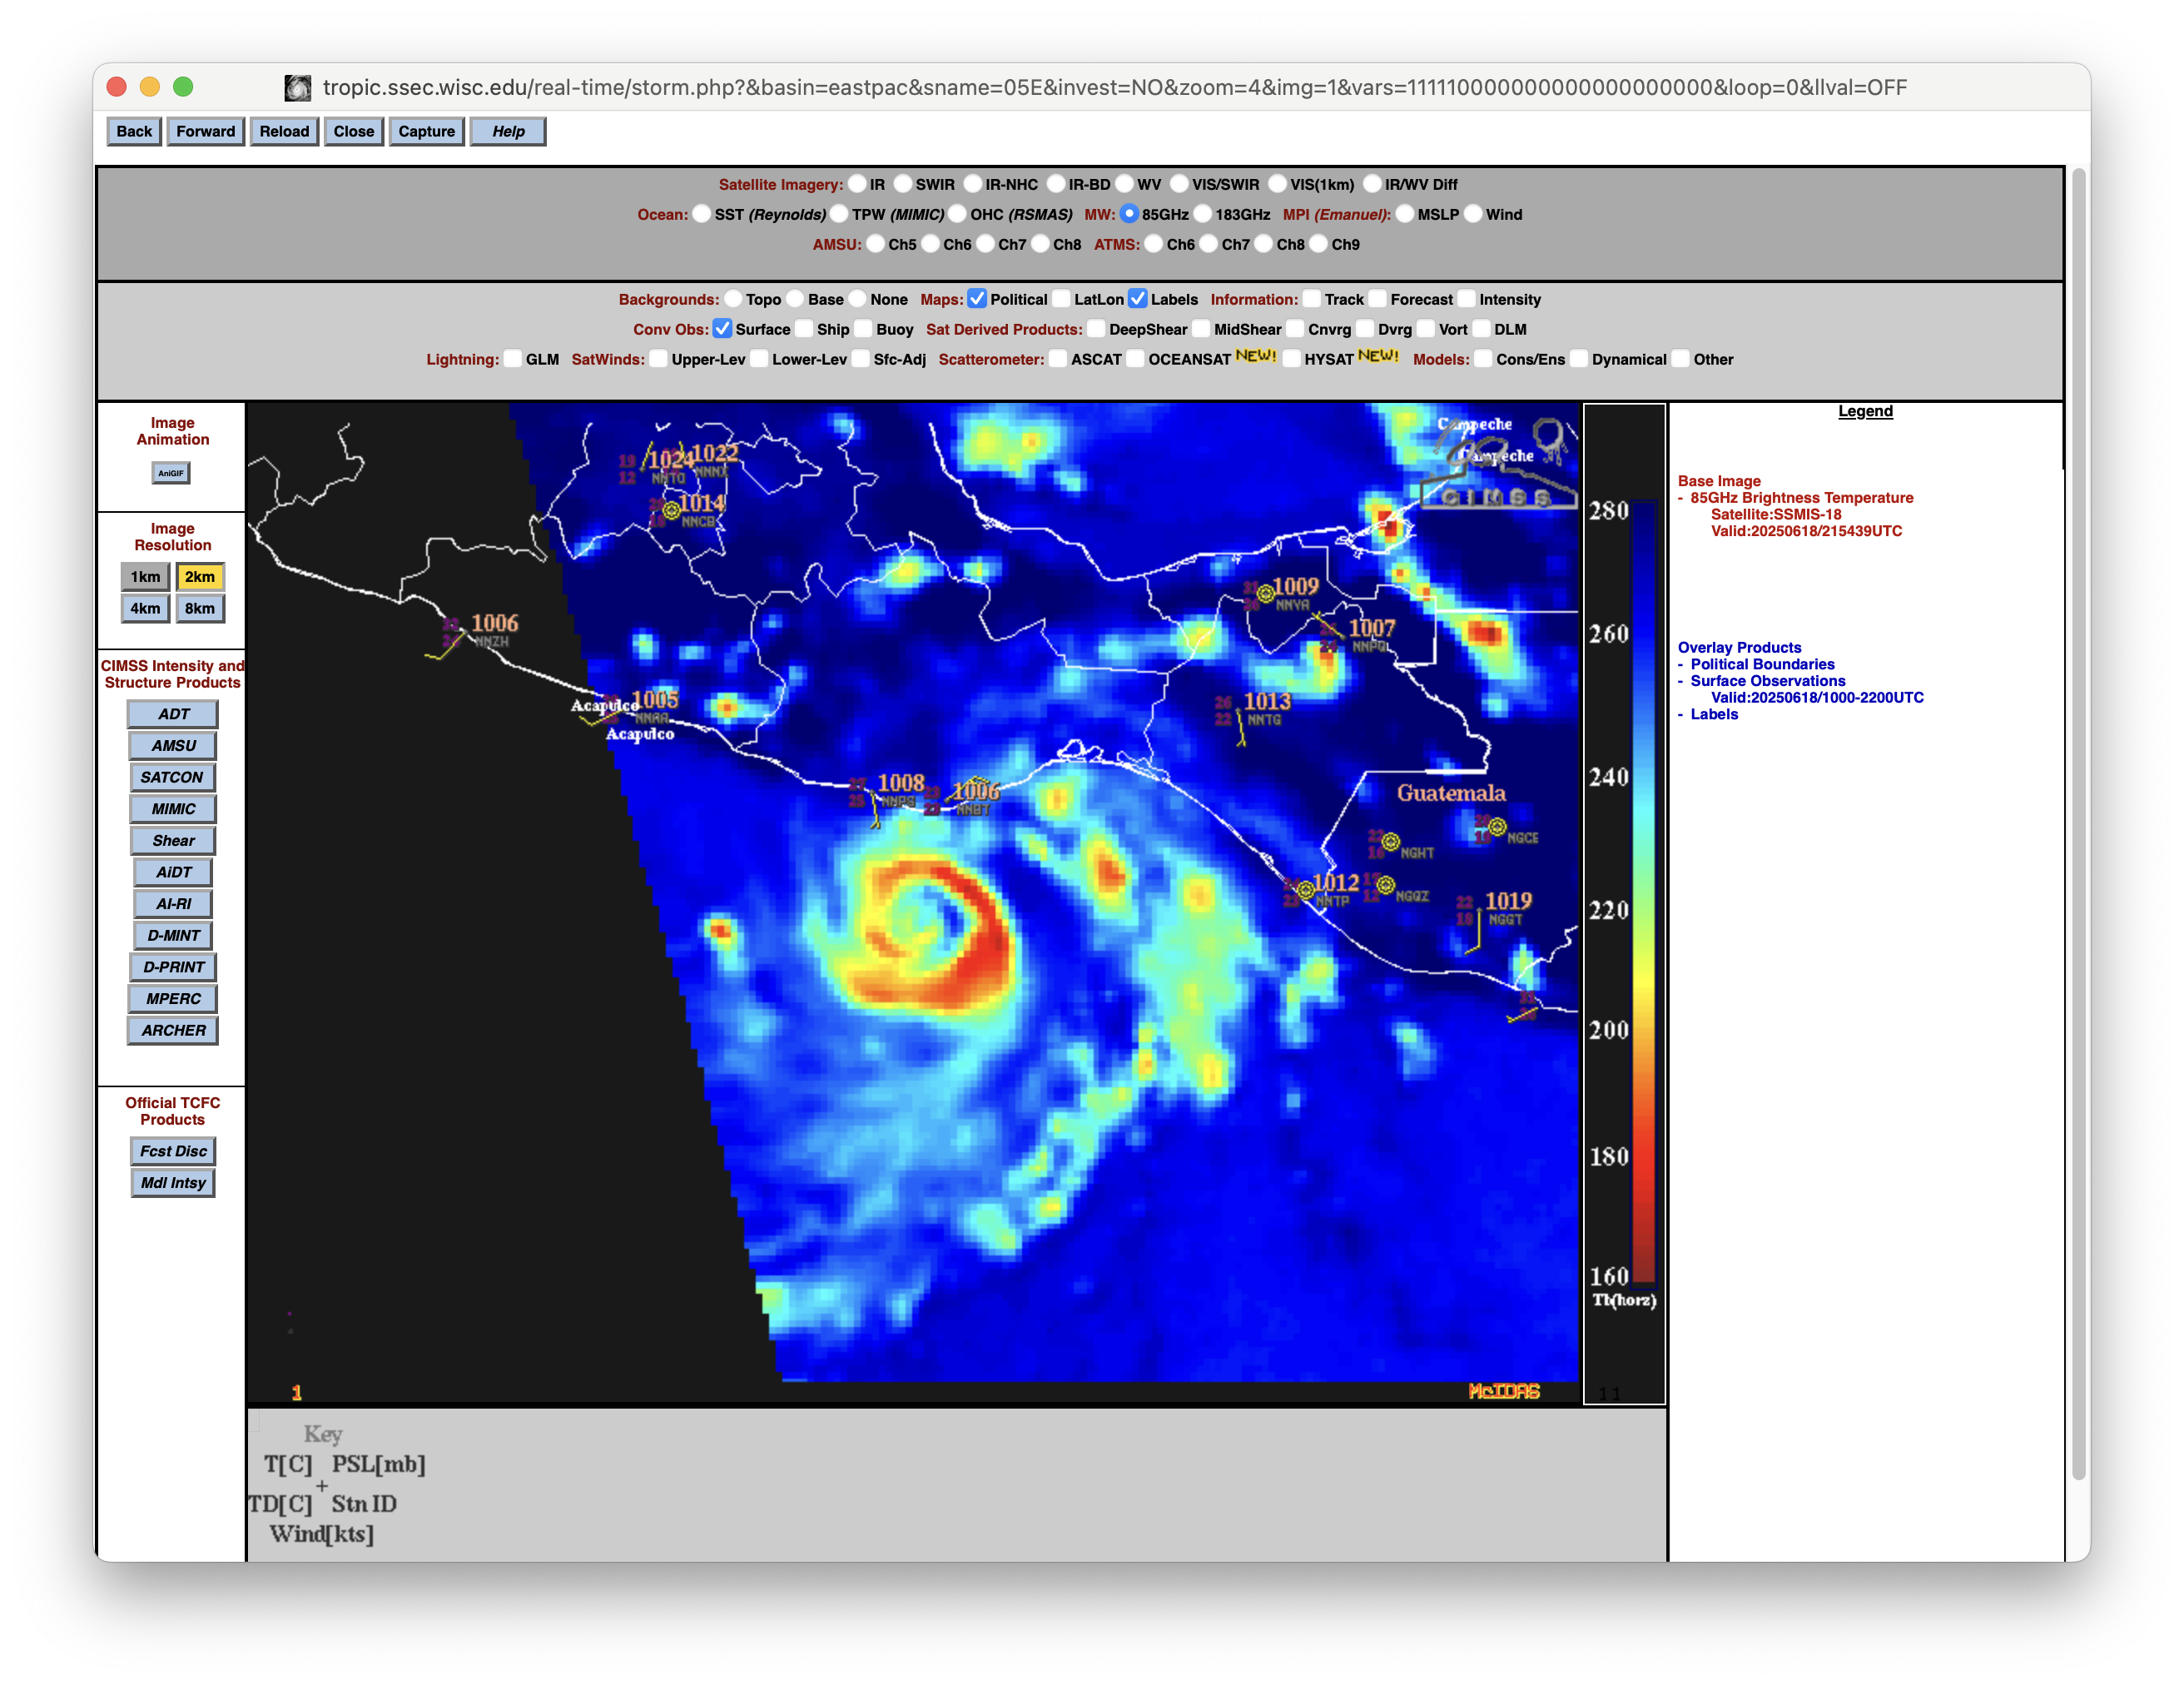
DMSP-18 SSMI/S Microwave (85 GHz) image at 2154 UTC on 18 June [click to enlarge]

1-minute GOES-19 Infrared (10.3 µm) images, from 2100 UTC on 18 June to 1301 UTC on 19 June [click to play animated GIF]

GOES-19 Infrared images, with an overlay of deep-layer wind shear at 0900 UTC on 19 June
A DMSP-18 Microwave image at 1030 UTC on 19 June (below) suggested that landfall might have occurred a bit earlier than 1200 UTC.
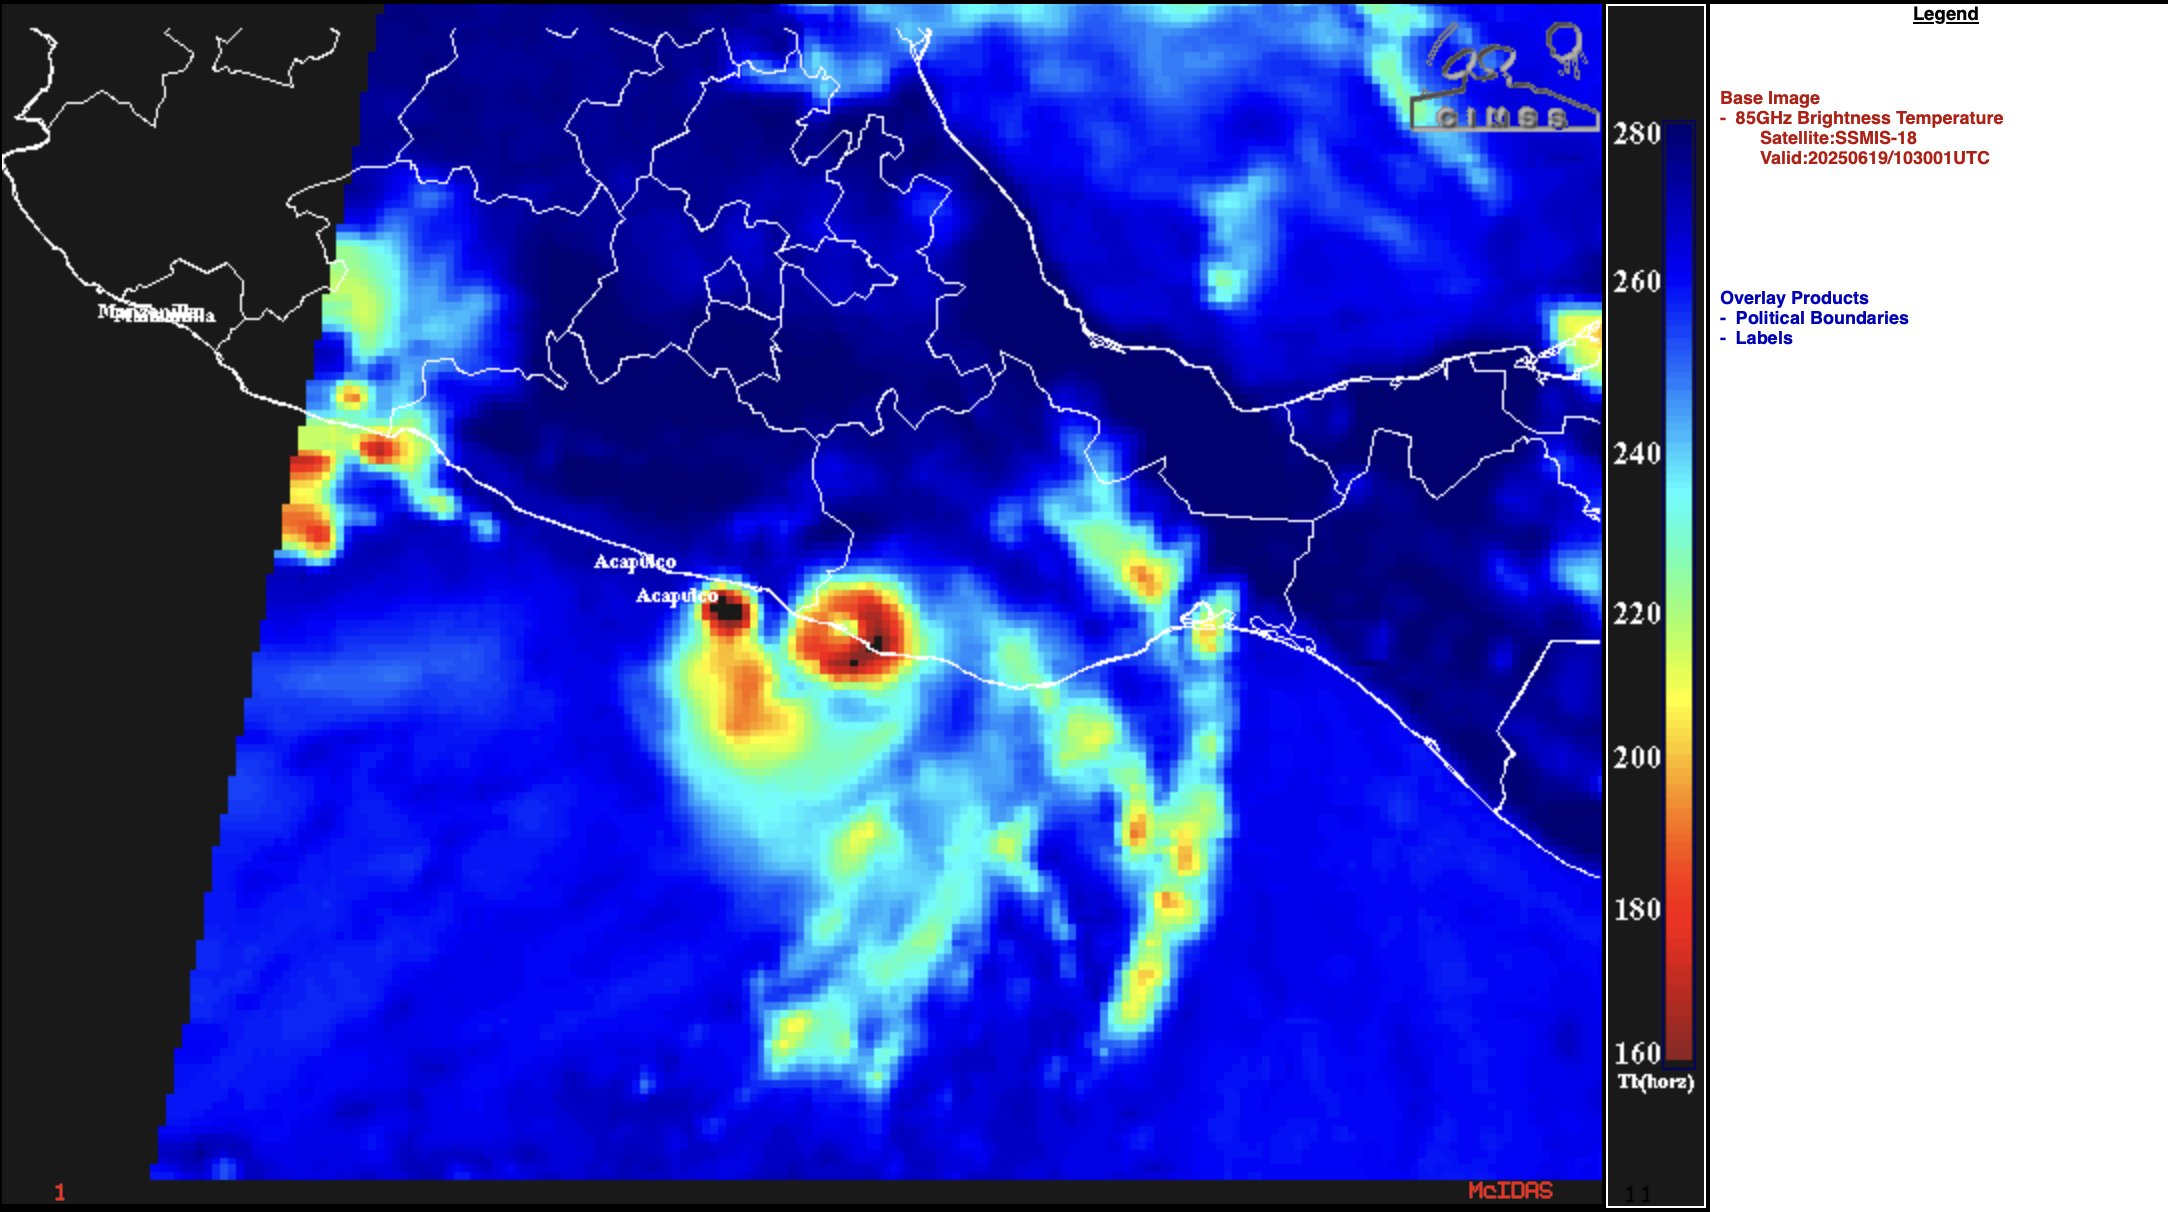
DMSP-18 SSMI/S Microwave (85 GHz) image at 1030 UTC on 19 June [click to enlarge]
The mp4 animation below (created using geo2grid from CSPP Geo) shows a broader-scale view of Erick during its intensification prior to landfall. Very cold cloud tops initially surround the strengthening center. Subsequently, an extensive region of even colder cloud tops develops well southwest of the storm center.