This website works best with a newer web browser such as Chrome, Firefox, Safari or Microsoft Edge. Internet Explorer is not supported by this website.

Detection of a prescribed burn near Flagstaff, Arizona using GOES-18 and GOES-19: NGFS vs FDCA

The Campbell Mesa prescribed burn occurred just east of Flagstaff, Arizona on 09 April 2025. Given that this location is approximately midway between the views of GOES-18 (GOES-West, with a satellite zenith angle for Flagstaff of 48.72 degrees) and GOES-19 (GOES-East, with a satellite zenith angle for Flagstaff of 56.13 degrees), this fire served as... Read More

The Campbell Mesa prescribed burn occurred just east of Flagstaff, Arizona on 09 April 2025. Given that this location is approximately midway between the views of GOES-18 (GOES-West, with a satellite zenith angle for Flagstaff of 48.72 degrees) and GOES-19 (GOES-East, with a satellite zenith angle for Flagstaff of 56.13 degrees), this fire served as a good opportunity to compare detection using the Next Generation Fire System (NGFS) and the currently-operational Fire Detection and Characterization Algorithm (FDCA).

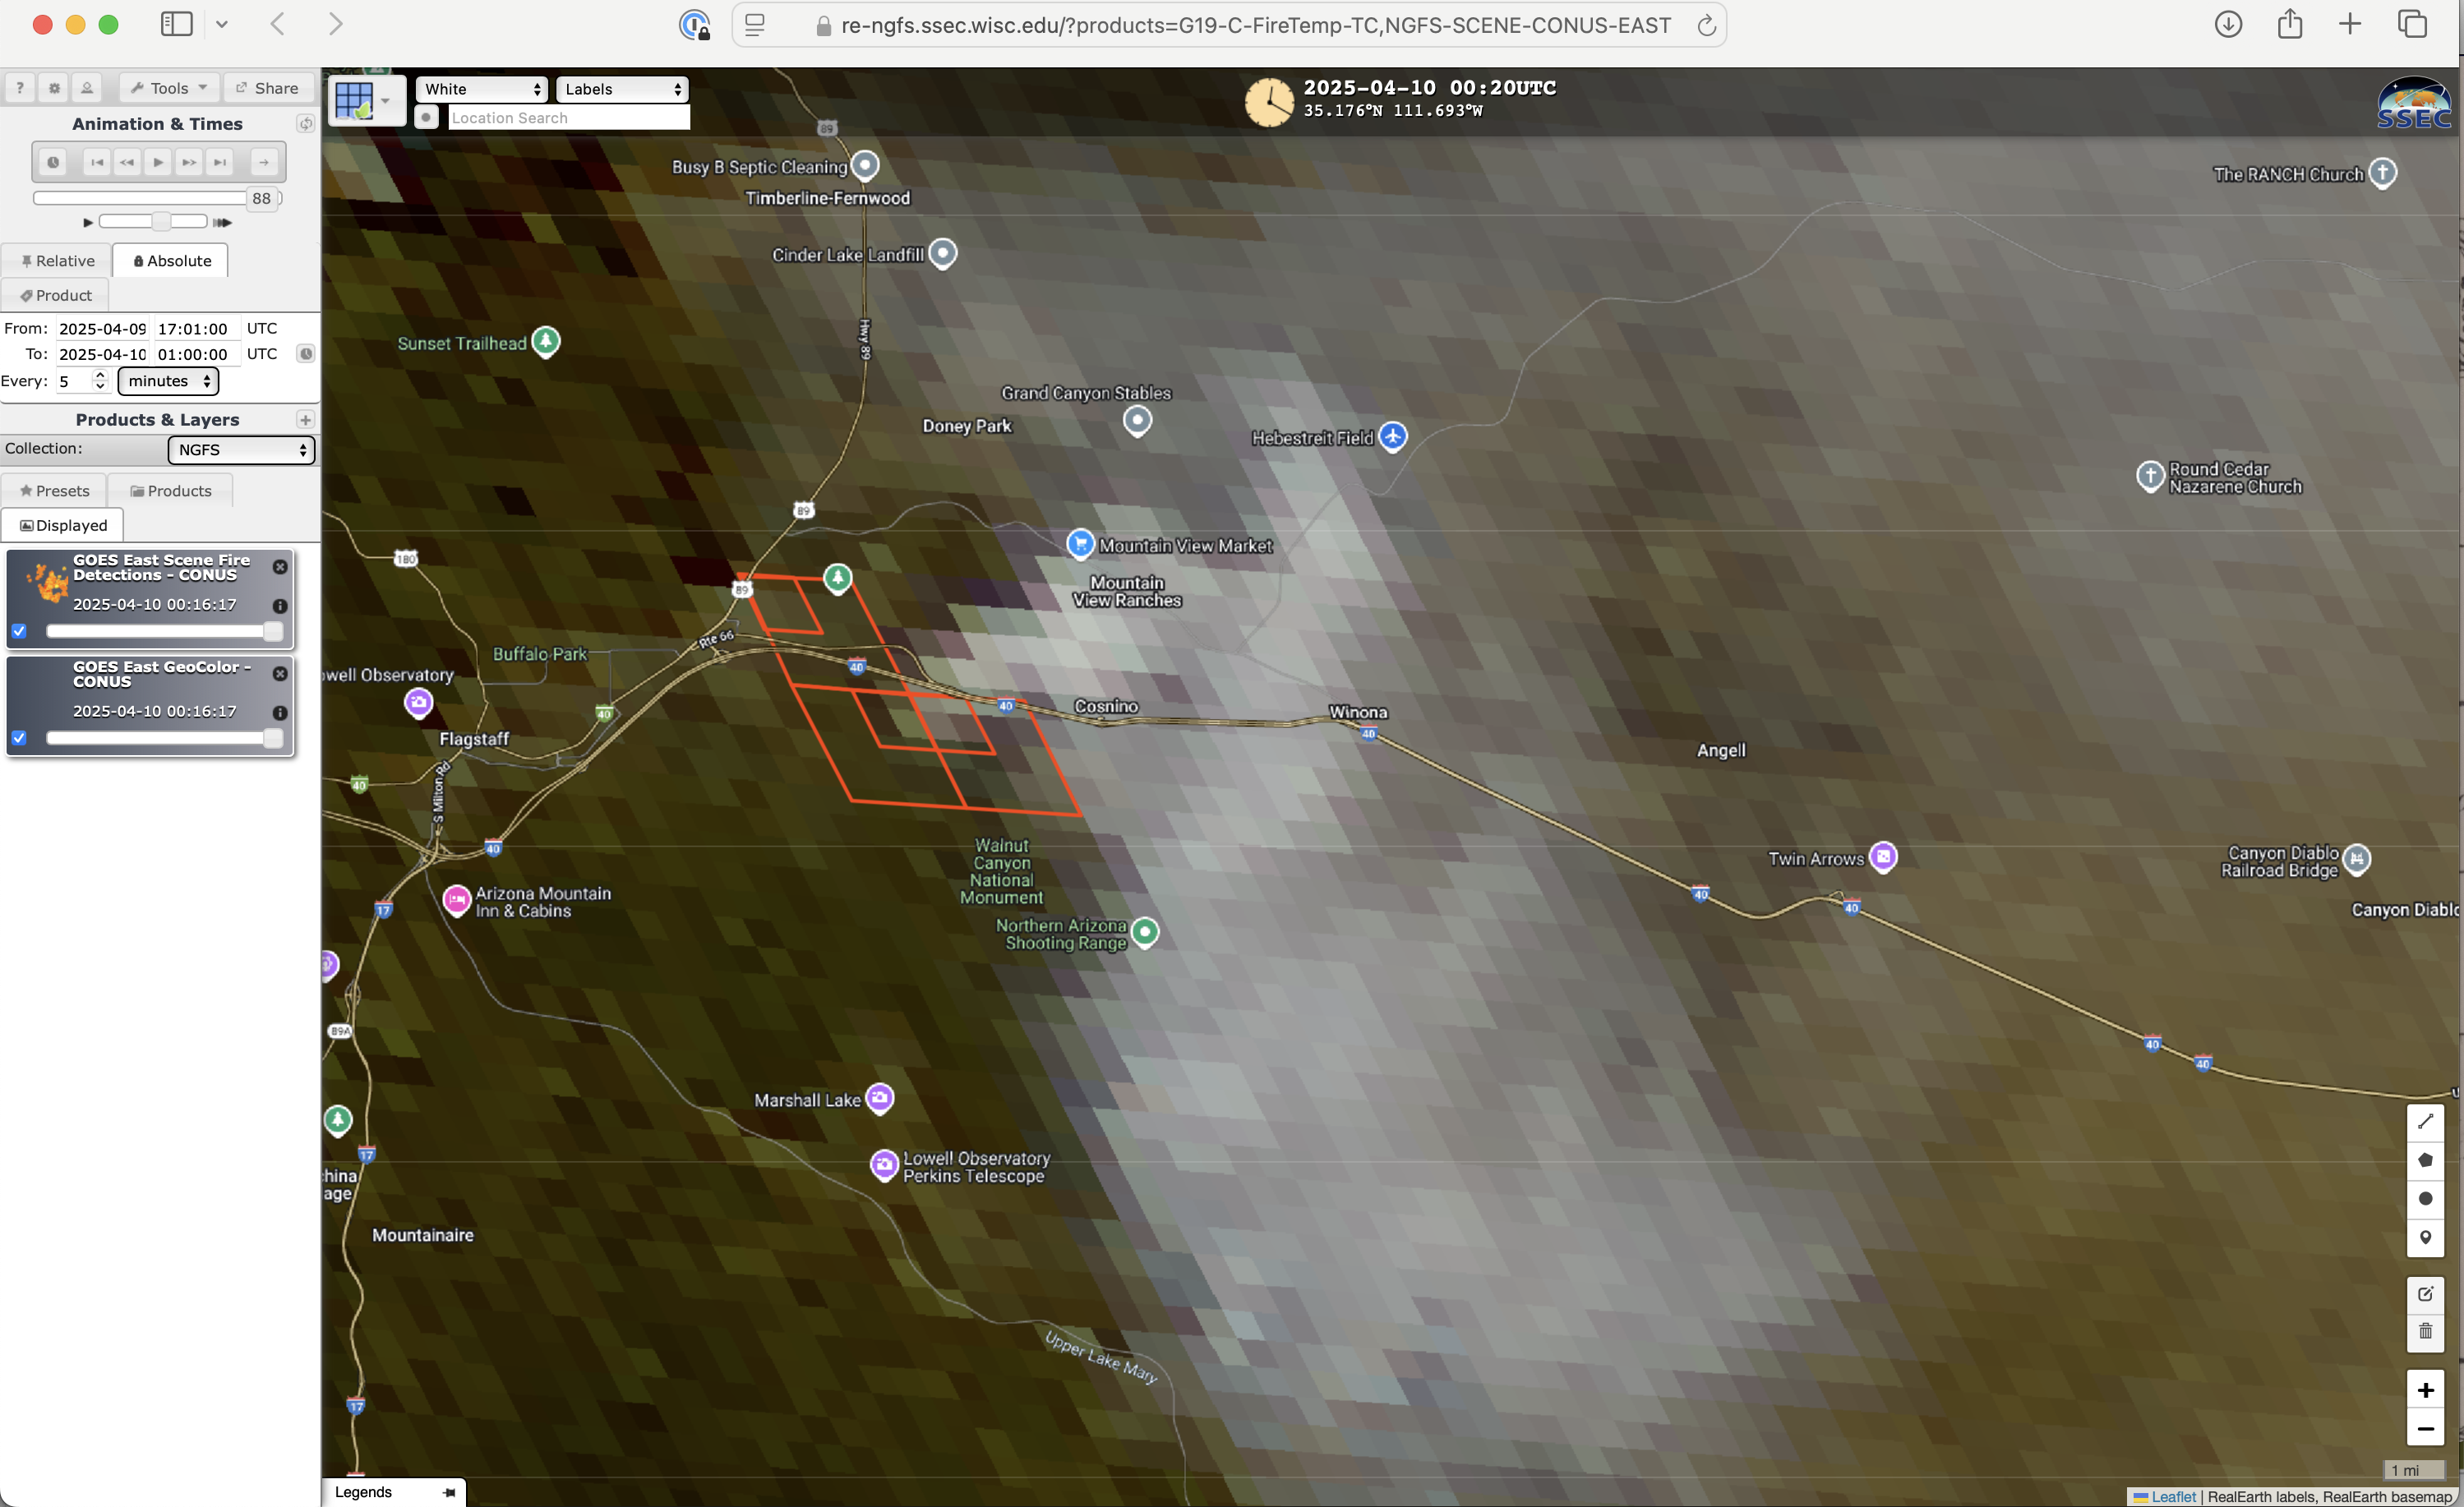
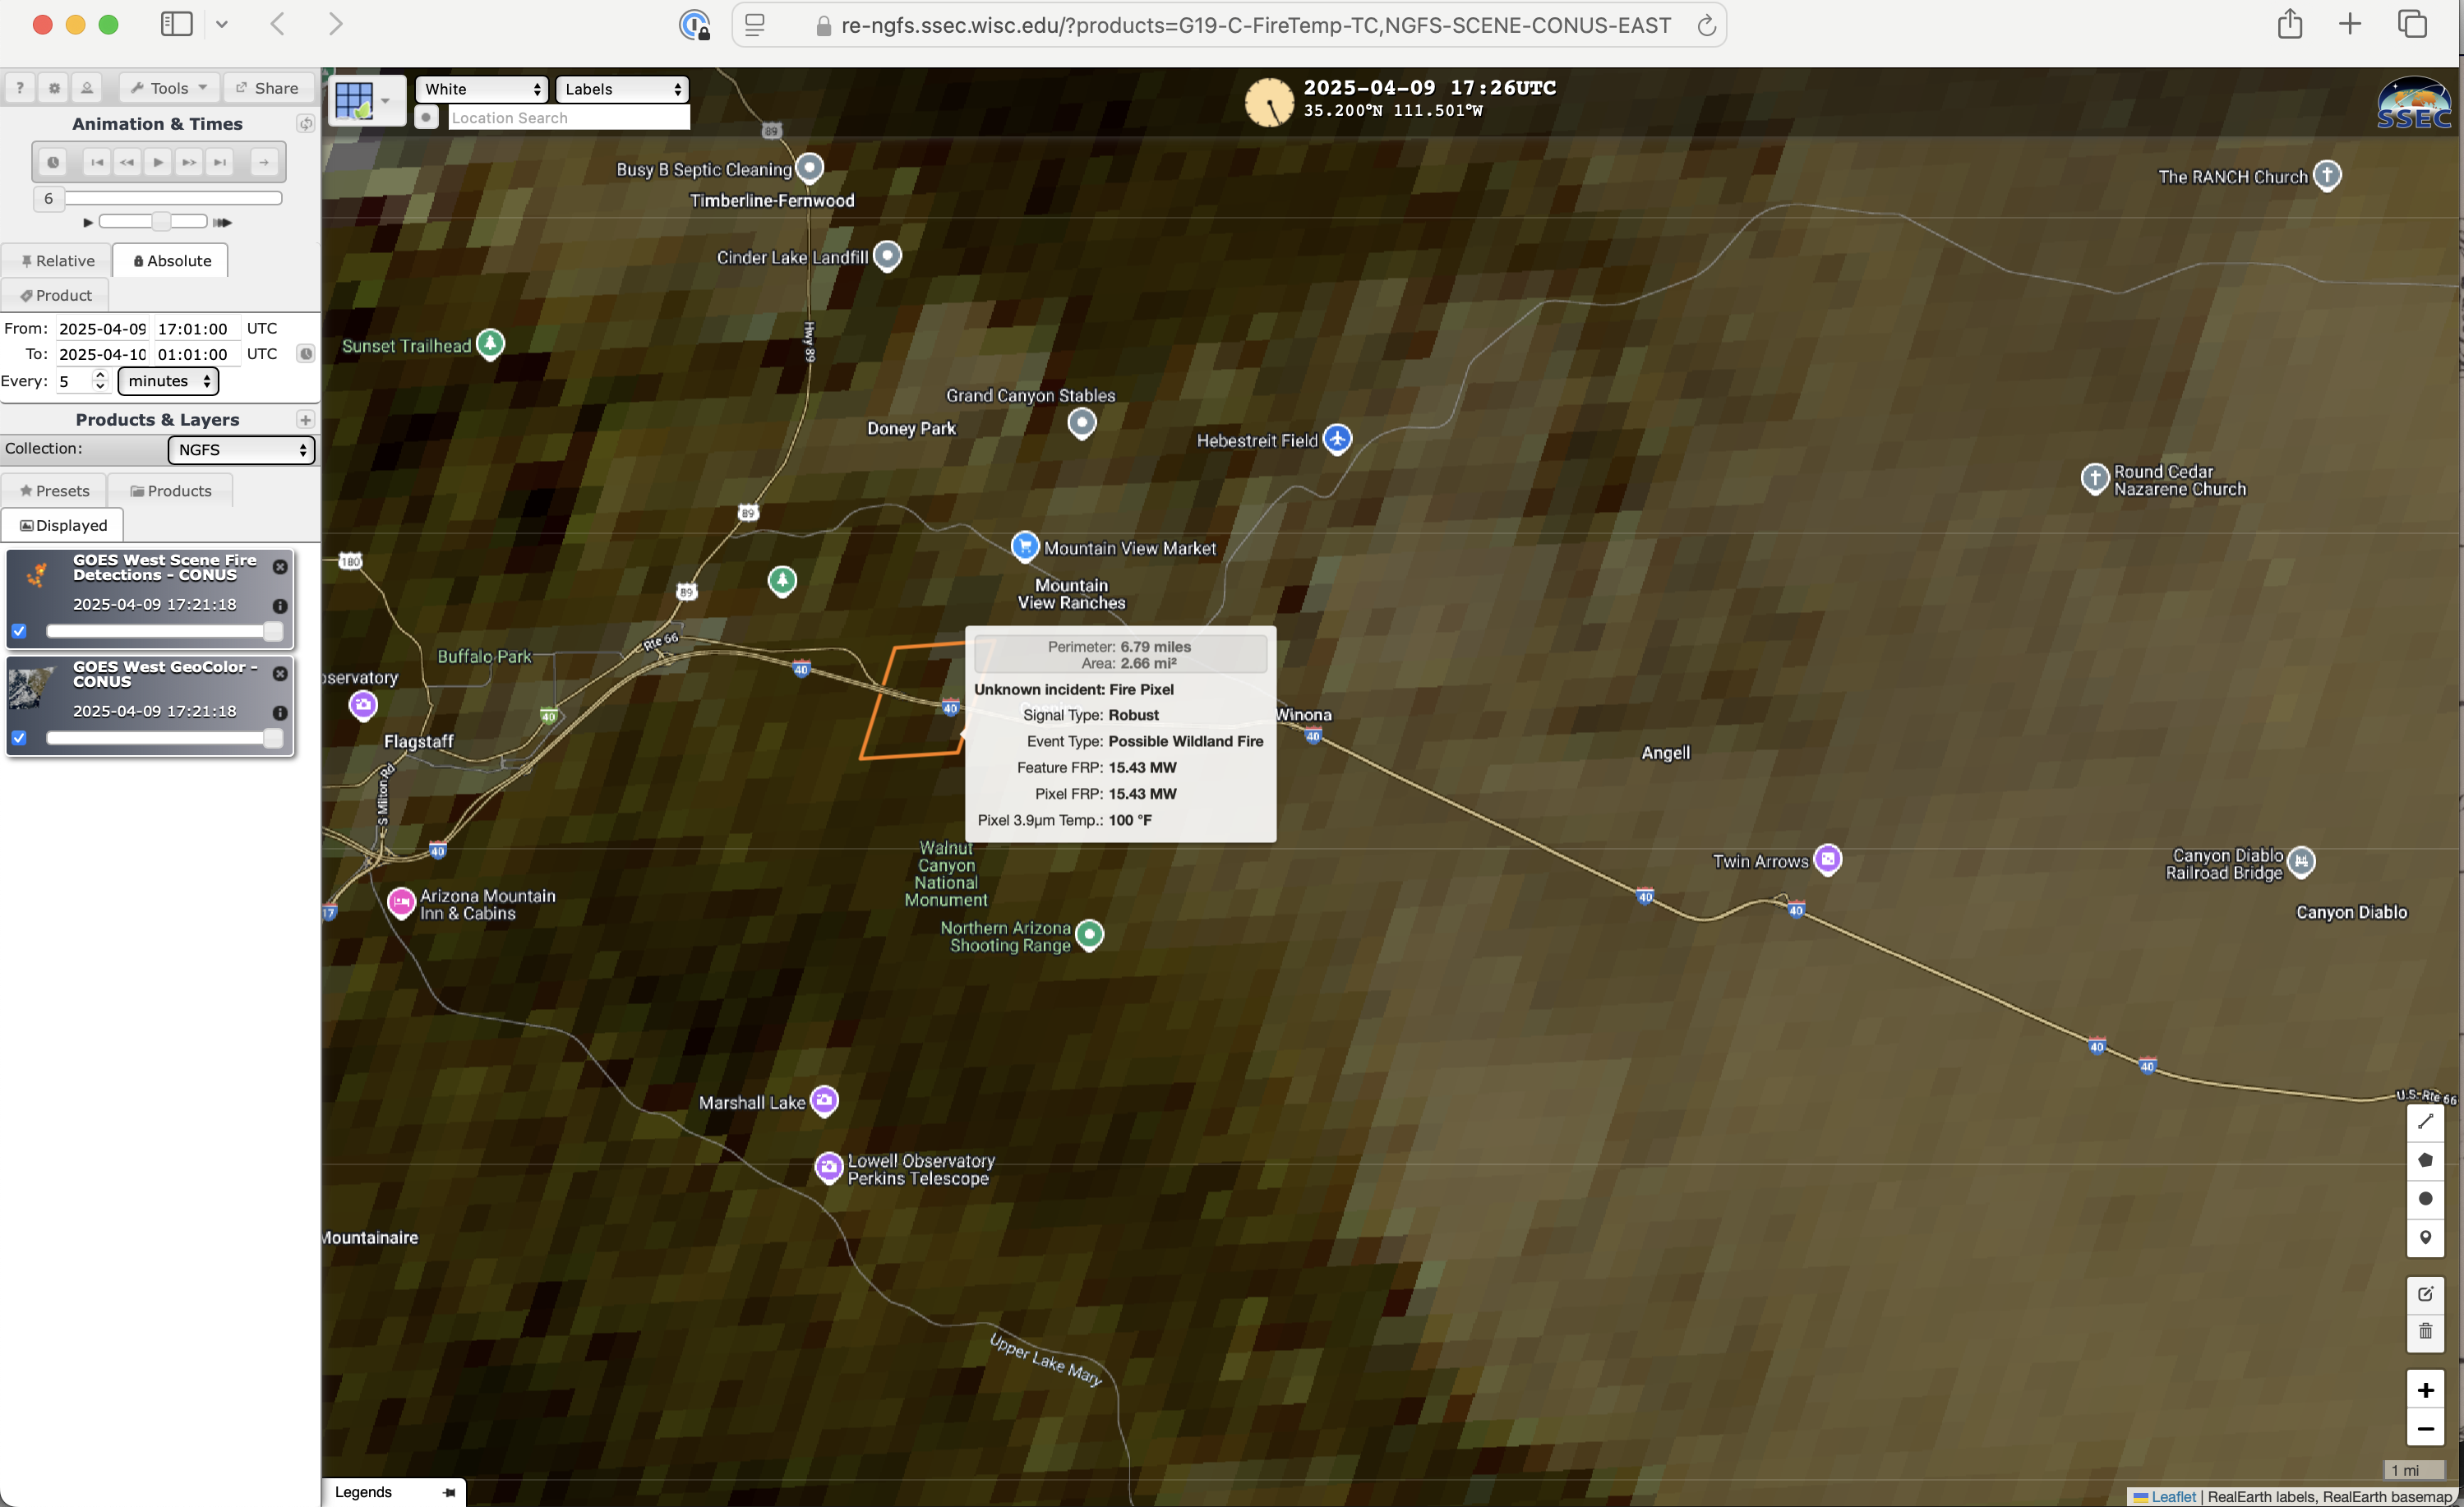
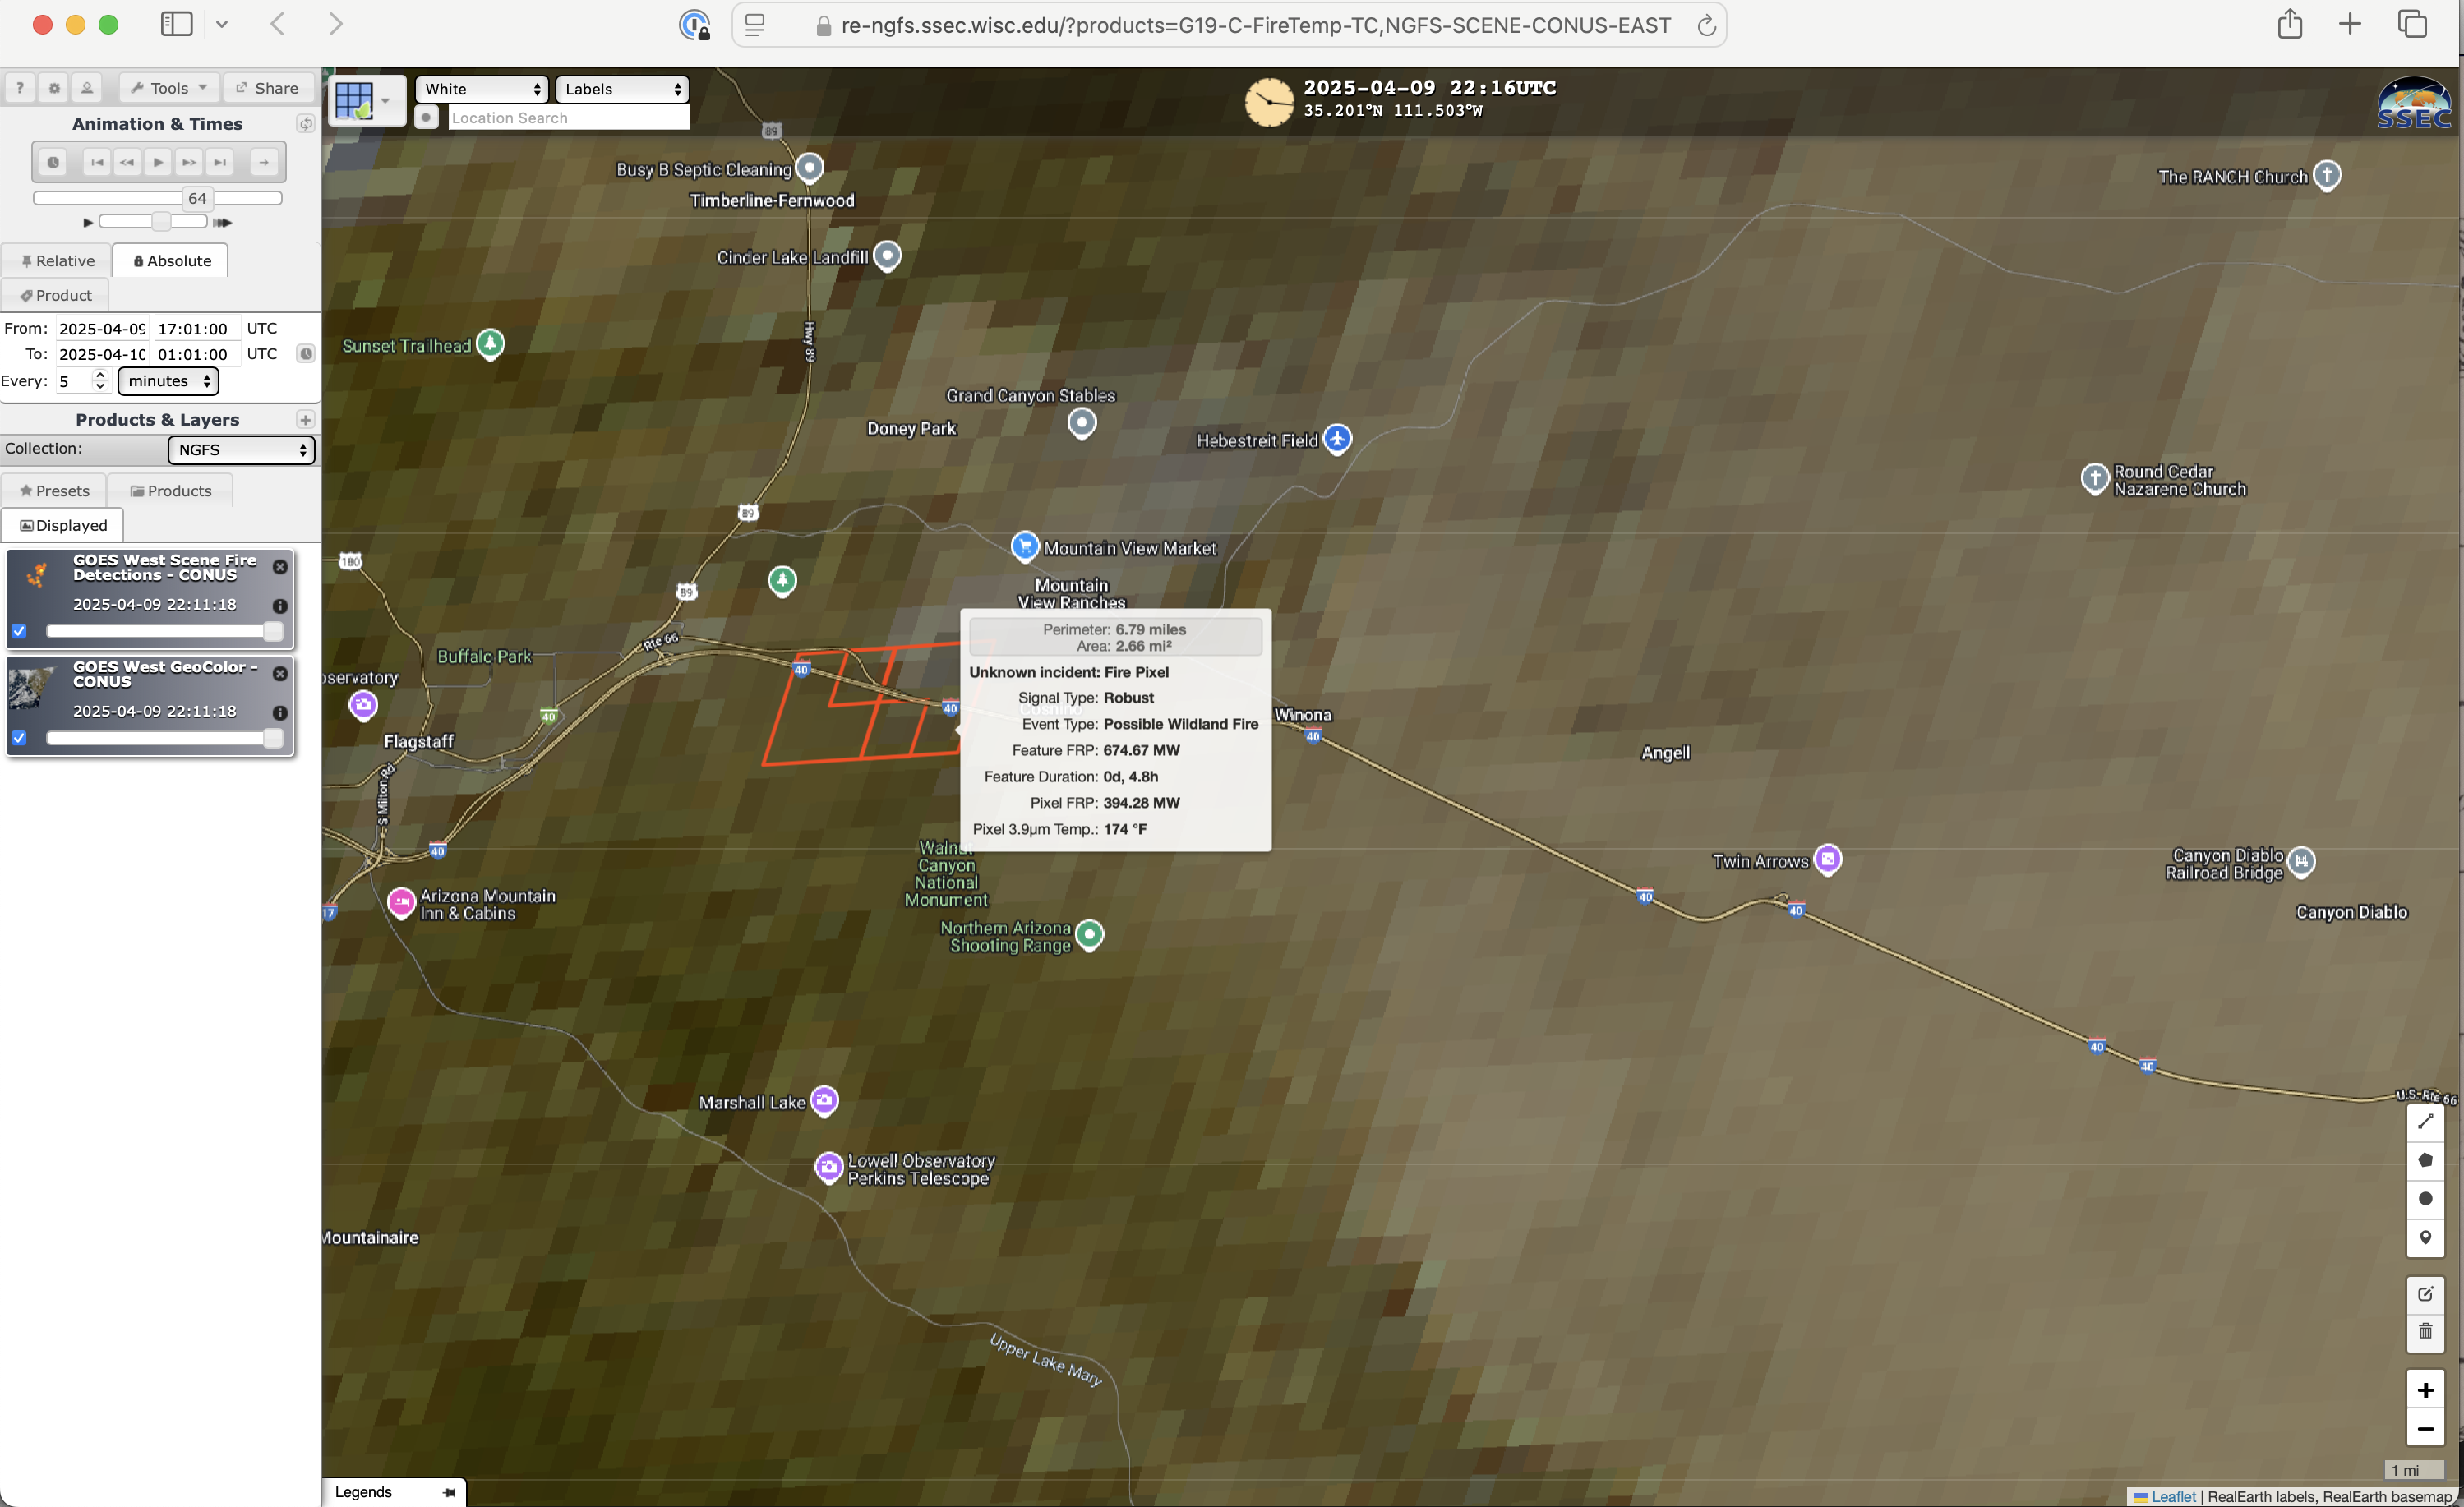
GOES-18 (GOES-West) GeoColor RGB images with an overlay of NGFS fire detection polygons, from 1701 UTC on 09 April to 0101 UTC on 10 April [click to play MP4 animation]

Beginning with GOES-18/GOES-West NGFS imagery (above), the initial detection of a thermal anomaly for this prescribed burn occurred at 1726 UTC — with the maximum Feature Fire Radiative Power (674.67 MW) and Pixel 3.9 µm Temperature (174 ºF) being detected 4.8 hours later at 
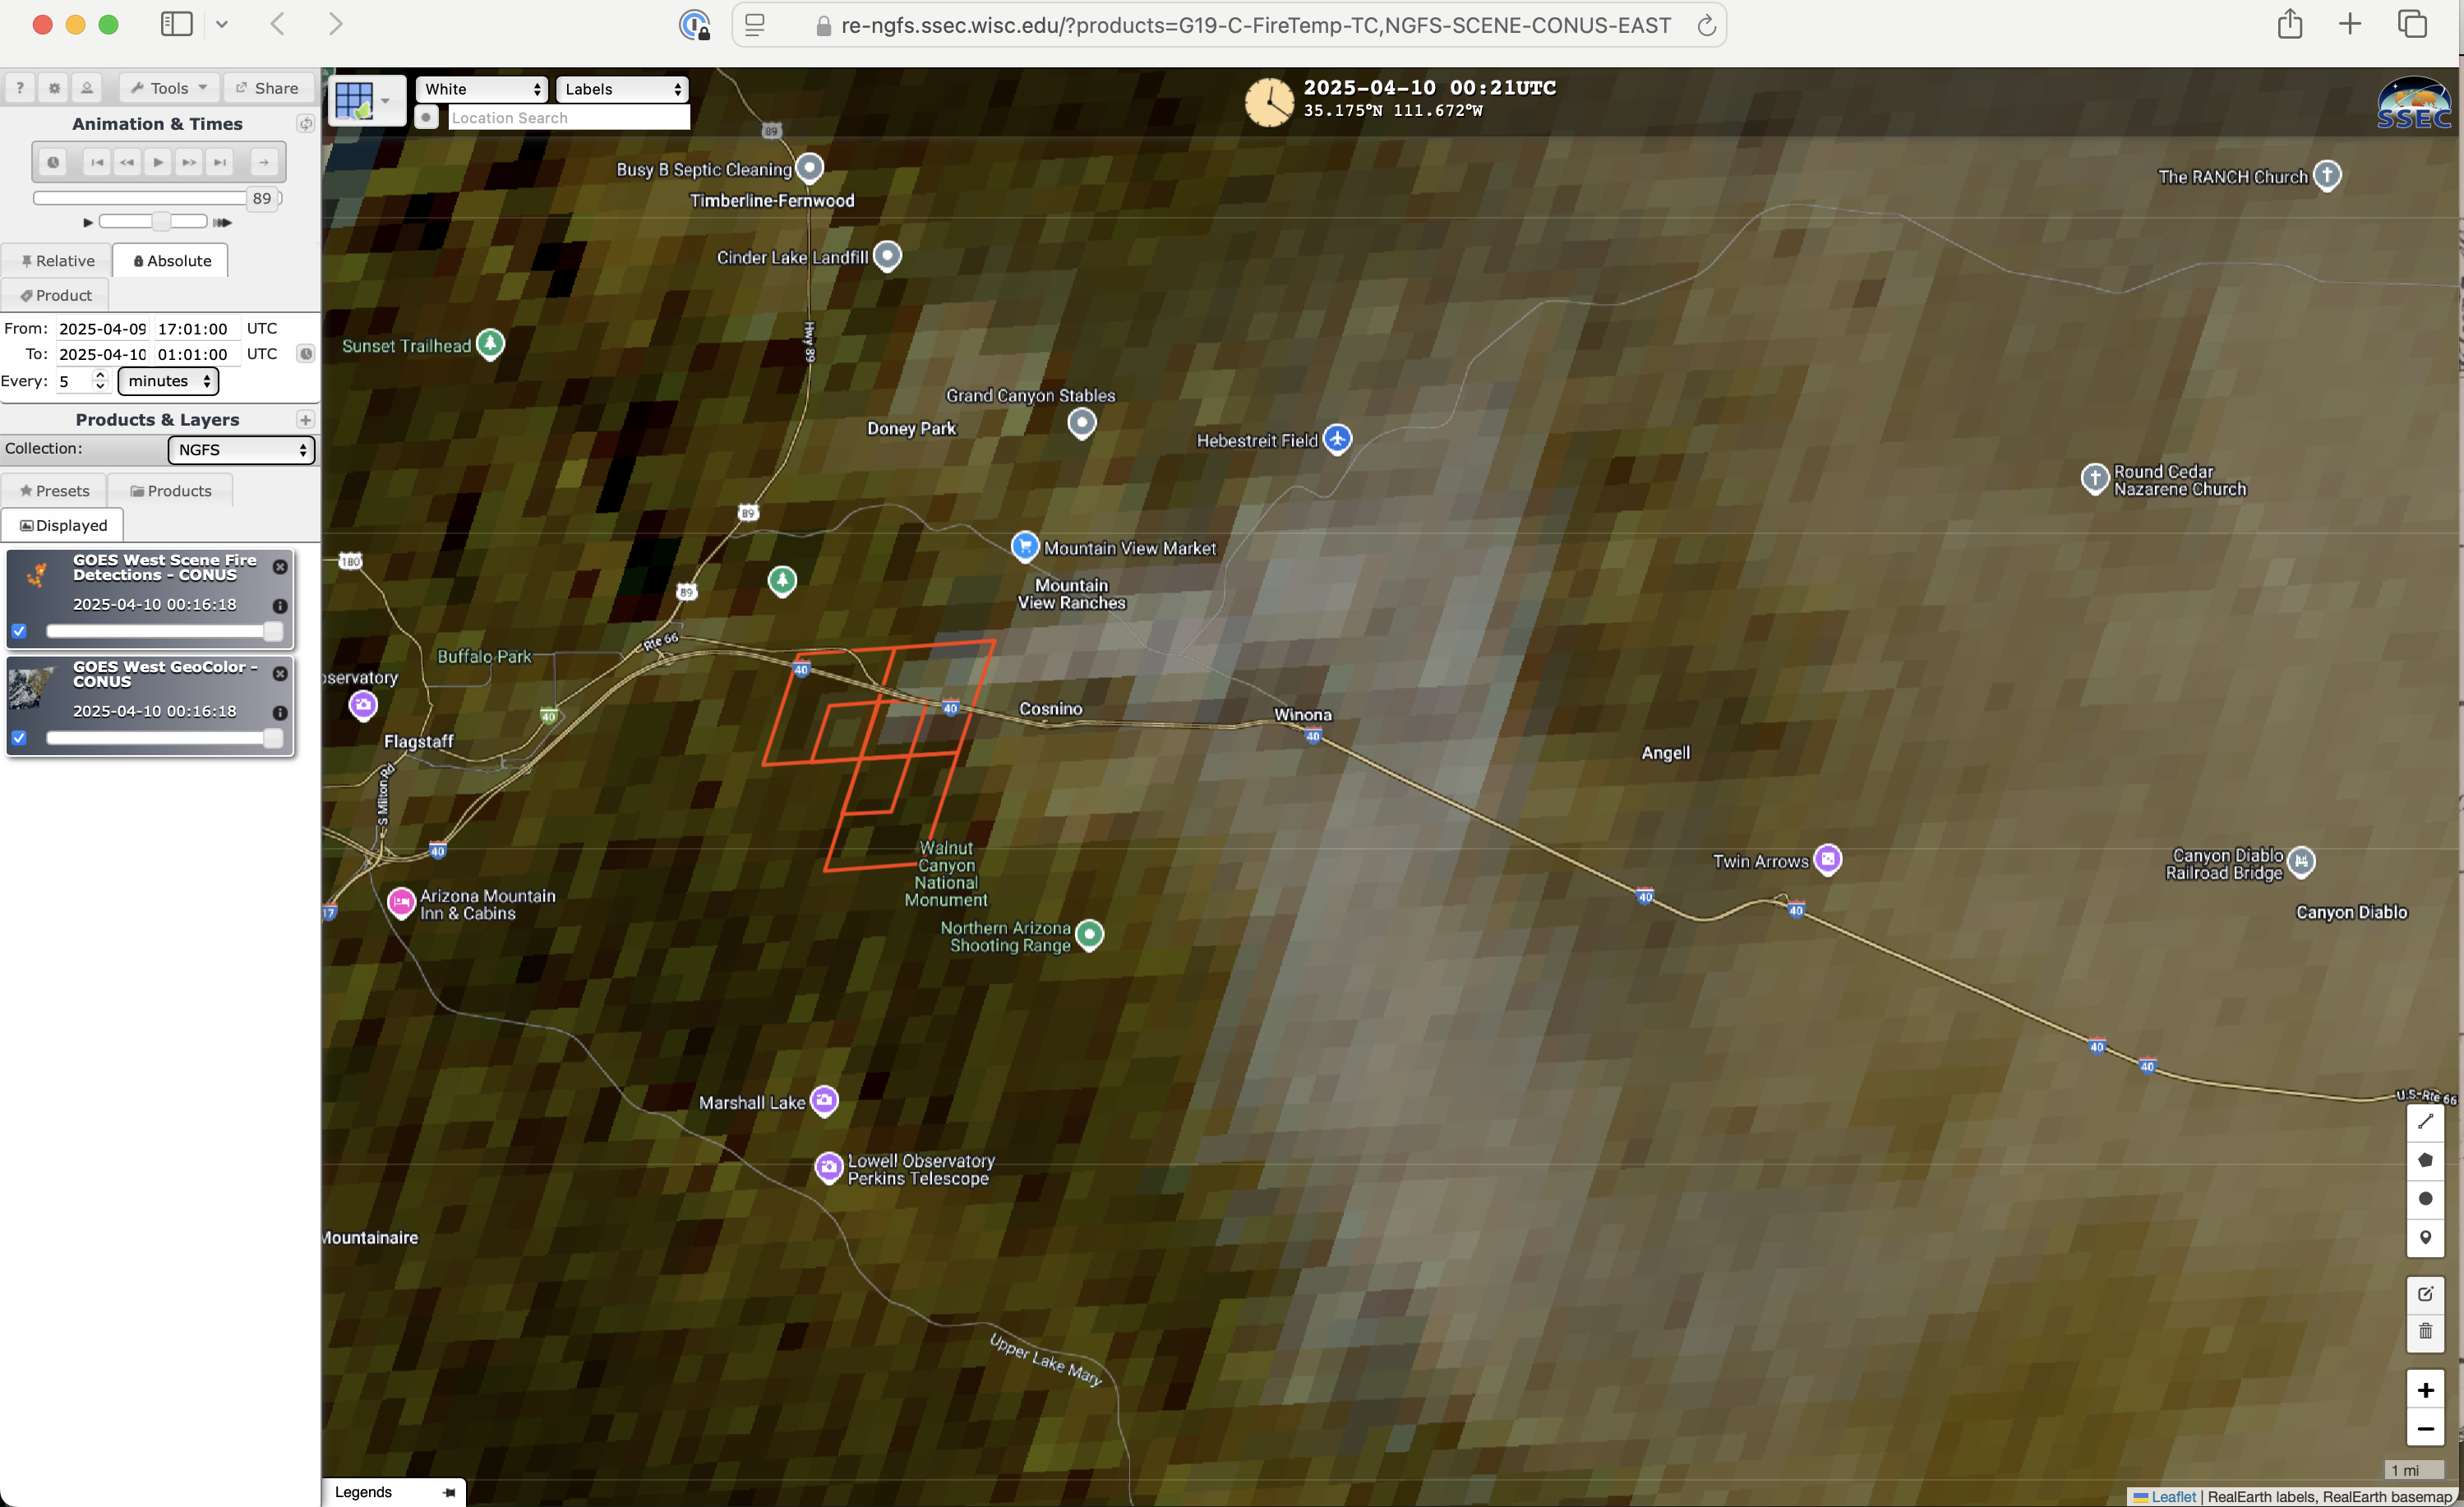
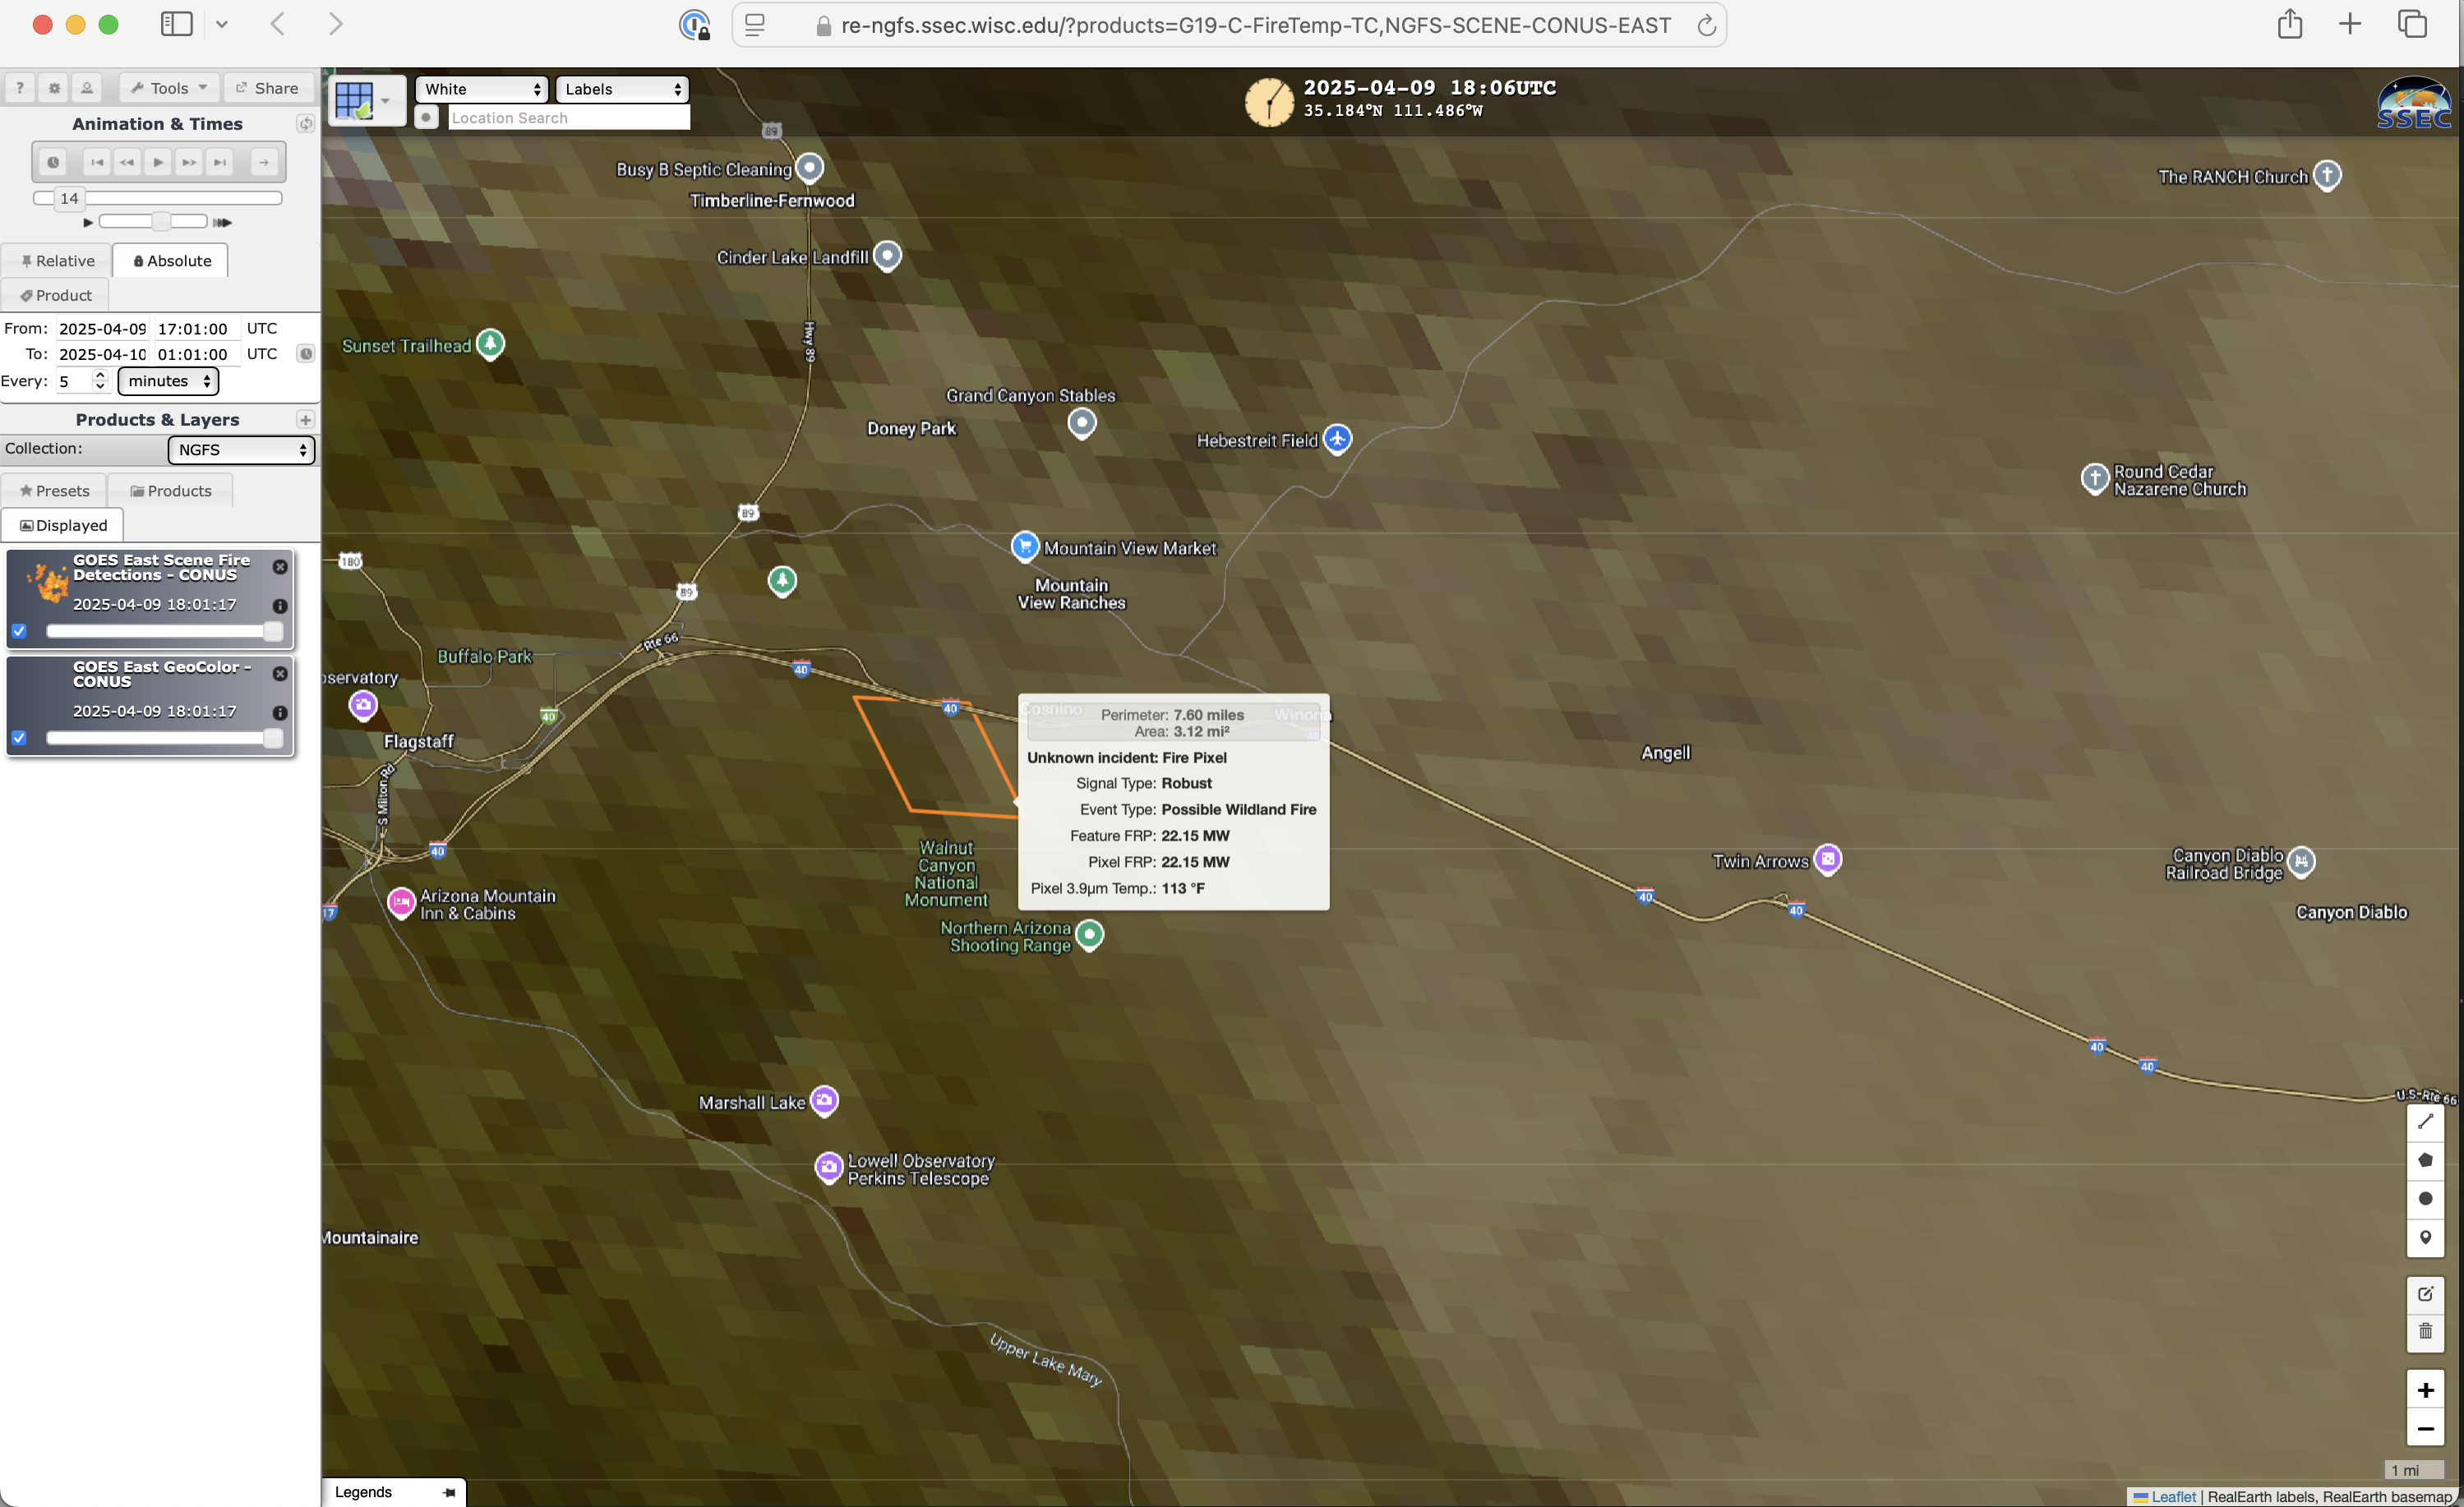
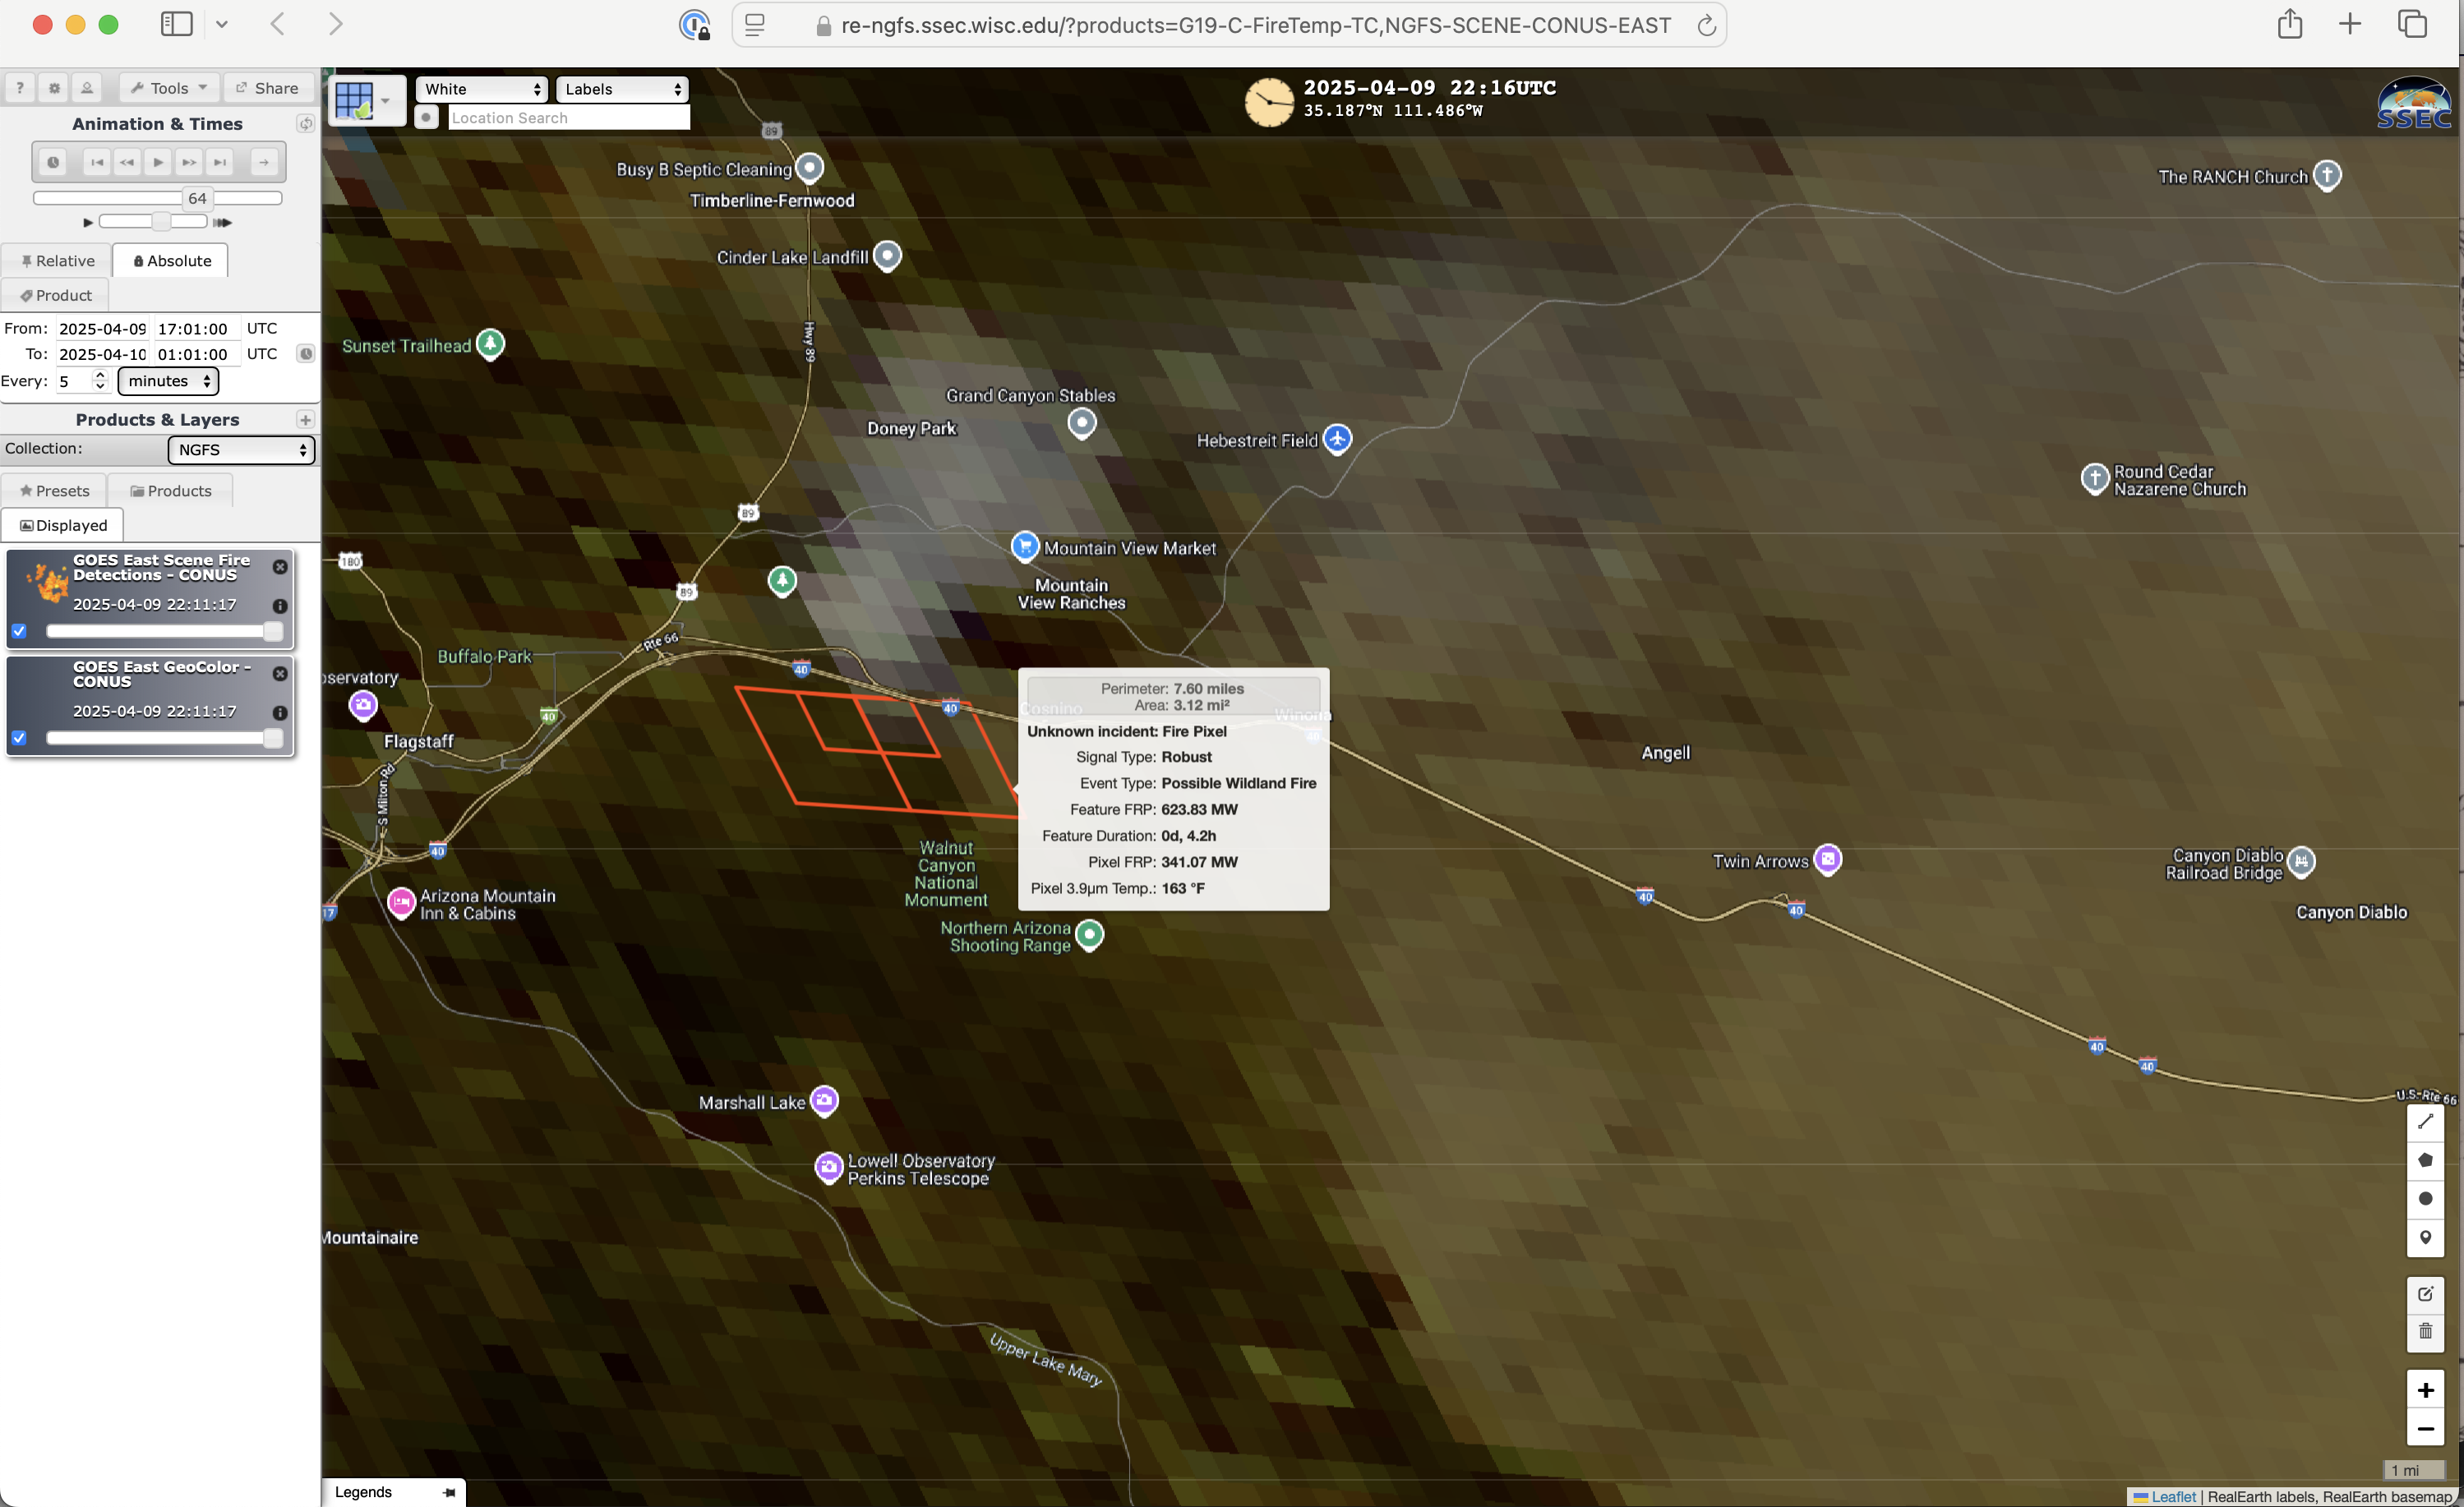
2216 UTC. With the corresponding GOES-19/GOES-East NGFS imagery (below), the initial detection of a thermal anomaly for this prescribed burn occurred at 1806 UTC — with the maximum Feature Fire Radiative Power (623.83 MW) and Pixel 3.9 µm Temperature (163 ºF) being detected 4.2 hours later at 2216 UTC. This fire produced a rather dense smoke plume, which drifted over parts of Interstate 40 east of Flagstaff.

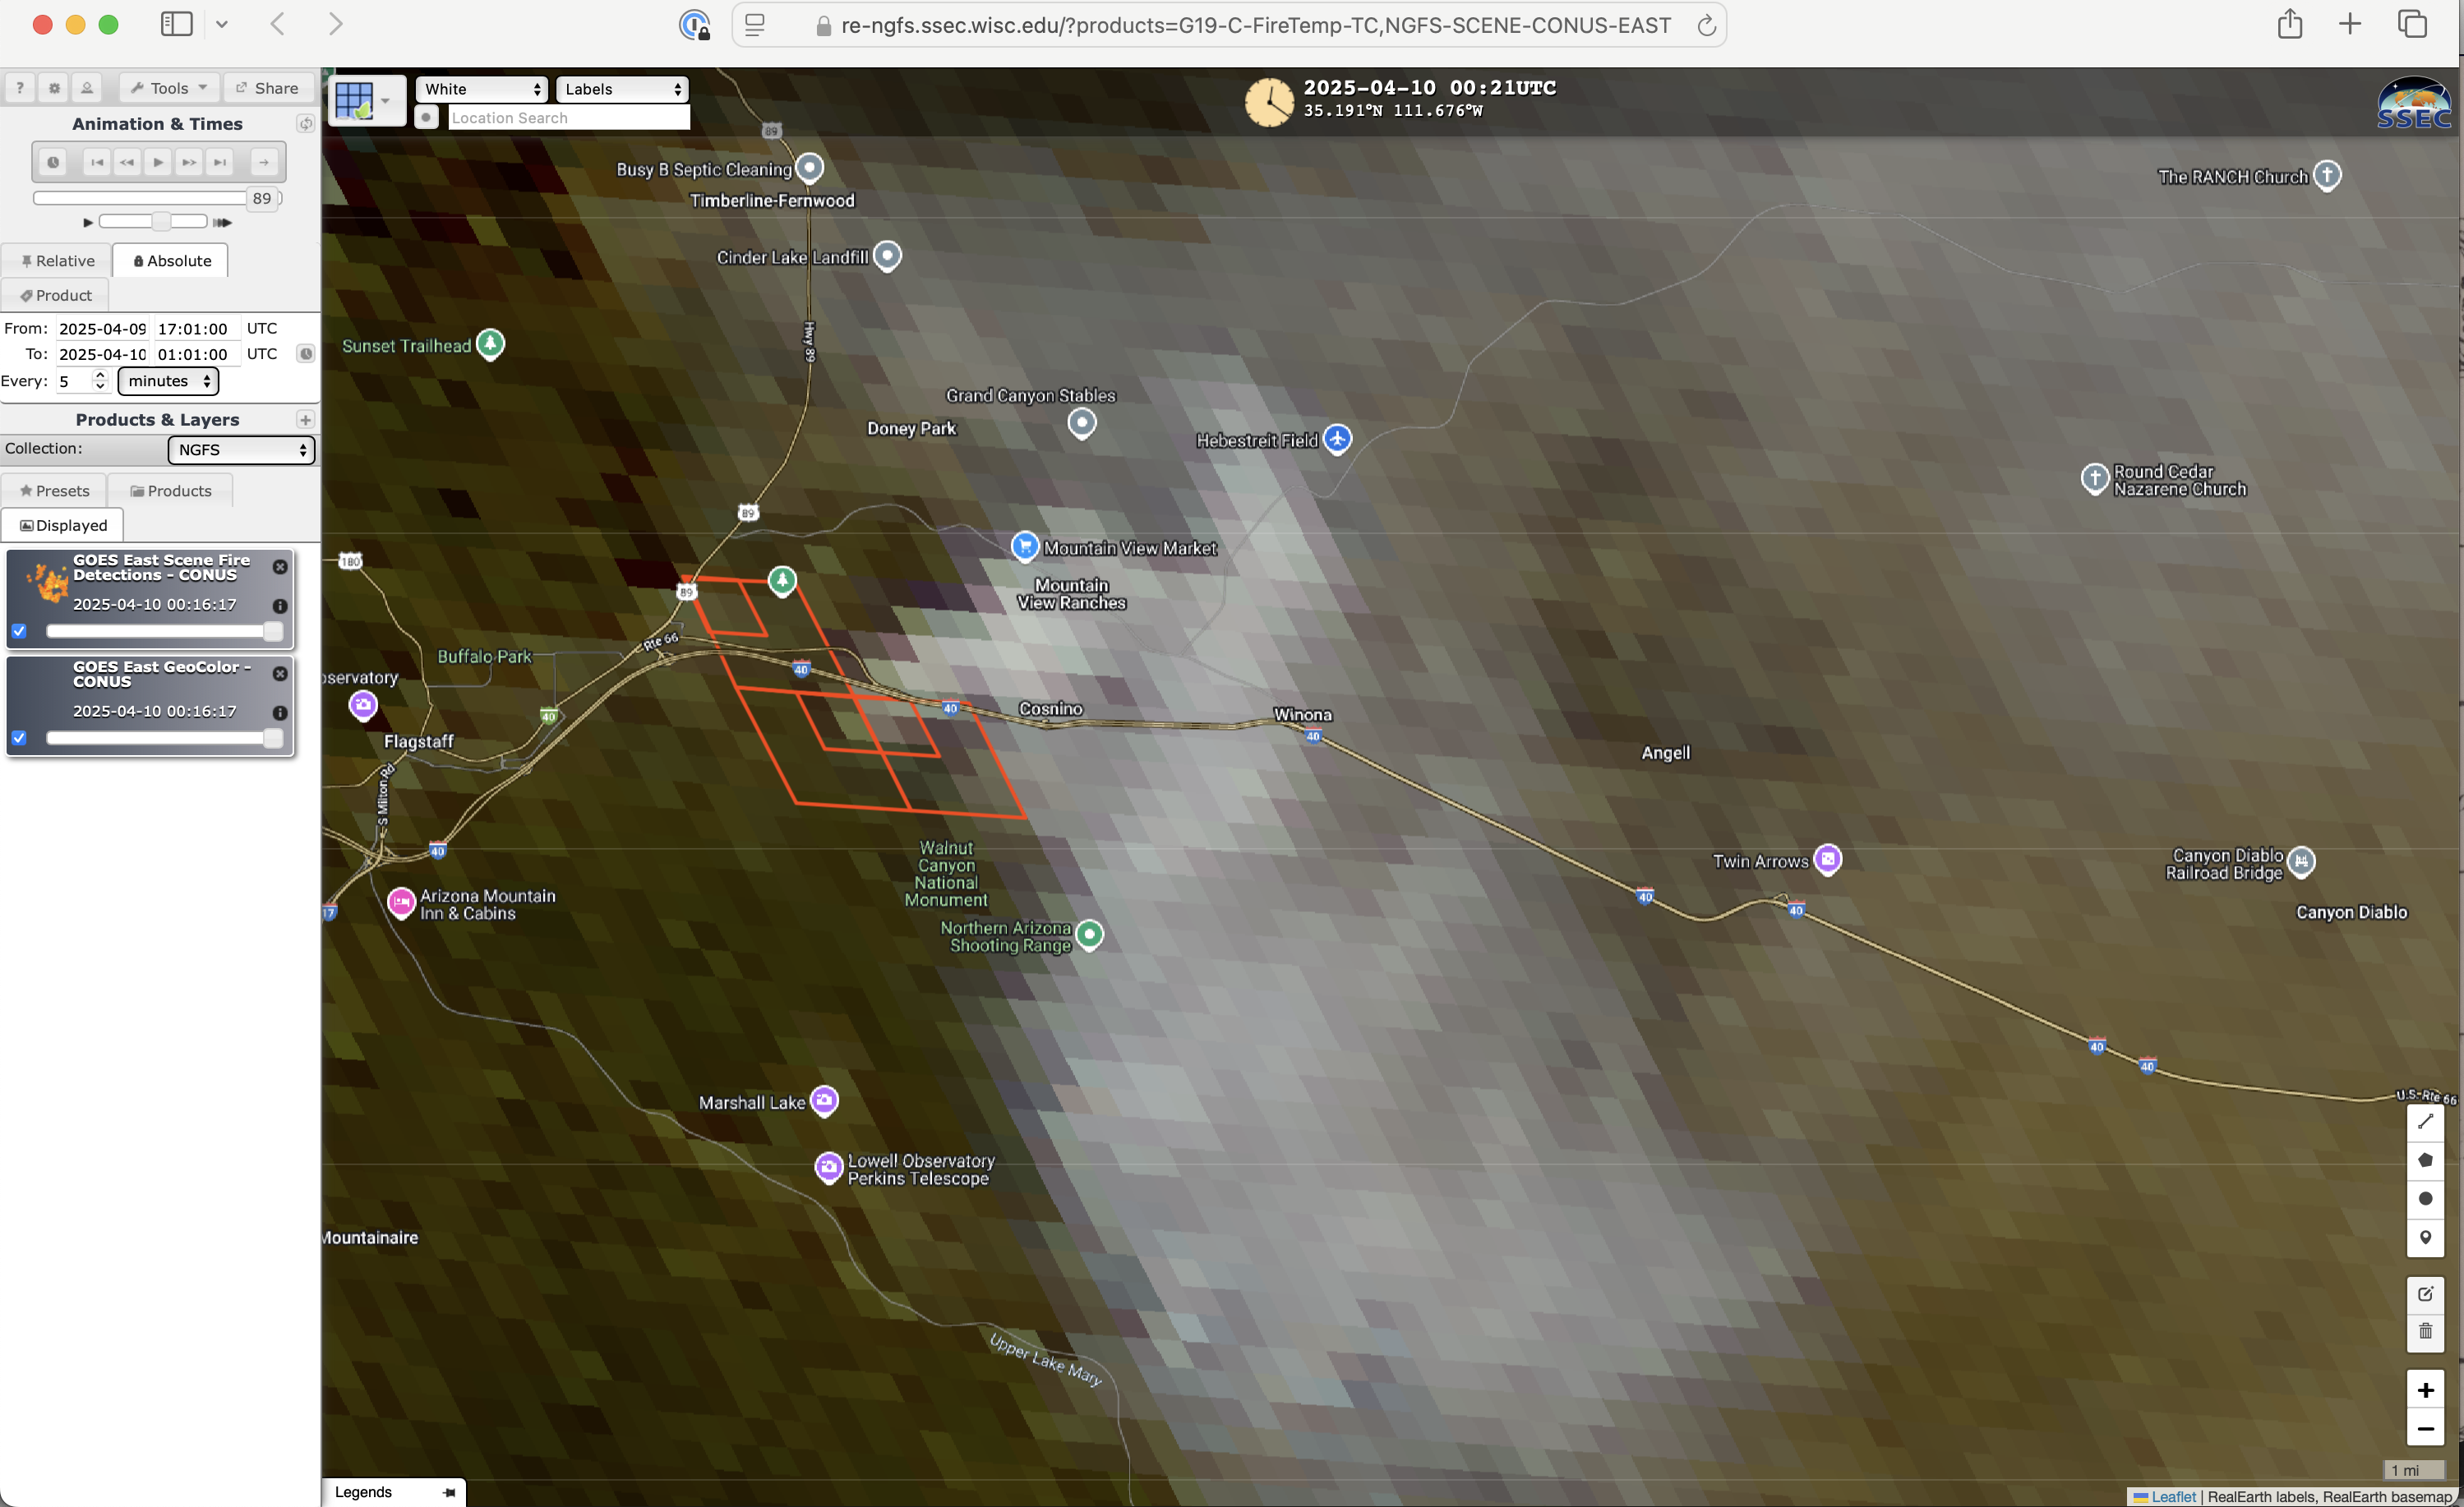
GOES-19 (GOES-East) GeoColor RGB images with an overlay of NGFS fire detection polygons, from 1701 UTC on 09 April to 0101 UTC on 10 April [click to play MP4 animation]

GOES-19 True Color RGB images created using Geo2Grid (below) provided a larger-scale view of the smoke created by this prescribed burn.

GOES-19 True Color RGB images, from 1701 UTC on 09 April to 0126 UTC on 10 April [click to play animated GIF | MP4]

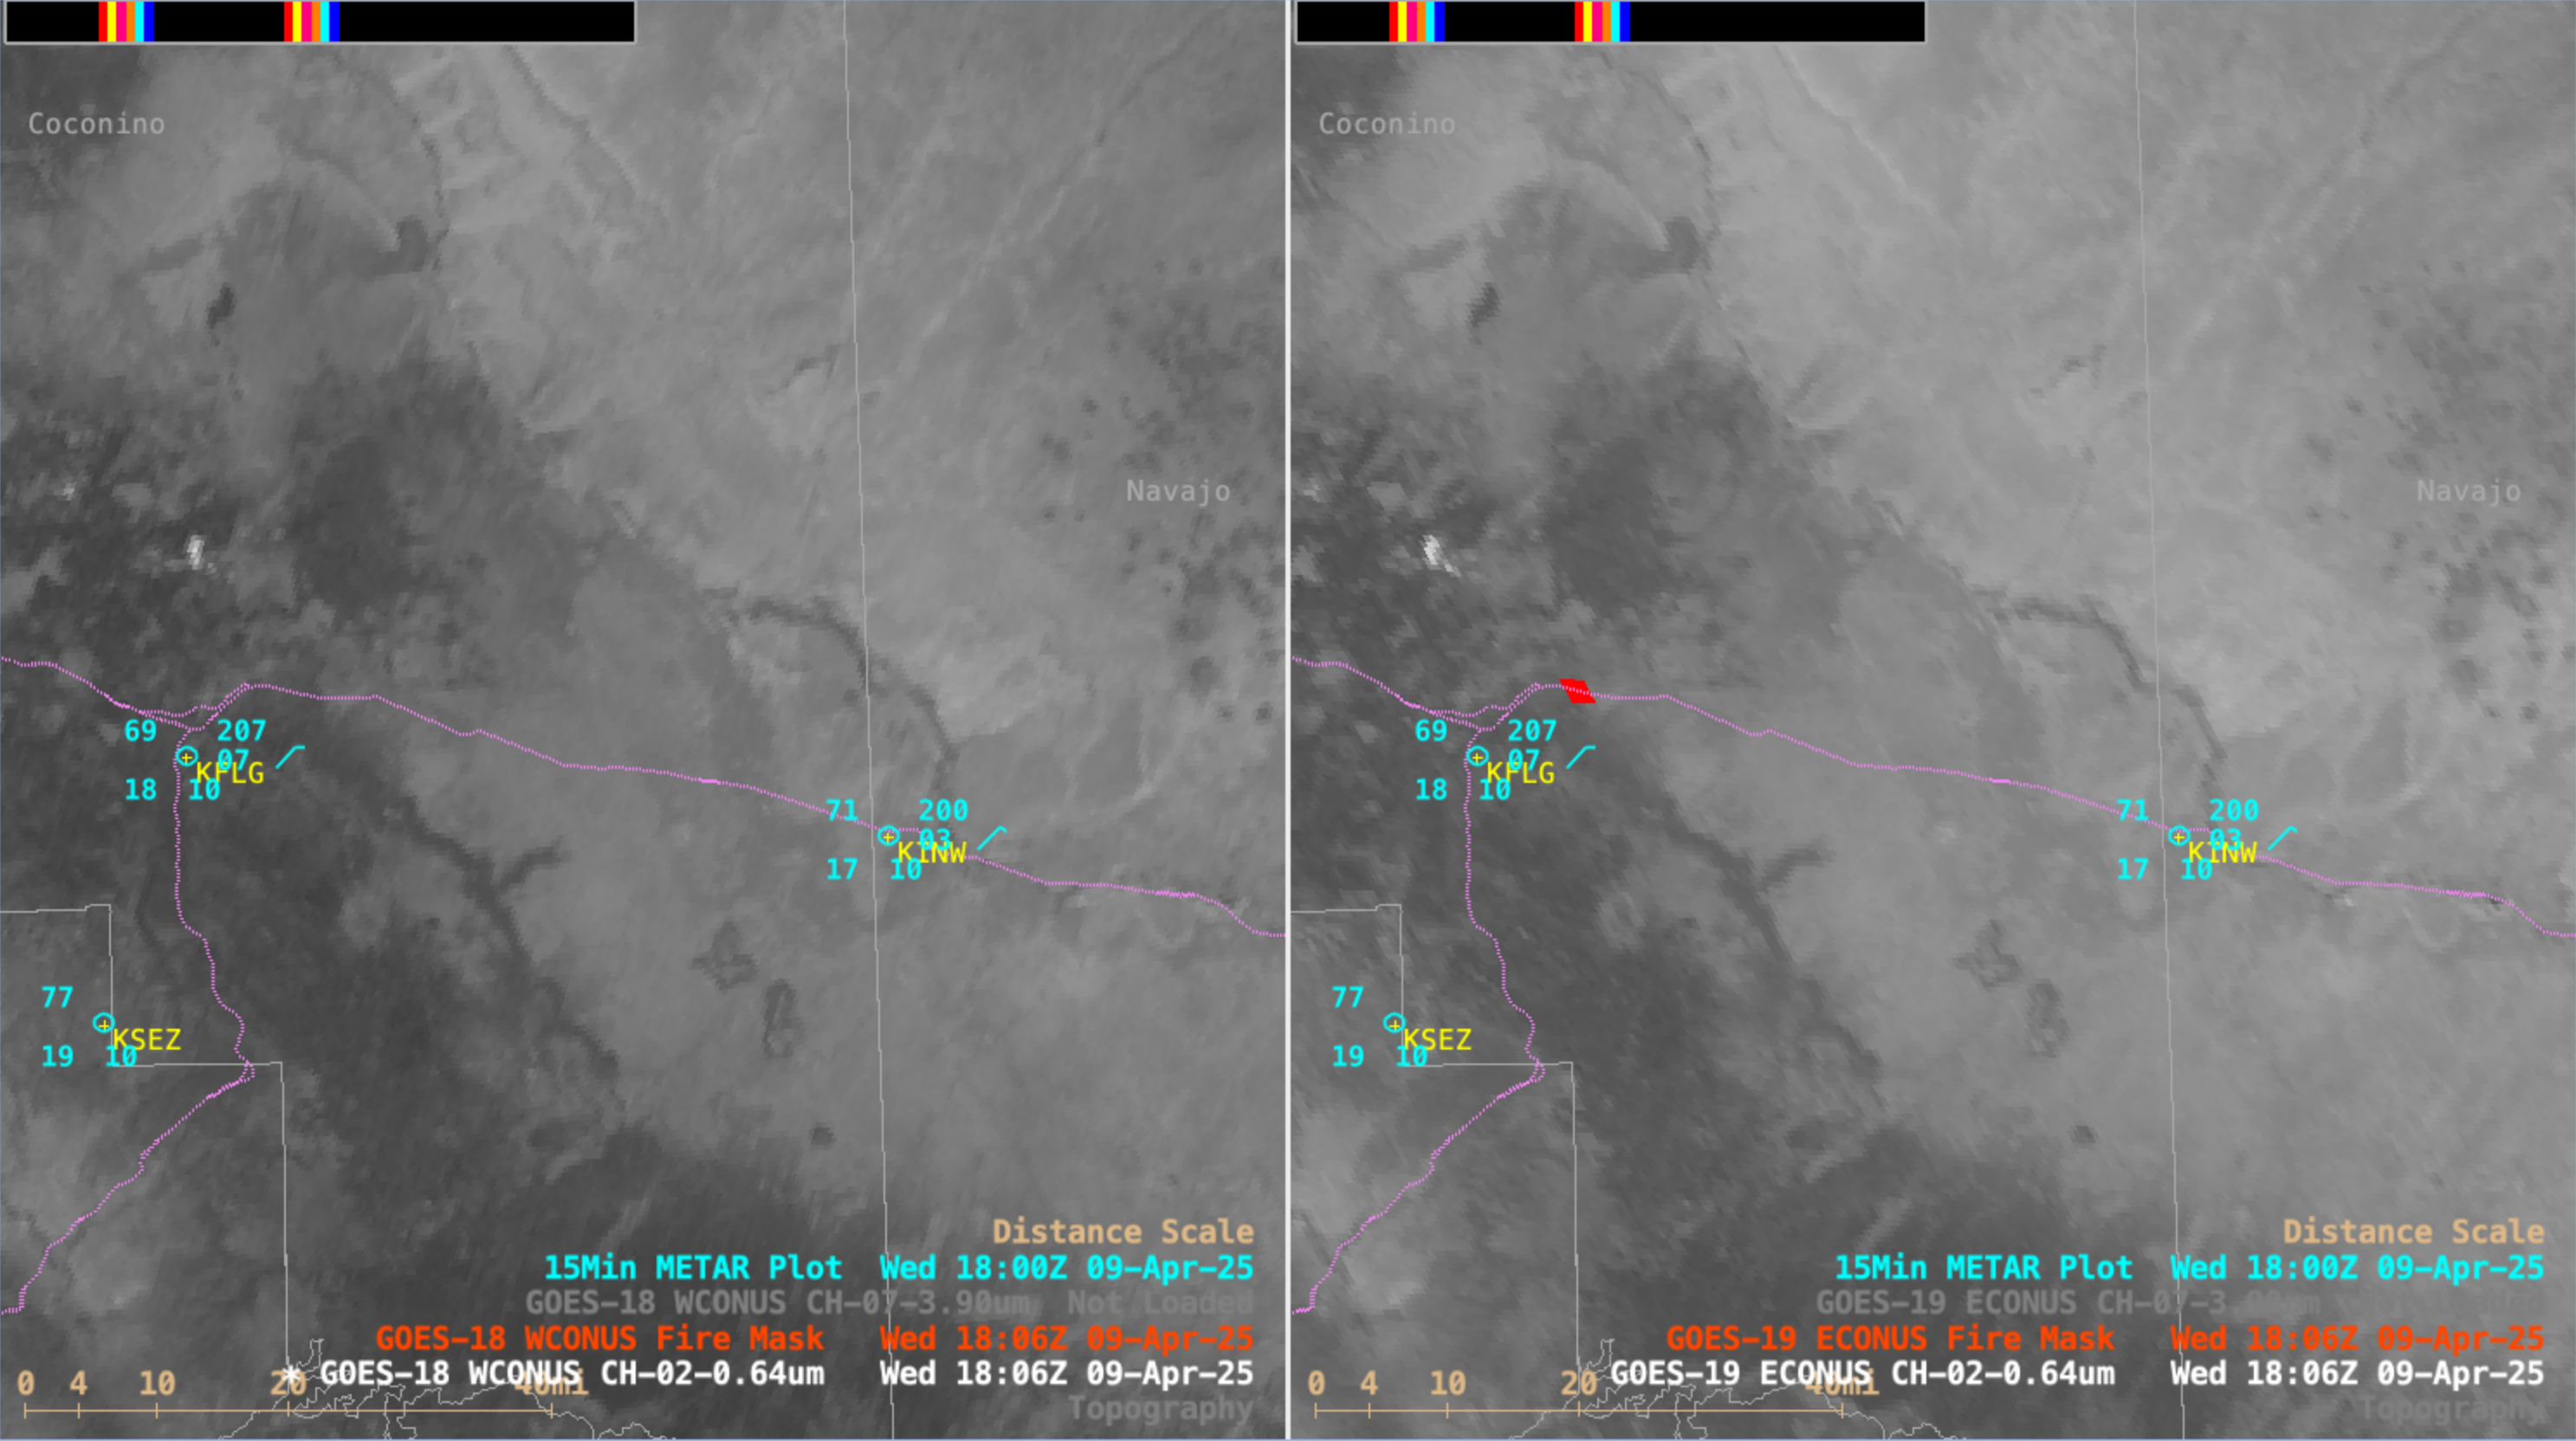
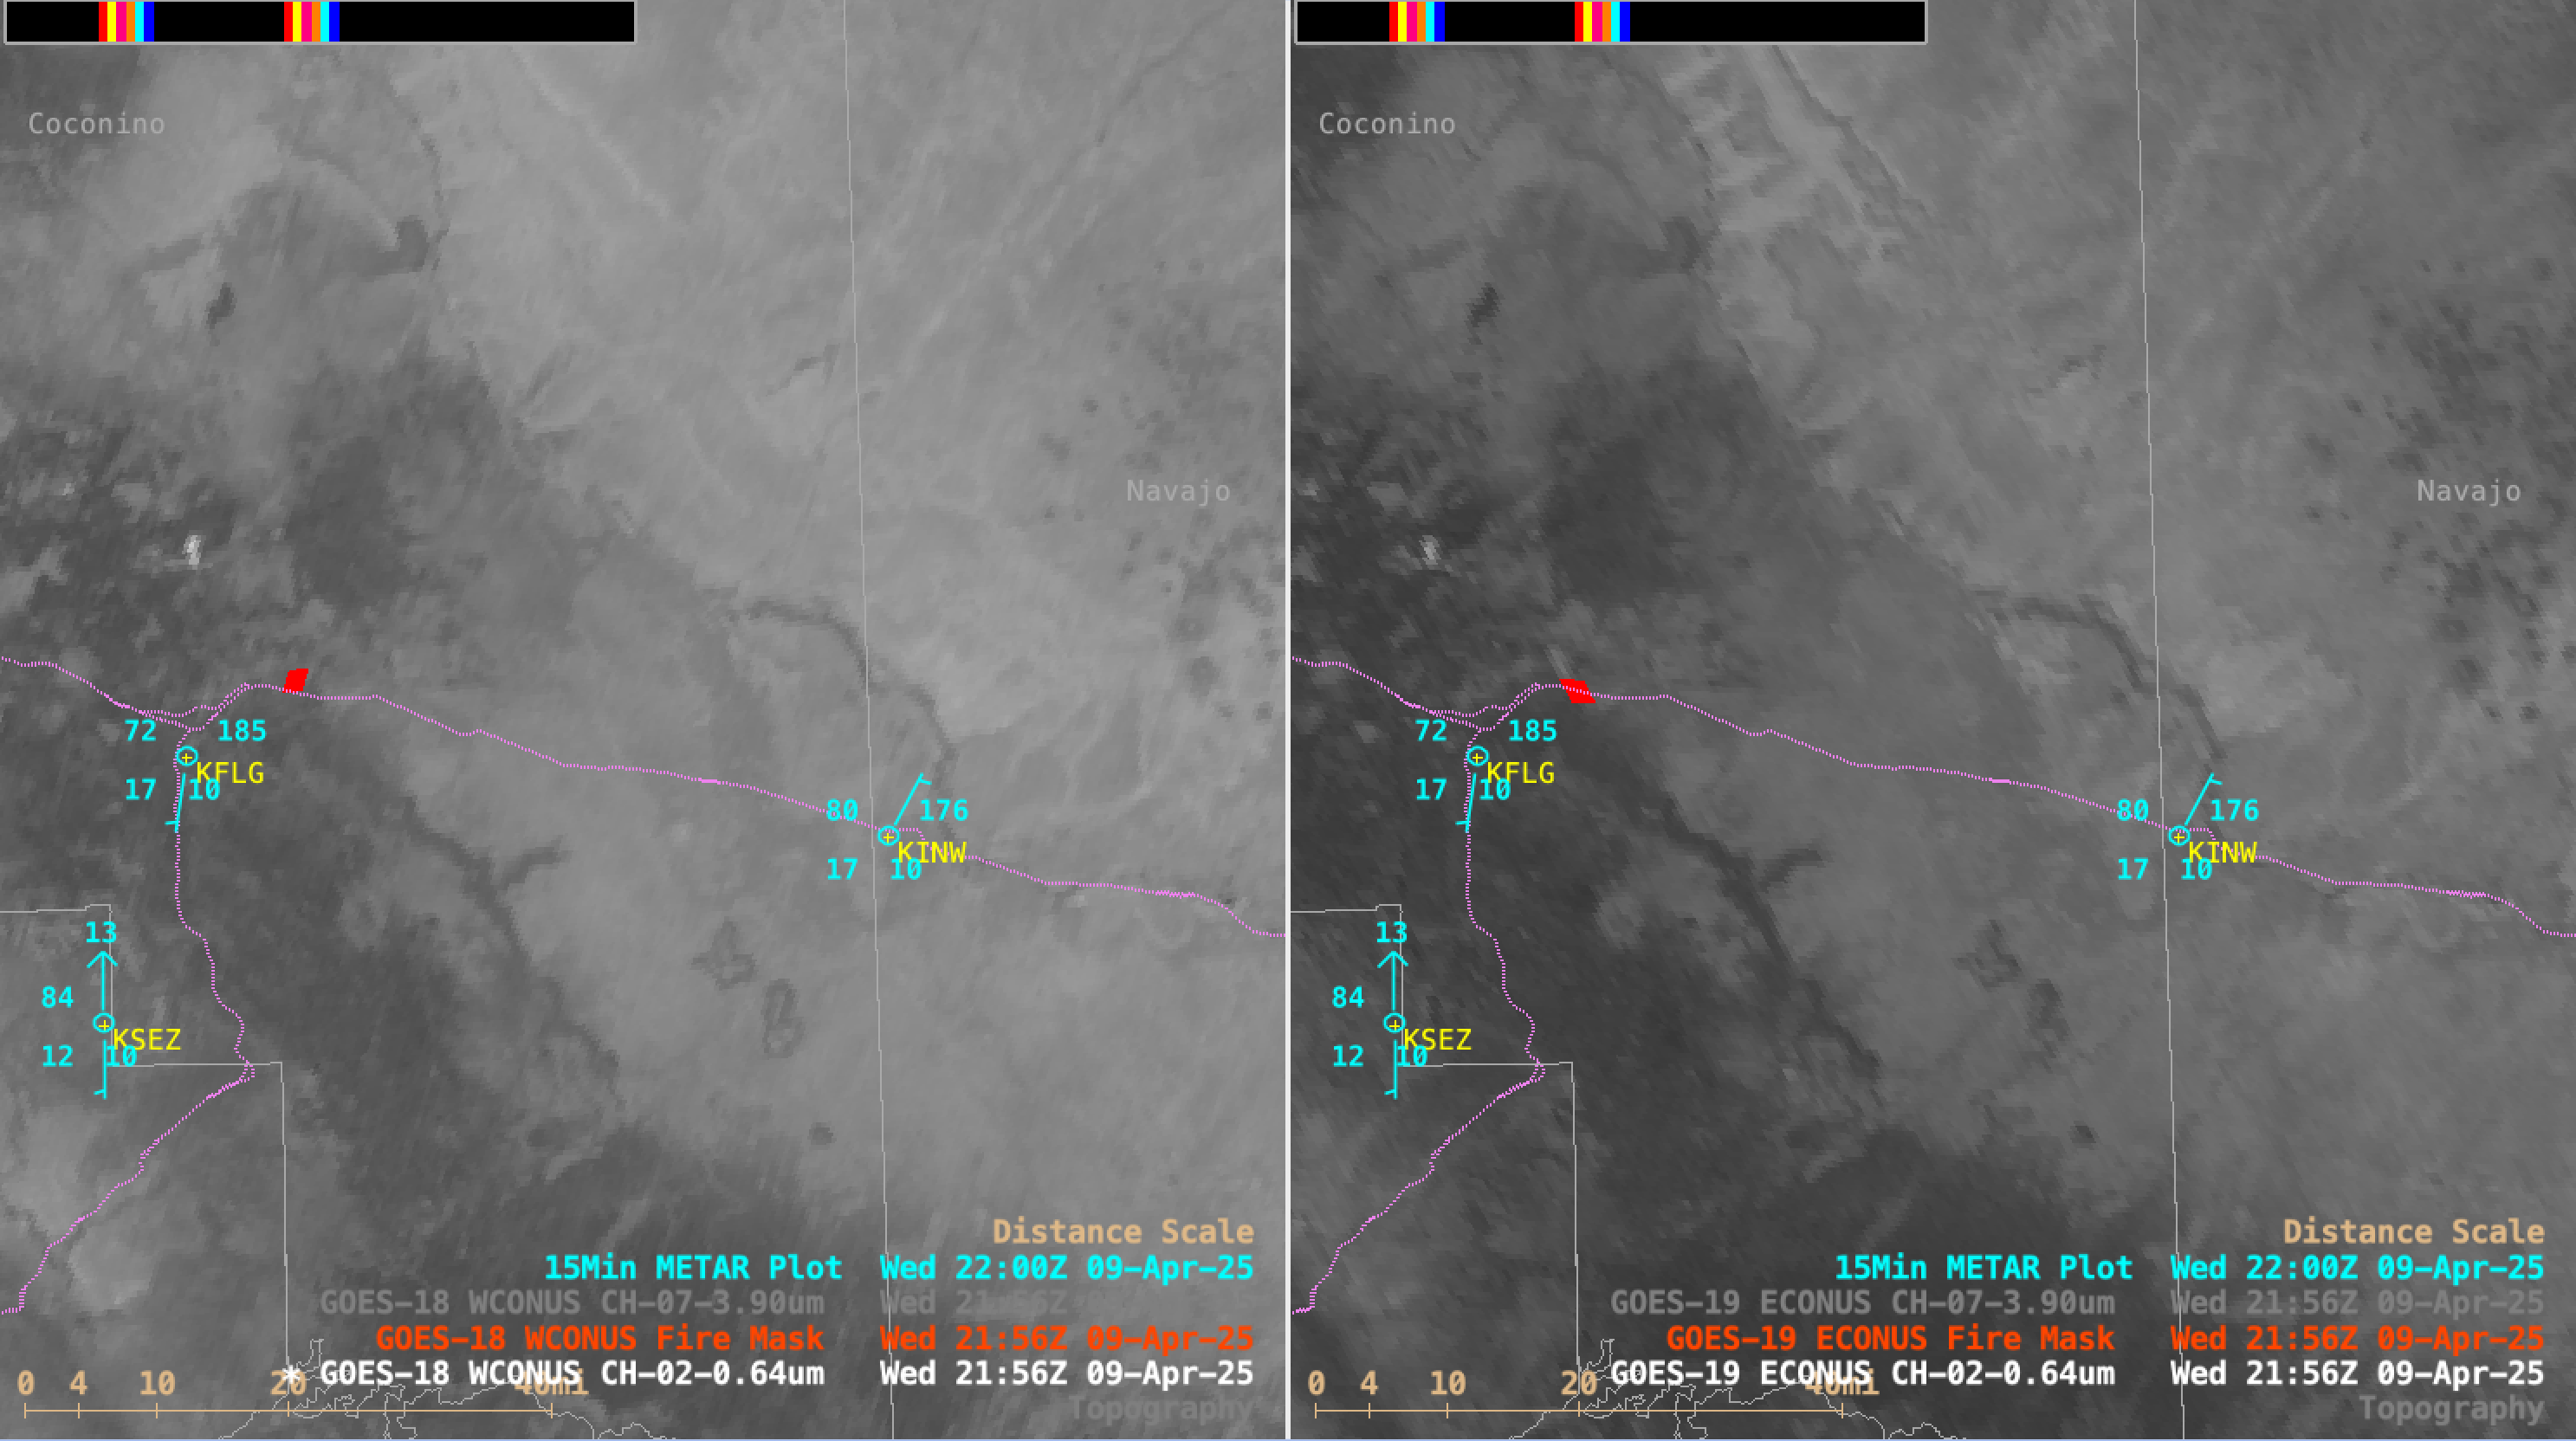
Now taking a look at fire detection using the FDCA Fire Mask from GOES-18/GOES-West and GOES-19/GOES-East (below), the initial detection from GOES-19 was at 1806 UTC (in agreement with the NGFS initial detection) — but the initial detection from GOES-18 was not until 2156 UTC (nearly 4 hours later!). South/southwest winds at Flagstaff (KFLG) occasionally gusted as high as 23 kts, which may have played a role in fire’s longevity and dense smoke production.

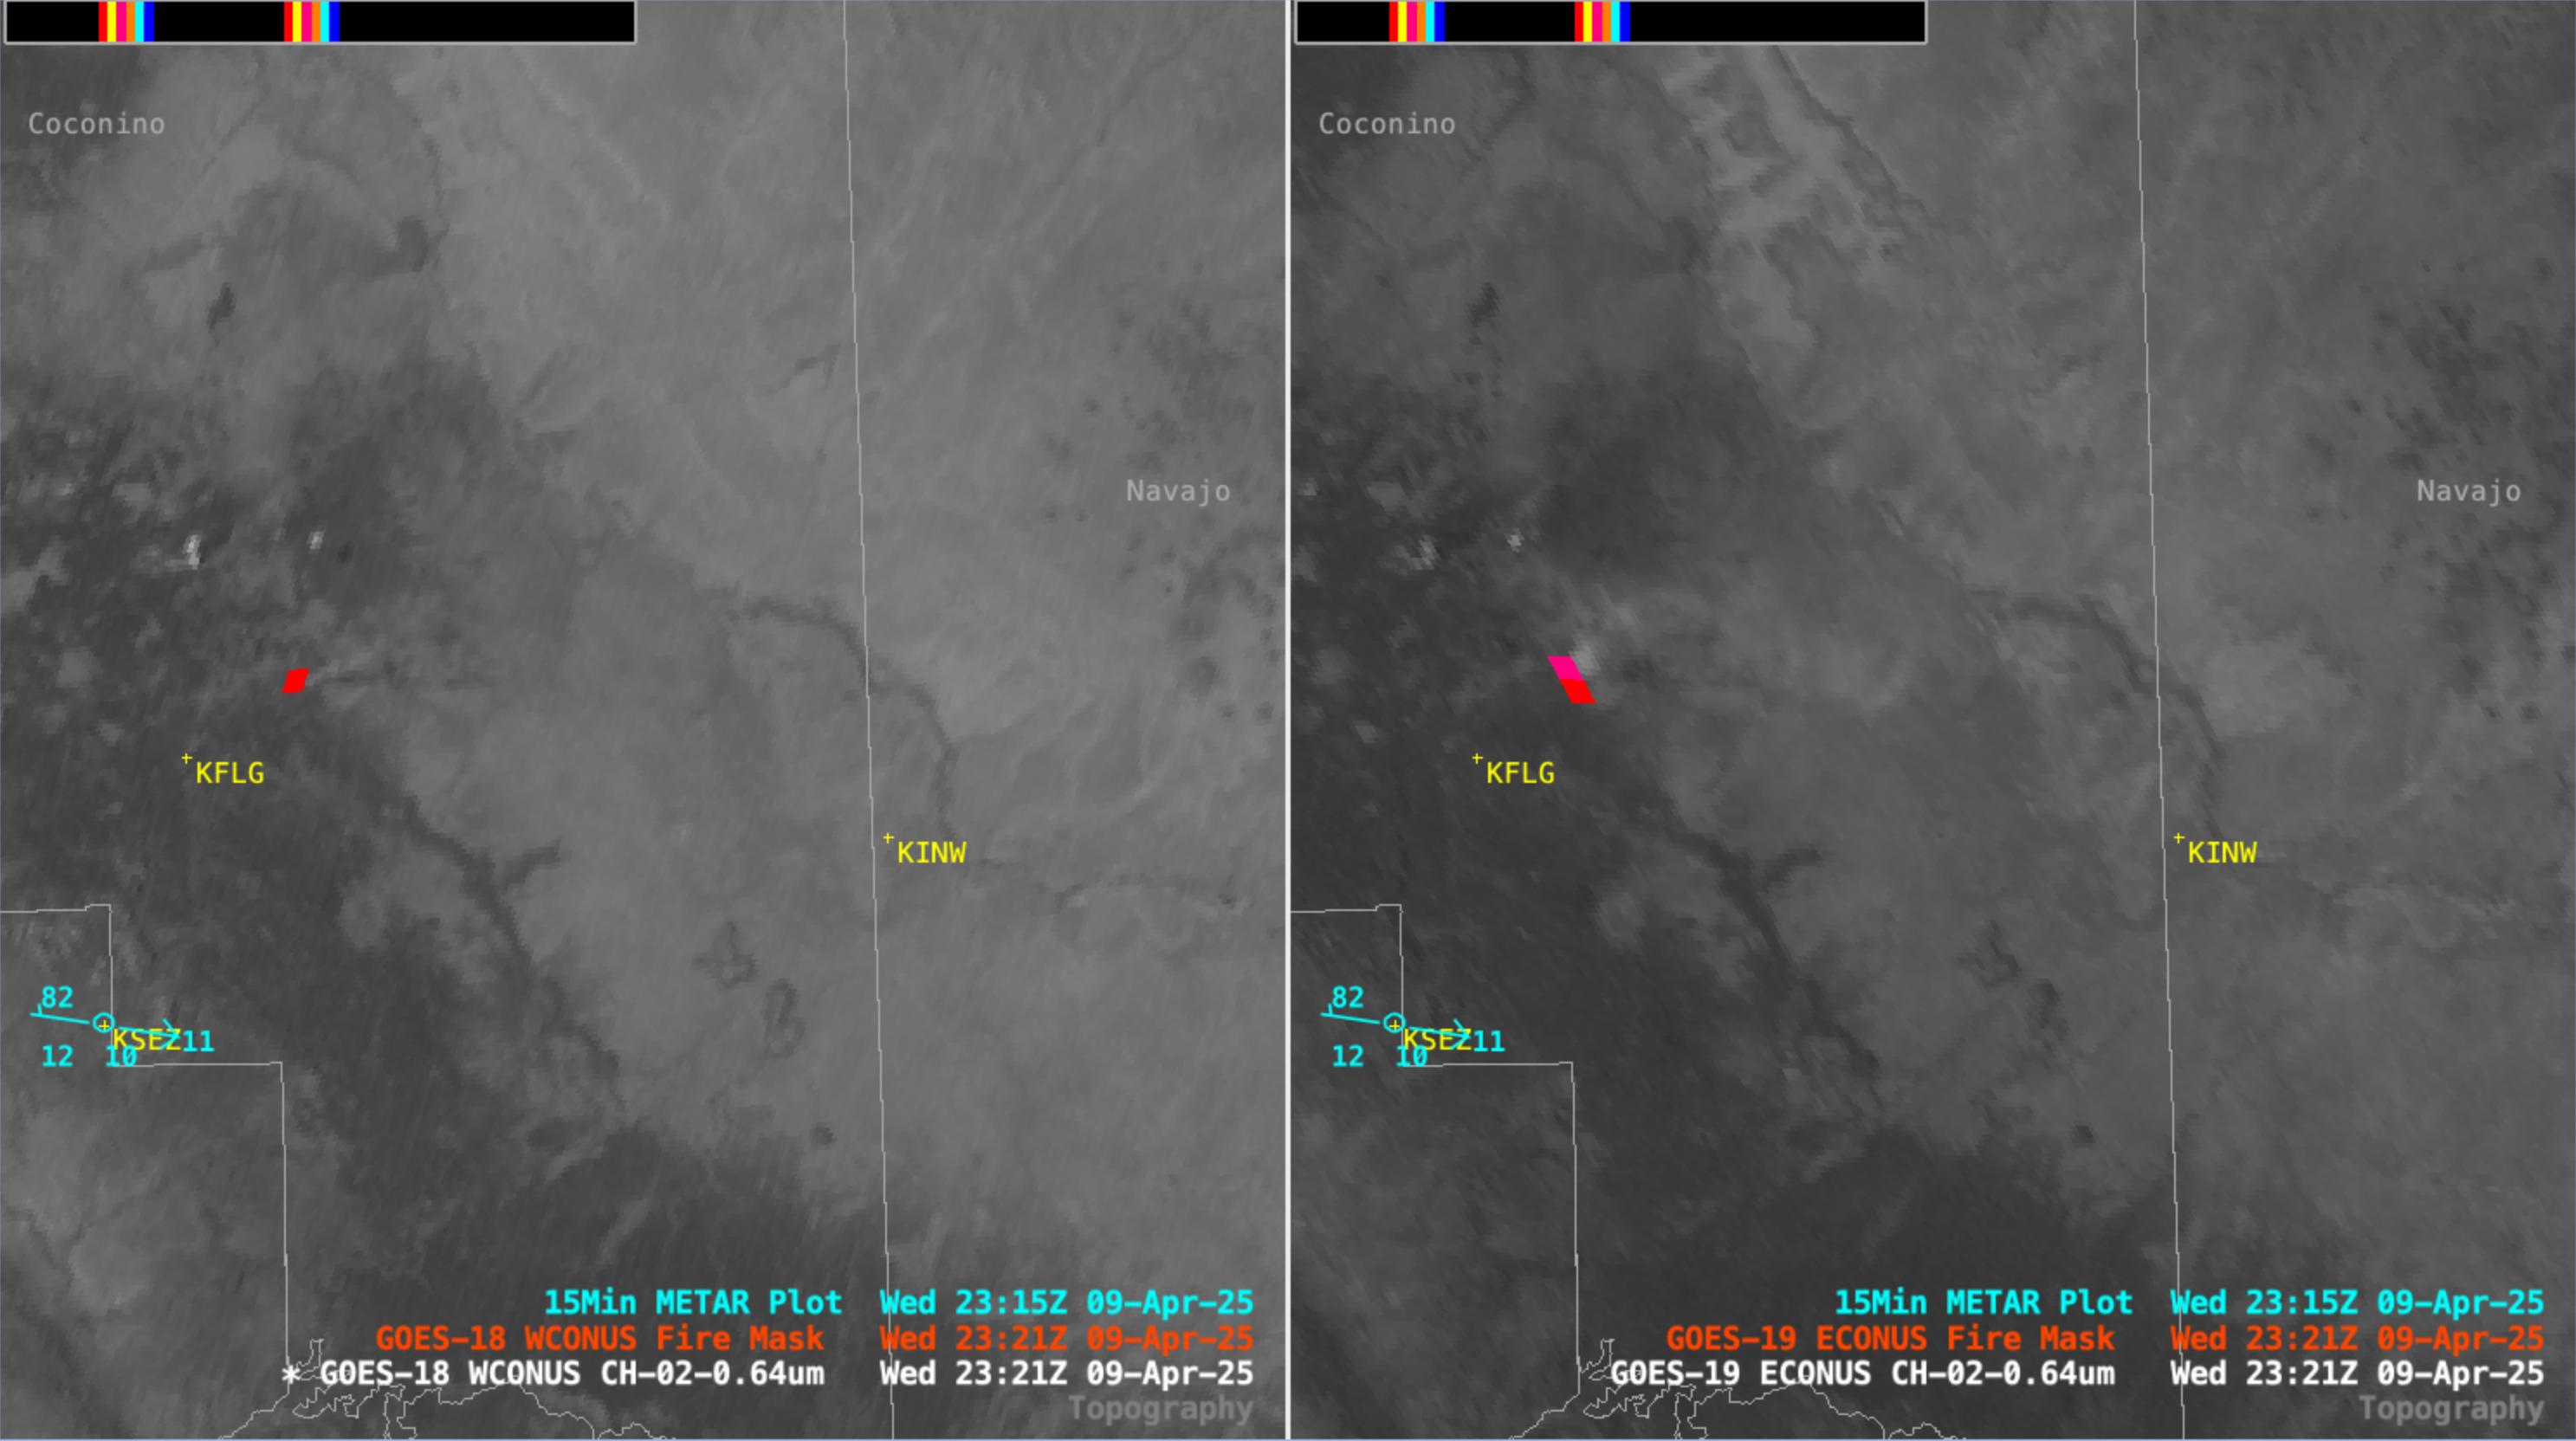
Visible (0.64 µm) images with an overlay of the FDCA Fire Mask derived product from GOES-18 (left) and GOES-19 (right), from 1656 UTC on 09 April to 0031 UTC on 10 April; Interstate highways are plotted in magenta [click to play MP4 animation]

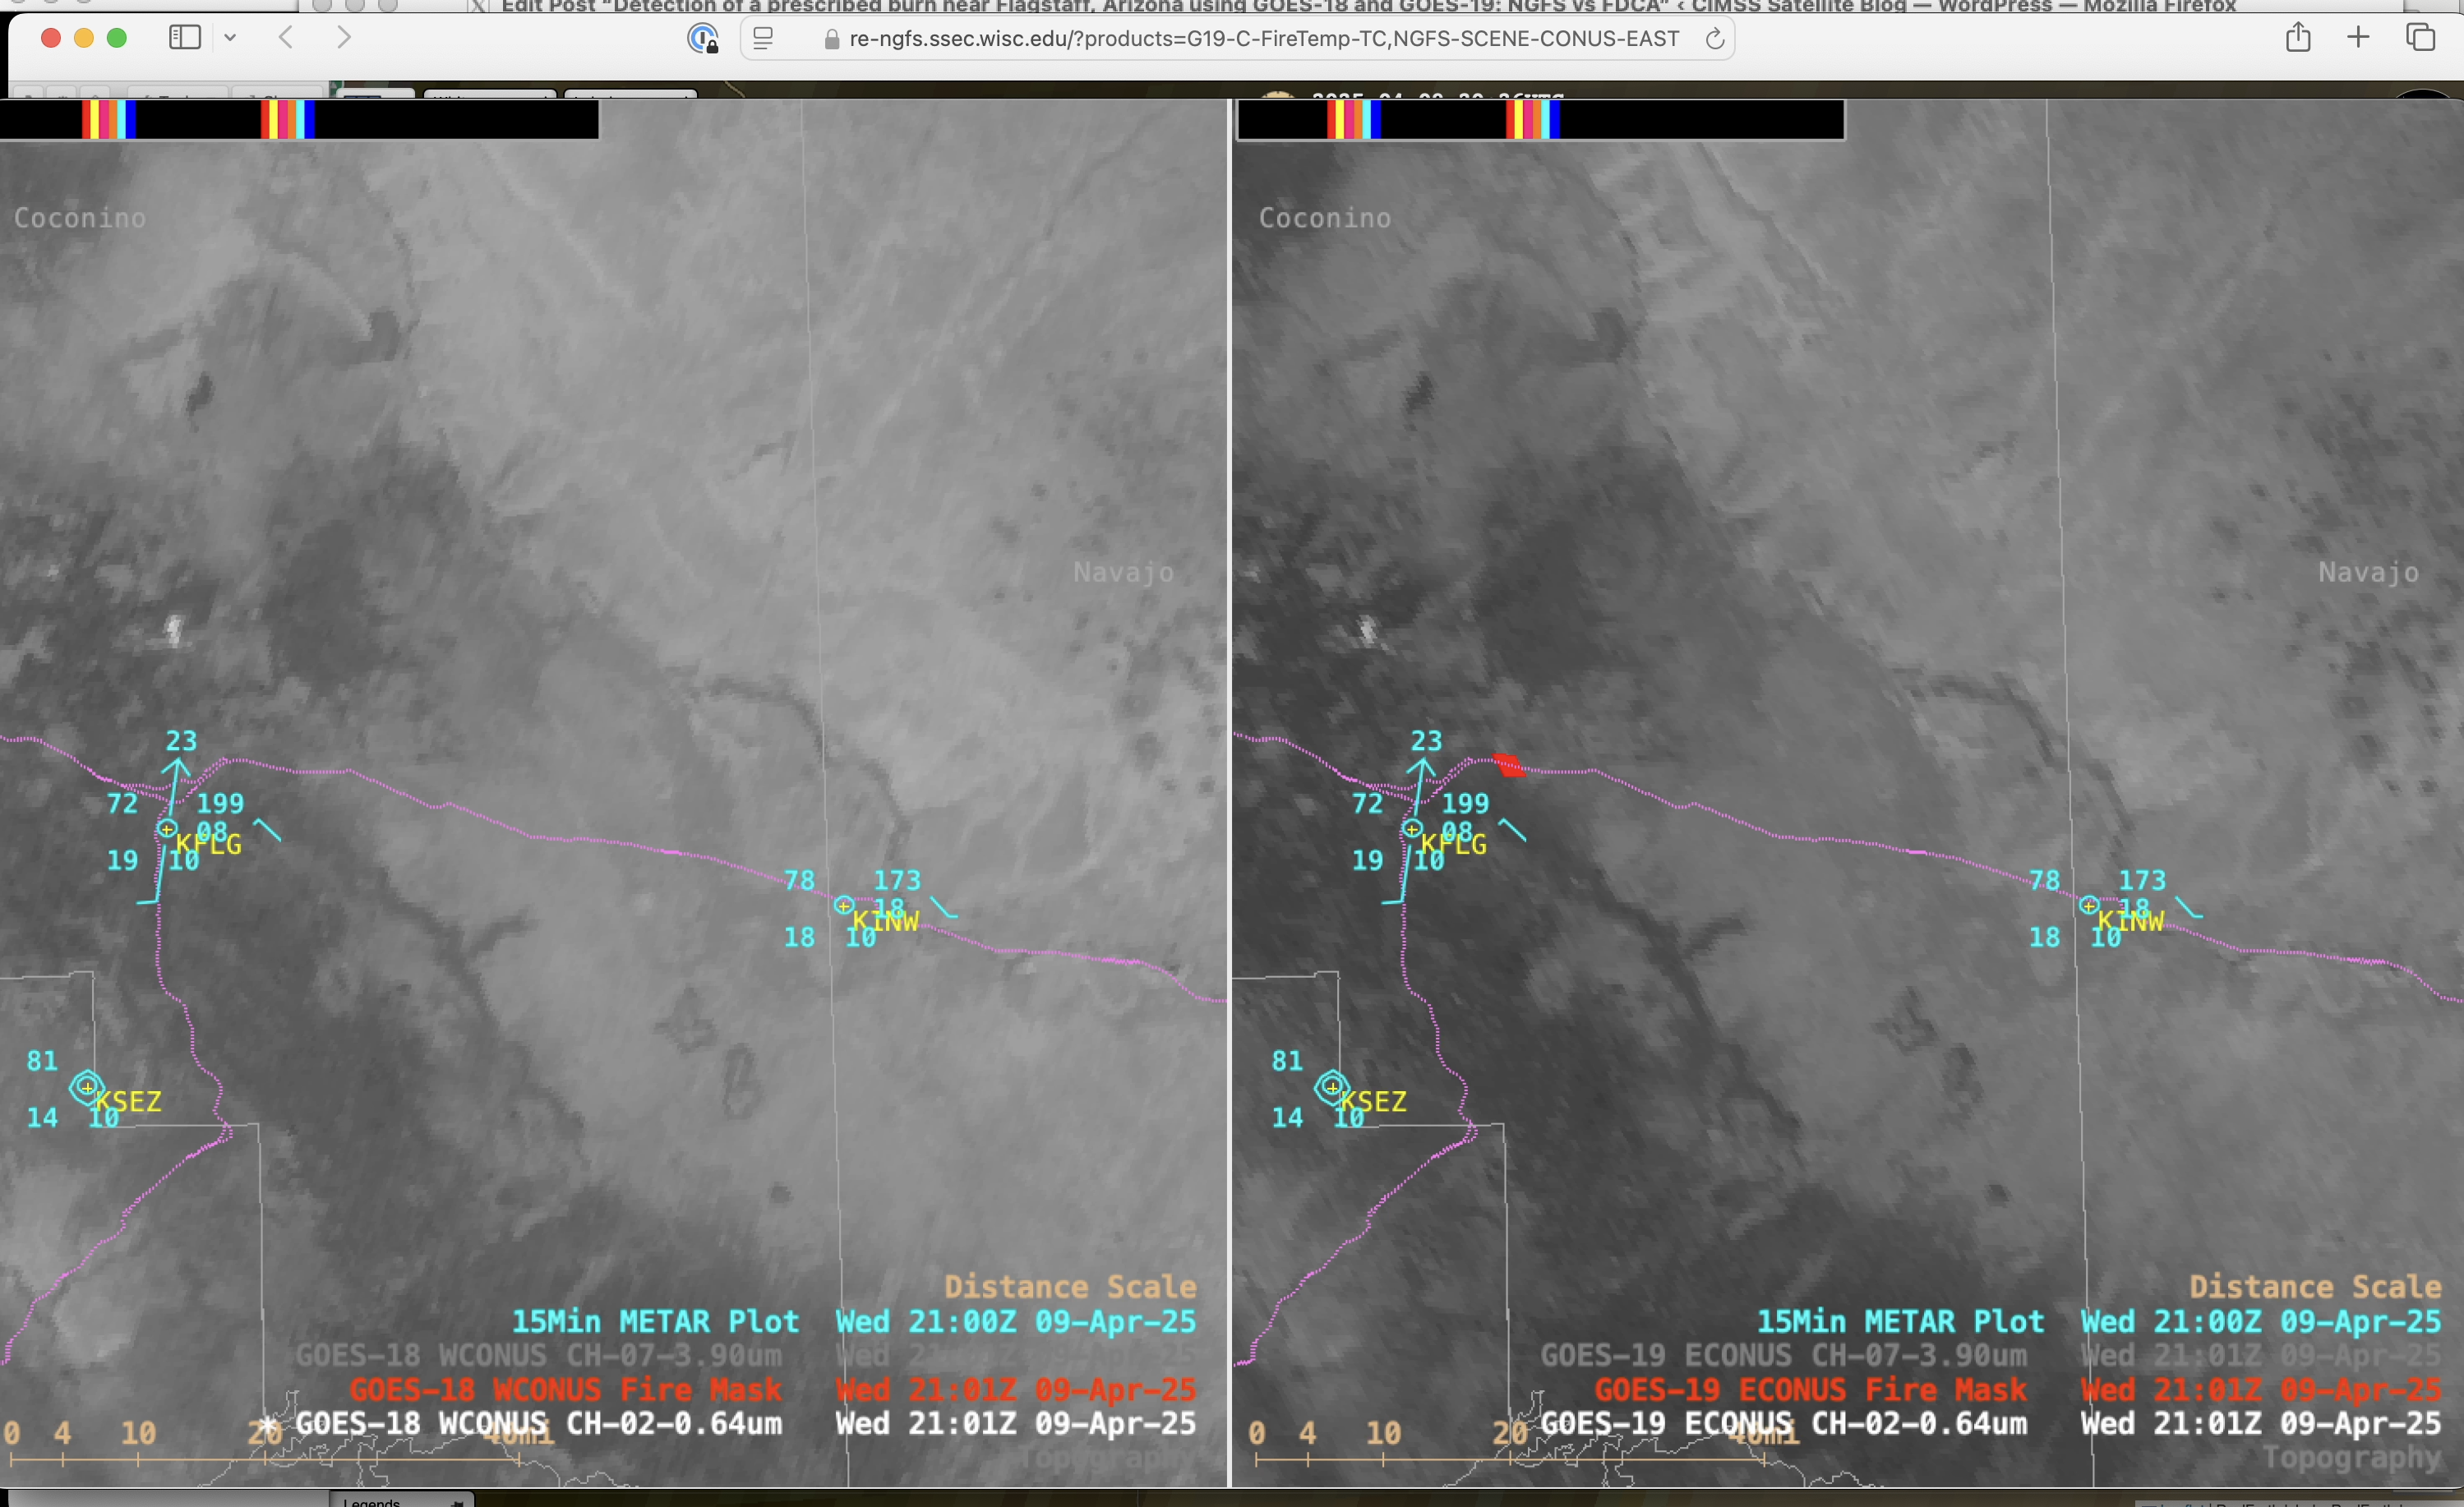
Images of Topography with an overlay of the GOES-18/GOES-19 FDCA Fire Mask (below), showed that there was some higher terrain (darker shades of tan to brown) west of the prescribed burn. Did this terrain play a role in the large discrepancy between GOES-18 and GOES-19 initial detection times? The answer is probably not — and we can’t separate that from where the GOES detector samples actually fall on the fire. What we do know is that the NGFS is more sensitive than the FDCA, which is by design, and we see that demonstrated in this case (with the much earlier GOES-18 NGFS initial detection).

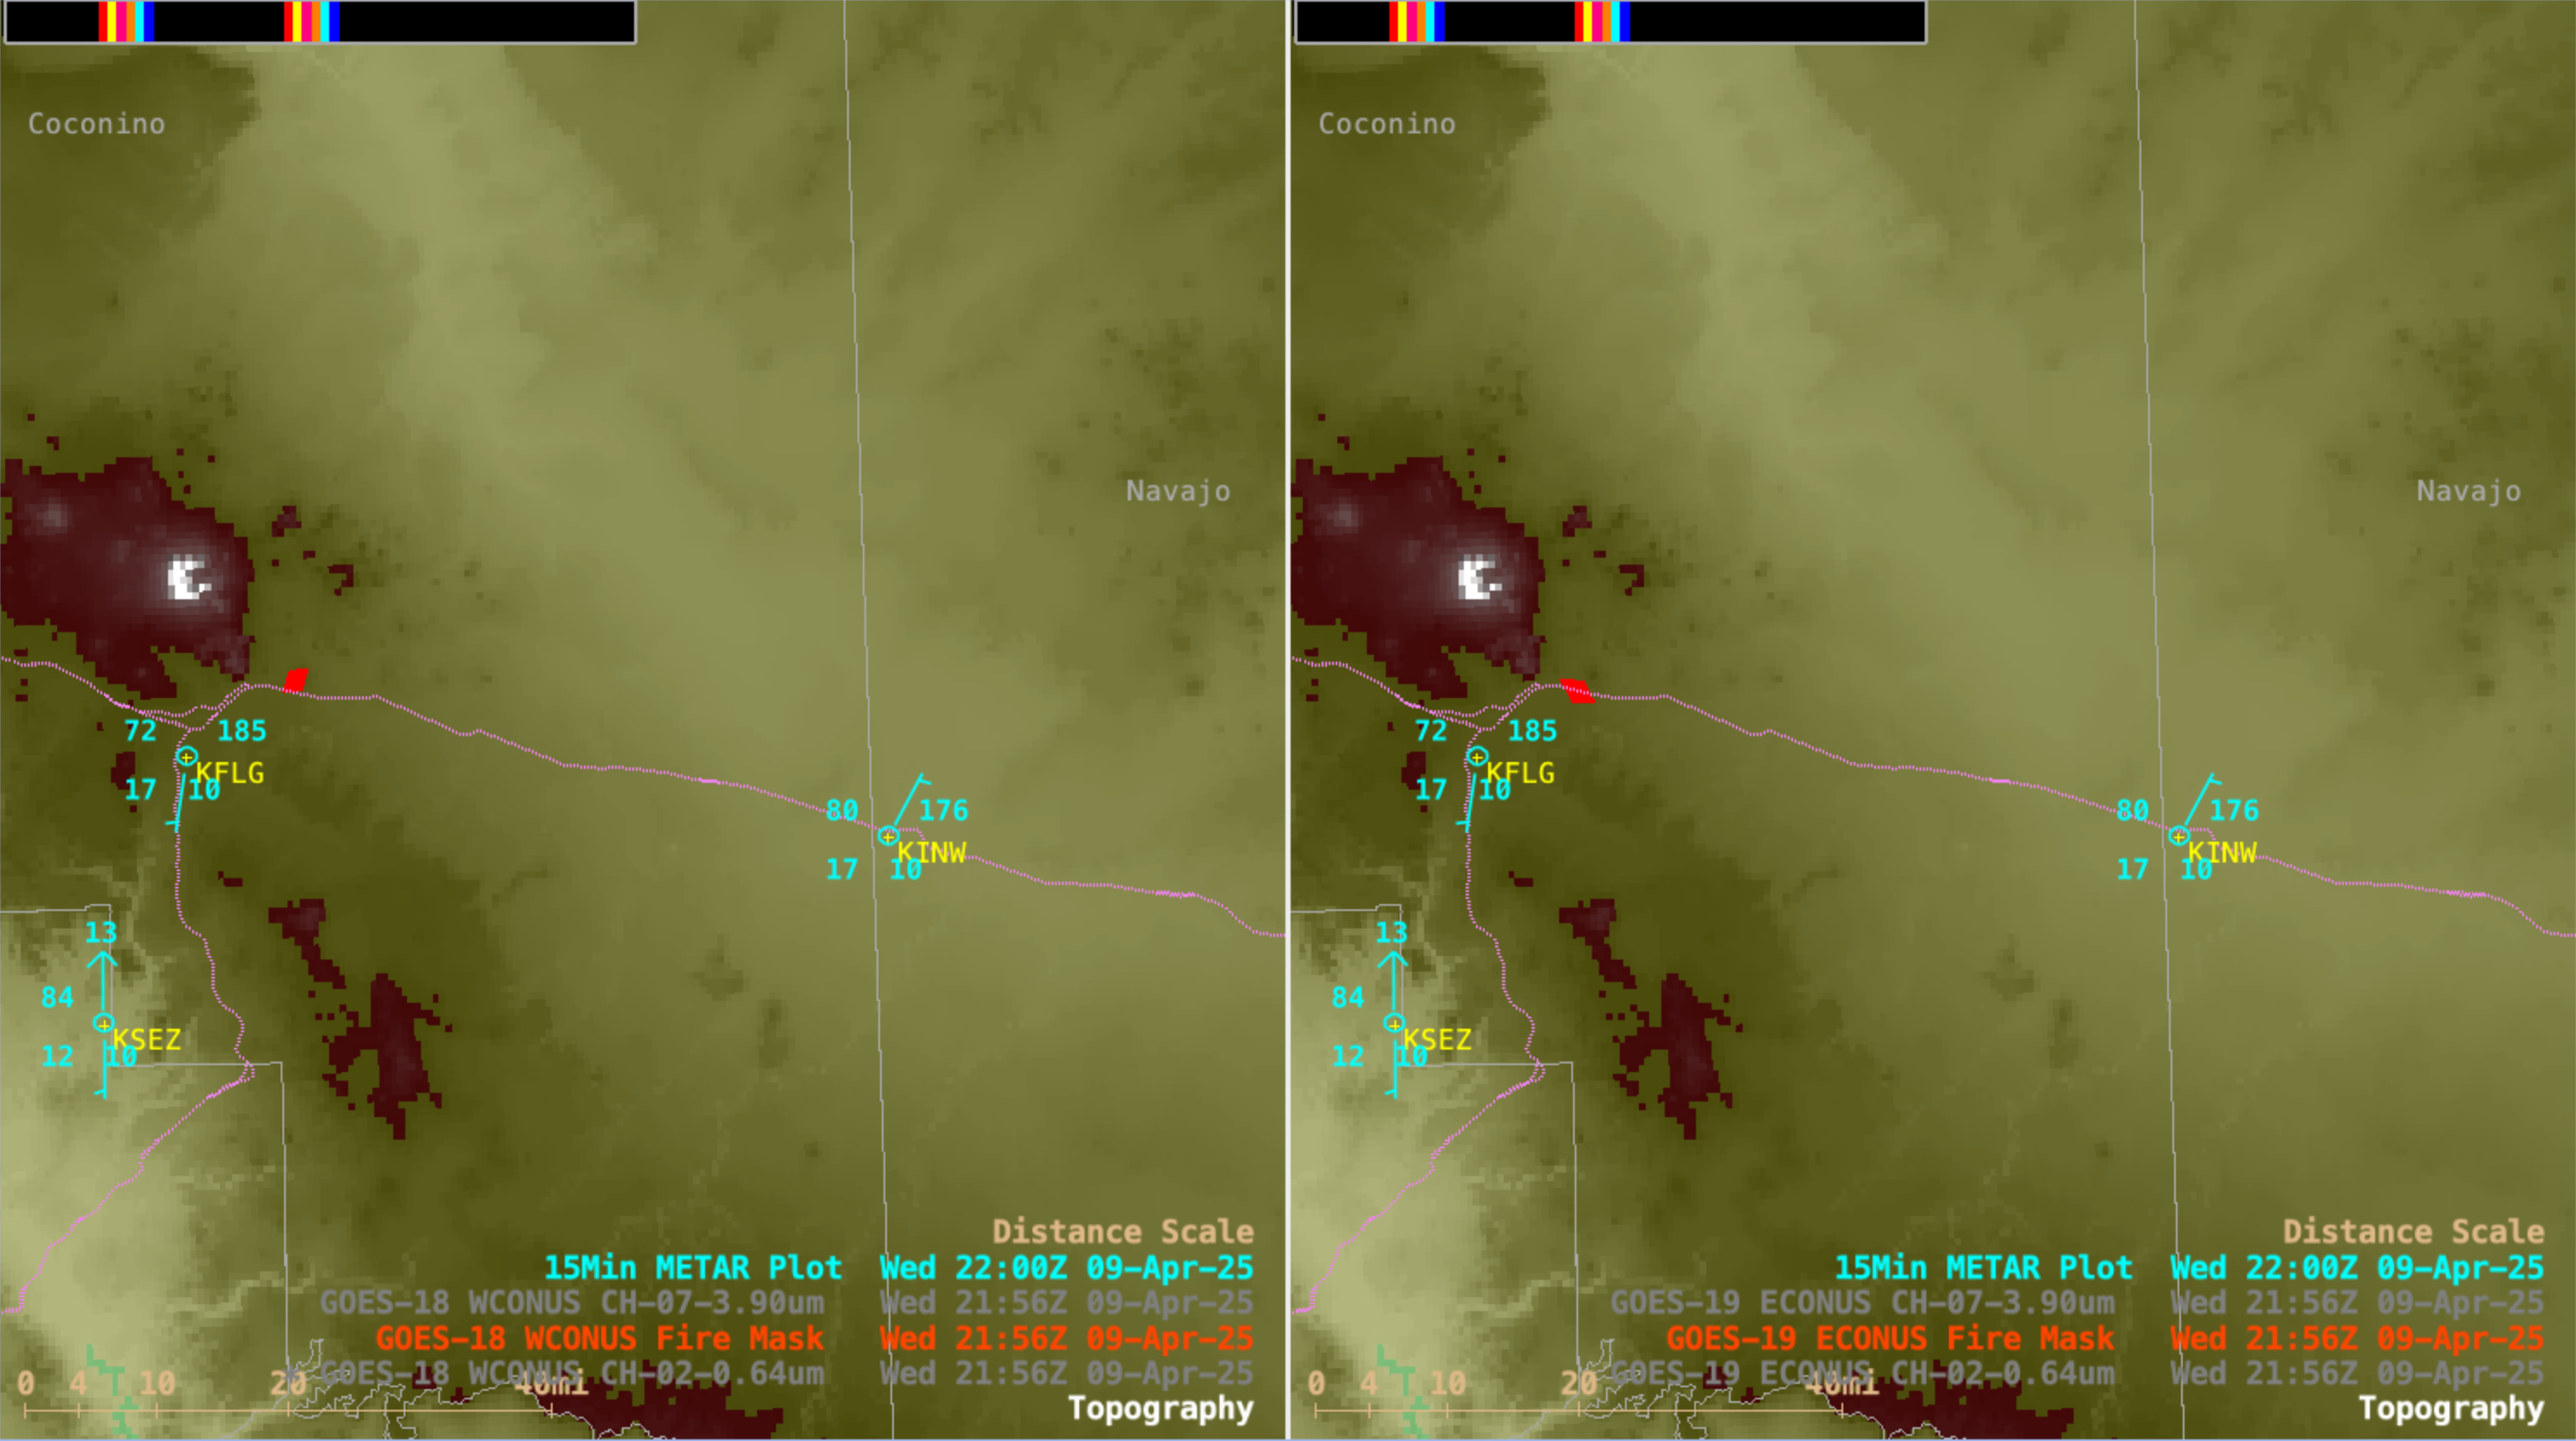
Topography images with an overlay of FDCA Fire Mask pixels at 2156 UTC on 09 April, from GOES-18 (left) and GOES-19 (right); Interstate highways are plotted in magenta [click to enlarge]

Thanks go out to Chris Schmidt (CIMSS) for providing input on aspects of NGFS vs FDCA that applied to this case.

View only this post Read Less

Strong winds into the Gulf of Tehuantepec

Advanced Scatterometry (ASCAT) plots derived from MetopB and MetopC, above, shows a pulse of winds associated with a Gulf of Tehuantepec wind event. Gales are widespread, and winds up to 45 knots are plotted. When Tehuano Gap Winds occur in clear skies (as in this example), the effect on the sea state can... Read More

Advanced Scatterometer (ASCAT) winds from MetopB and MetopC, 0325 and 1505 UTC on 8 April 2025 and 0353 UTC and 1535 UTC on 9 April 2025 (Click to enlarge)

Advanced Scatterometry (ASCAT) plots derived from MetopB and MetopC, above, shows a pulse of winds associated with a Gulf of Tehuantepec wind event. Gales are widespread, and winds up to 45 knots are plotted. When Tehuano Gap Winds occur in clear skies (as in this example), the effect on the sea state can become apparent in visible imagery. On 9/10 April, high clouds masked the view of the ocean as shown in the animation of CSPP Geosphere true color imagery on 9 April 2025, below. You can see, however, the rapid motion of the clouds over the narrow Isthmus of Tehuantepec and the dissipation of those clouds in their descent towards the ocean.

True Color imagery from the CSPP Geosphere site, 1400-2300 UTC on 9 April 2025

The strong winds forced the development of large waves, as shown below in the plot of Significant Wave Heights.

Altimetric Wave Height data, 9 April 2025 (Click to enlarge)

Scatterometry plots and altimetric wave heights are available at this website. These are derived from microwave observations that are not affected by the widespread clouds.

View only this post Read Less

Standing wave south of the Aleutian Islands

GOES-18 True Color imagery during the day on 7 April, above, shows the development of a standing wave downwind of the elevated topography on the Aleutian peninsula between King Salmon and Perryville. (Note also the faint signal of volcanic ash as discussed here) What atmospheric conditions support the development of... Read More

True Color imagery from GOES-18, 1700 UTC 7 April – 0400 UTC 8 April 2025

GOES-18 True Color imagery during the day on 7 April, above, shows the development of a standing wave downwind of the elevated topography on the Aleutian peninsula between King Salmon and Perryville. (Note also the faint signal of volcanic ash as discussed here) What atmospheric conditions support the development of these clouds? Soundings from King Salmon AK at 1200 UTC/7 April and 0000 UTC/8 April, below, taken from the University of Wyoming Sounding site, show very strong northerly winds at low-levels and near dry-adiabatic conditions at 1200 UTC. At 0000 UTC, the low-level winds are relaxing but the steep low-level lapse rate persists. By 0000 UTC, Aleutians are starting to be affected by a system dropping down from the north as evidenced by changes in the cloudiness in the animation shown above. The inversion is between 850 and 900 mb, around 1000 m above Sea Level. Only a few peaks in this area of the Aleutians reach above 1 km (link).

King Salmon Alaska soundings, 1200 UTC on 7 April (left) and 0000 UTC on 8 April (right) (Click to enlarge)

Day Cloud Phase Distinction imagery during the day on 7 April, below, suggests that the standing wave cloud is glaciated.

GOES-18 Day Cloud Phase Distinction RGB, 1700 UTC 7 April – 0400 UTC 8 April 2025 (Click to enlarge)

Mid-level Water Vapor infrared imagery (6.95 µm), below, also shows the development of the standing waves. Surface observations show very strong northerly winds off the Bering Sea.

GOES-18 Mid-Level water vapor (band 9, 6.95 µm) infrared imagery along with surface observations, 1340 UTC 7 April 2025 – 0610 UTC 8 April 2025 (Click to enlarge)

The toggle below between VIIRS and GOES-18 ABI visible (0.64 µm) imagery highlights the importance of VIIRS data at high latitudes. There is a significant parallax shift in the GOES-18 imagery such that the standing wave is shown to be over the mountains, rather than displaced to the south as in the VIIRS imagery (and, likely, in reality). VIIRS data also allows the use to see the shadow of the higher clouds on the terrain below; the oblique view from GOES-18 misses that feature.

VIIRS I01 and GOES-18 Band 2 visible (0.64 µm) imagery, 2300 UTC on 7 April 2025 (Click to enlarge)

The animation below compares zoomed-in VIIRS imagery from Visible (I01, 0.64 µm), shortwave infrared (I04, 3.87 µm) and longwave infrared (I05, 11.45 µm) channels. Solar reflectance of 3.74 µm energy means the clouds and surface are warm — but note how the shadow of the clouds — where little solar reflection occurs — are relatively cold!

VIIRS imagery from Suomi NPP; I01 (0.64 µm), I04 (3.74 µm) and I05 (11.45 µm) at 2301 UTC on 7 April 2025 (Click to enlarge)

VIIRS data can be used to create Day Cloud Phase Distinction RGBs, as shown in the animation below (courtesy Carl Dierking, GINA), and the multiple JPSS Satellites (Suomi NPP, NOAA-20 and NOAA-21) means excellent temporal resolution.

VIIRS Day Cloud Phase Distinction RGB, 2120 UTC 7 April – 0016 UTC 8 April 2025 (Click to enlarge); animation courtesy Carl Dierking, GINA

JPSS Satellites carry infrared and microwave sounders, and data from those sounders are used to create vertical profiles of moisture and temperature, i.e., NUCAPS soundings. The animation below shows three soundings near the standing wave. There is a strong inversion upstream of the standing wave cloud, and the inversion is not so pronounced downstream of the cloud. The boundary layer in all three soundings is dry adiabatic.

NUCAPS profiles at 3 separate locations (indicated by the blue boxes), ca. 2300 UTC on 7 April 2025 (click to enlarge)

My thanks to Aaron Jacobs, WFO Juneau and Carl Dierking, GINA, for alerting me to this interesting case, and supplying imagery and suggestions. Aaron also forwarded along the following screen captures of FAA Webcams at Chignik Bay and Perryville shown below.

Webcam imagery, Chignik Bay, looking southeast, 1735 – 2208 UTC on 7 April 2025 (Click to enlarge)
Webcam imagery, Perryville AK, looking east, ca. 1500-2300 UTC on 7 April 2025 (Click to enlarge)
Webcam imagery, Perryville, AK, looking northwest, 1600-2200 UTC on 7 April 2025 (Click to enlarge)

View only this post Read Less

Flooding along the Ohio River

Heavy rains during the first week of April have led to significant flooding along the Ohio (and other) Rivers. The slider above compares True-Color imagery from CSPP Geosphere on 24 March — long before the rains — and on the morning of 7 April 2025 — during the floods. The expansion of... Read More

Heavy rains during the first week of April have led to significant flooding along the Ohio (and other) Rivers. The slider above compares True-Color imagery from CSPP Geosphere on 24 March — long before the rains — and on the morning of 7 April 2025 — during the floods. The expansion of the Ohio River, a sinuous brown in the image, is apparent, as is the general greening up of the background as Spring progresses. (Click here for an annotated image from 7 April that includes local geography, and here for the same annotation from 24 March).

Cloud cover after a rain event can make flood detection from satellites a challenge. SAR data can be used to detect floods underneath clouds (or at night) and imagery is available at this RealEarth-powered website. RadarSat imagery from late on 6 April 2025, below, shows the extent of the flooding over southern Illinois and southwestern Indiana. Regions where SAR data suggests flooding is occurring are shown in red.

Radarsat-2 estimates of flooding, 2340 UTC on 6 April 2025 (Click to enlarge)

Clear Skies over the Ohio River valley on 8 April allowed for excellent coverage from a multitude of satellites that can assess the horizontal extent of flooding. For example, False-color imagery from Sentinel-2 (at this link), toggled below with a ‘before’ image from 22 March 2025, shows the obvious increase in flood waters.

Sentinel-2A False Color imagery on 22 March 2025 and 8 April 2025 over the lower Ohio River Valley (Click to enlarge)

Sentinel-2A horizontal coverage doesn’t cover the entire flooded region — but clear skies on 8 April allowed the VIIRS flood product to create information over the Ohio River Valley and mid-Mississippi River Valley, as shown in the image below (taken from this website).

1-Day VIIRS Composite of the Flood Product, 08 April 2025 (Click to enlarge)

Added, 11 April 2025, below: The CIMSS Flood Product (1-day VIIRS Composites, source) during the 4 mostly clear days from 7-10 April 2025 is shown below. Memphis is at the southern edge of the image, where the Mississippi takes a long and lazy southerly to westerly curve. Some of the flooded tributaries of the Mississippi in western Tennessee show decreasing flood waters over these 4 days.

VIIRS 1-day Flood Composite imagery, 7-10 April 2025 (Click to enlarge)

View only this post Read Less