
GOES-12 water vapor images + surface pressure and frontal analysis
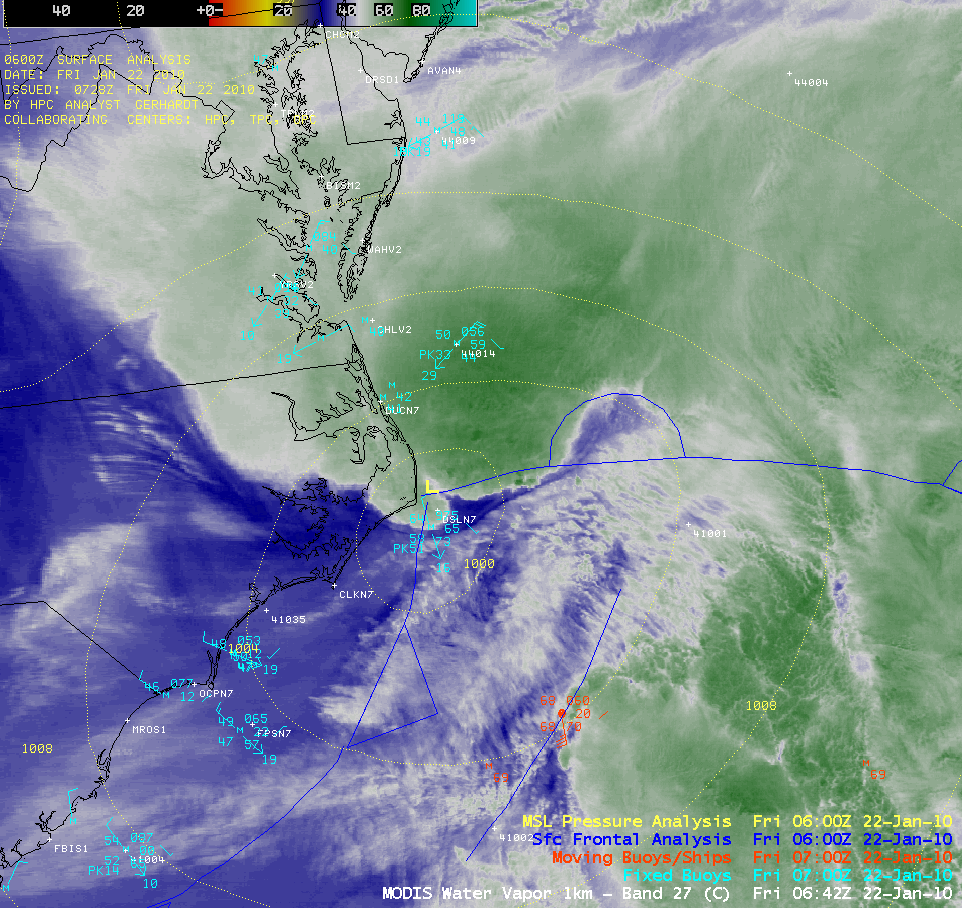
A cyclone off the mid-Atlantic coast was quickly transitioning to the occluded stage on the morning of 22 January 2010 (above). As the cyclone (in its mature stage) was just beginning to move out over the offshore waters of the Atlantic Ocean, winds gusted to 51 knots at buoy 41025 (Diamond Shoals NC) around 07 UTC and 37 knots at buoy 44014 (64 miles east of Virginia Beach VA) around 11 UTC.
The evolution of a classic “dry swirl” signature was seen on AWIPS images of the 4-km resolution GOES-12 6.5 µm water vapor channel (below) — this dry swirl water vapor signature is a tell-tale sign that a cyclone has reached occlusion (and is often seen with systems over the open oceans).

GOES-12 6.5 µm water vapor images
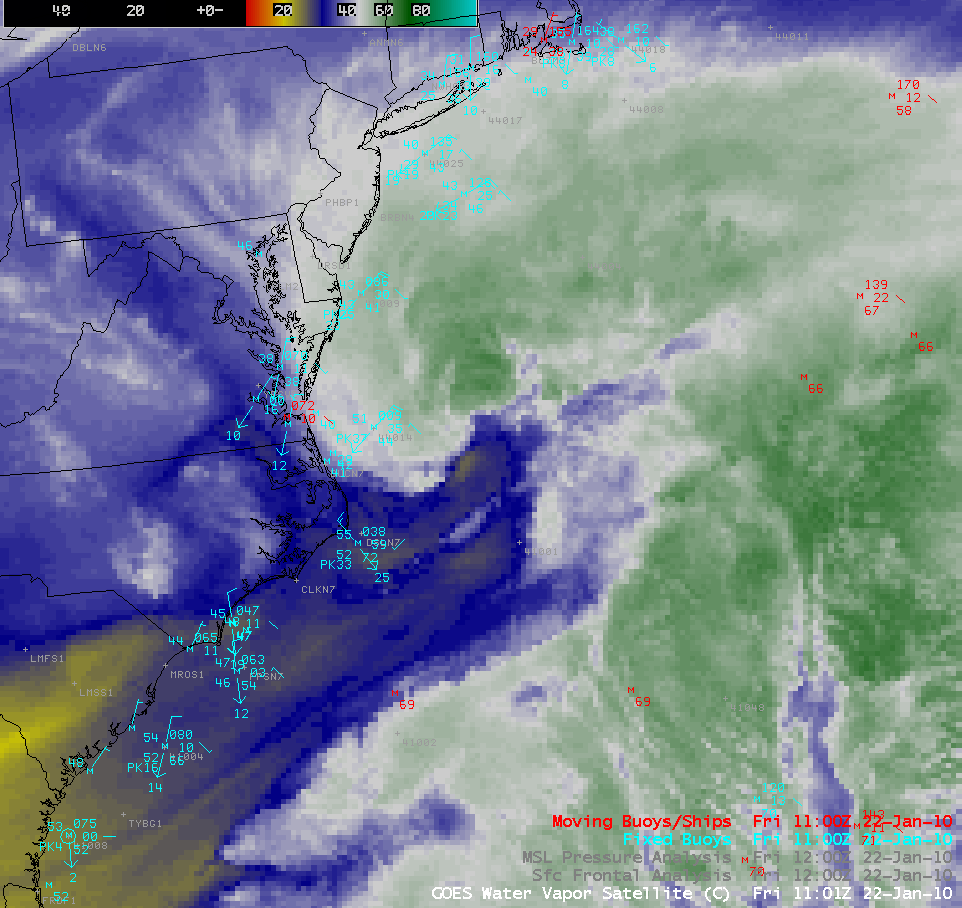
The appearance of an subtle elongated filament structure on the water vapor imagery (exiting the Georgia / South Carolina coast after about 10 UTC, to the southwest of the occluding cyclone) suggested the presence of a northeastward-propagating jet streak. A plot of 1-hourly MADIS satellite-derived water vapor atmospheric motion vectors (below) revealed one target with a velocity of 151 knots in the general vicinity of the thin filament signature — this wind speed was significantly higher than the 100-110 knots that was initialized by the GFS40 model over that particular area.

GOES-12 water vapor image + satellite winds + GFS 250 hPa isotachs
McIDAS images of the 1-km resolution GOES-12 visible channel data (below) showed finer details in the low-level cloud structure, as well as the formation of convective bursts near the circulation center toward the end of the animation.

GOES-12 visible images + buoy and ship wind reports
A comparison of 1-km resolution NOAA-17 AVHRR visible channel and 10.8 µm IR channel images at 14:10 UTC (below) showed the cloud structures around the time that the dry swirl signature was becoming more well-defined on the GOES-12 water vapor imagery.

NOAA-17 AVHRR visible and 10.8 µm IR images
The AVHRR Cloud Top Temperature (CTT) product (below) indicated that CTT values were as cold as -70º C (black color enhancement) prior to the cyclone transitioning to the occluded stage.

AVHRR Cloud Top Temperature product
View only this post Read Less


 false color image")


")


