
MODIS 0.65 µm visible channel images
AWIPS images of the 1-km resolution MODIS 0.65 µm visible channel data (above) showed a hint of a few aircraft contrails over the Southwestern US at 18:03 and 21:22 UTC on 16 March 2010. However, note that many more contrails were apparent on the corresponding MODIS 1.4 µm near-IR “cirrus detection channel” images (below). The ABI instrument on the upcoming GOES-R satellite will contain near-IR channels similar to this MODIS near-IR channel that will enable more accurate cirrus cloud and contrail detection.

MODIS 1.4 µm near-IR "cirrus detection channel" images
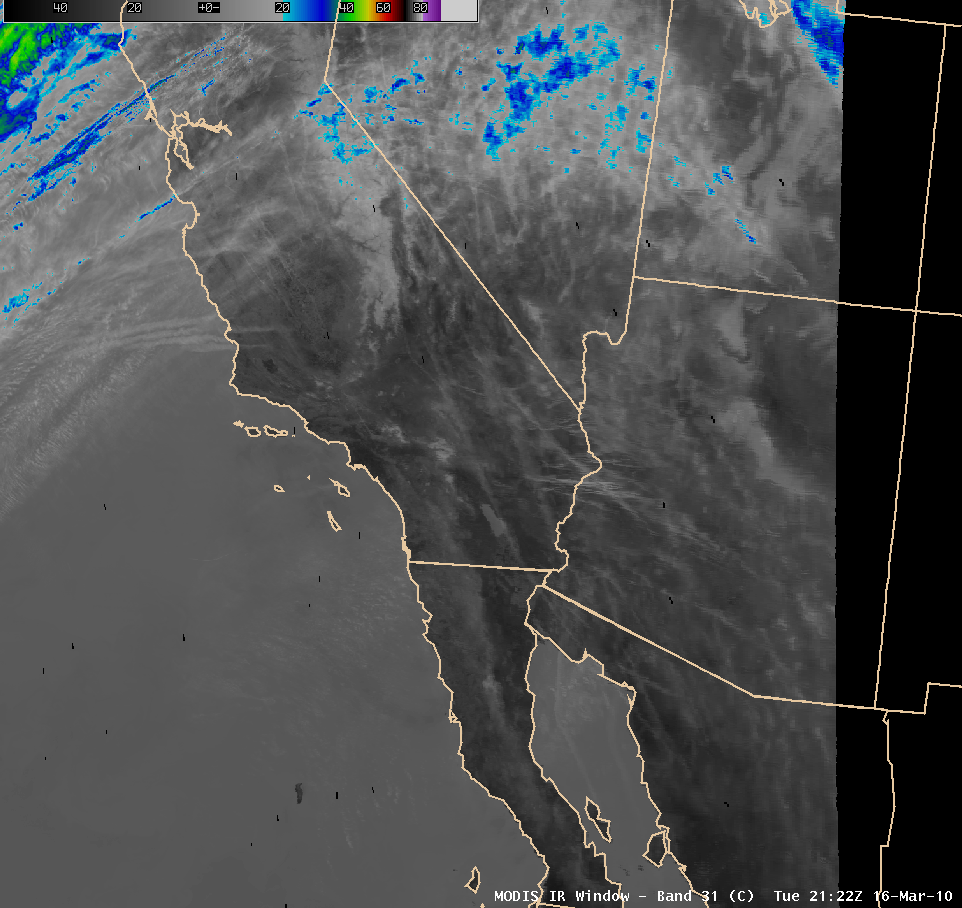
While none of these contrails appeared to be very cold on 1-km resolution MODIS 11.0 µm IR imagery (none were even near the -20º C IR brightness temperature threshold), the 1-km resolution AVHRR Cloud Top Temperature (CTT) product at 20:36 UTC (below) indicated that portions of a few of the contrails were exhibiting CTT values as cold as -30 to -40º C (darker blue color enhancement) — however, no single contrail appeared to be cold enough to have completely glaciated along it’s entire length.

AVHRR Cloud Top Temperature product
The 1-km resolution AVHRR Cloud Type Product (below) also indicated that the majority of these contrails were composed of supercooled water droplets (cyan color enhancement), although some portions of a few of the contrails were glaciating and being flagged as cirrus (orange color enhancement).

AVHRR Cloud Type Product
The 1-km resolution AVHRR Cloud Top Height (CTH) product (below) showed that segments of the highest contrails had CTH values around 9 km (blue color enhancement).

AVHRR Cloud Top Height product
View only this post Read Less


