Early morning visible imagery shows a region of modest convection developing into an arc in the Gulf of Mexico south of Louisiana. Radar imagery at 11 UTC shows a concentrated region of strong convection in the marine environment. Which satellite data can be used to identify the regions most at risk for convection in... Read More

Early morning visible imagery shows a region of modest convection developing into an arc in the Gulf of Mexico south of Louisiana. Radar imagery at 11 UTC shows a concentrated region of strong convection in the marine environment. Which satellite data can be used to identify the regions most at risk for convection in a dry environment?

Total Precipitable Water (TPW) plots (above) derived from satellite microwave data (from SSM/I on DMSP-13 and -14 and from AMSR-E on Aqua) show that the region of convective development was deep within the dry air behind a storm system moving off the southeast coast of the United States. TPWs south of Louisiana are in the 8-16 mm range. Similarly, water vapor imagery from the GOES-12 imager (below) shows predominantly dry air in the region of convective development — until the convection is actually developing. However, no precursor impulses are apparent. Unfortunately, the key development occurs during the eclipse period in the GOES-12 imagery.

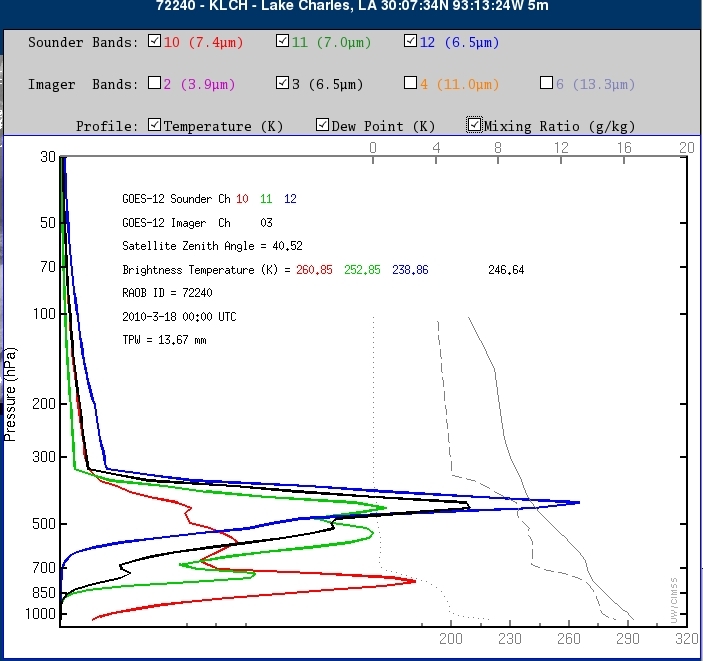
Imager water vapor data includes only one channel, sensing radiation with a wavelength around 6.5 micrometers. The GOES Sounder, however, has 3 water vapor channels sensing radiation with wavelengths at 6.5, 7.0 and 7.4 micrometers (The ABI on GOES-R will also have 3 channels that detect water vapor: 6.2, 6.95 and 7.34 micrometers). The weighting functions from Lake Charles, Louisiana for 00 UTC on 18 March 2010, used in the retrieval show that only the 7.4 micrometer data should detect any significant moisture because only the curve for 7.4 micrometer shows a response function that overlaps with appreciable moisture low in the atmosphere (compare the red line in the weighting function figure to the dotted black line that represents mixing ratio). Loops are shown from the GOES-12 sounder for observed radiance at 6.5 micrometer (here), 7.0 micrometer (here), and 7.4 micrometer (here). The 6.5-micrometer loop shows information from highest in the atmosphere (and that particular channel is the noisiest), the 7.0-micrometer is for data that are somewhat lower and the 7.4-micrometer data are lower still. Only the 7.4 micrometer channel suggests an impulse upstream of where the convection eventually fired. (Note that all three animations suffer greatly from the eclipse of the satellite, that is, when the satellite (and its energy-generating solar panels) are in the Earth’s shadow. Batteries on GOES-13 through GOES-15, and on to-be-launched GOES-R will power the satellite through the eclipse.) The loop of 7.4-micrometer sounder data from just before to just after the eclipse (below), however, does show an impulse rotating towards the Gulf.

The three levels of water vapor information in the sounder can be used to produce a three dimensional distribution of moisture in the atmosphere through a sounder data retrieval. If those distributions are then transported in a Lagrangian framework by winds from a numerical model, then later distributions of moisture can be computed through the period of eclipse. (Similarly, later distributions can be computed if cloudiness develops, as the clouds restrict sounder retrievals just as much as data outages do). This method has been described in a previous CIMSS GOES blog entry and forecasts are routinely available at this CIMSS website.

Nearcast predictions of precipitable water differences between two layers (900-700 mb and 700-300 mb) show a maximum (light green color) — that is, a maximum in relatively dry air over relatively moist air, i.e., convective instability) in the region of convective development off the south-central coast of Lousiana. Because numerical models showed a middle-tropospheric vorticity center moving over this region (Click here to see the 06-h forecast valid at 0600 UTC), the region to focus on for convective development can be limited to the region off the coast of southern Louisiana.
(Added: UW Convective Initiation showed no signal for this case, likely because the active initial cloud growth occurred during the eclipse).
Because GOES-13 data were flowing 18 March 2010, a comparison of the sounder channels is possible. Below are loops for 6.5 micrometers (top) and 7.4 micrometers (bottom). Only GOES-12 data is lost during the eclipse; the GOES-13 6.5 micrometer channel is far cleaner; the impulse that gives rise to the convection is evident in the 7.4 micrometer channel (detecting lower into the atmosphere) but not in the 6.5 micrometer channel. In a dry atmosphere, information from the longer-wavelength water vapor channel on the sounder can give important clues to the movement of vapor in the lower troposphere.


View only this post
Read Less
 and GOES-12 (bottom) visible images")
 and GOES-12 (bottom) 3.9 µm shortwave IR images")


