
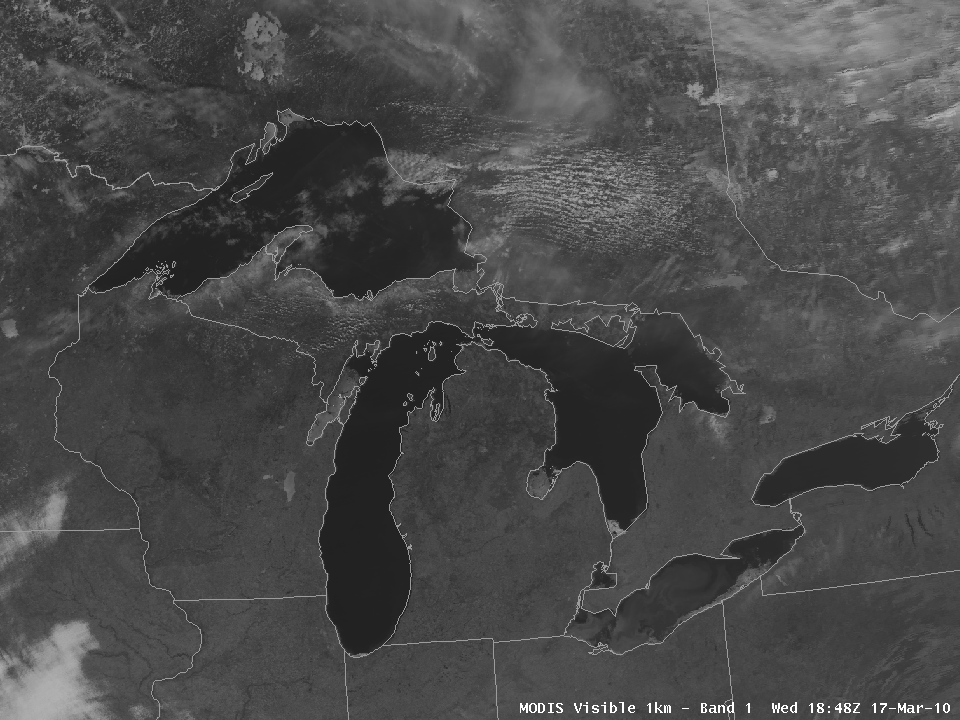
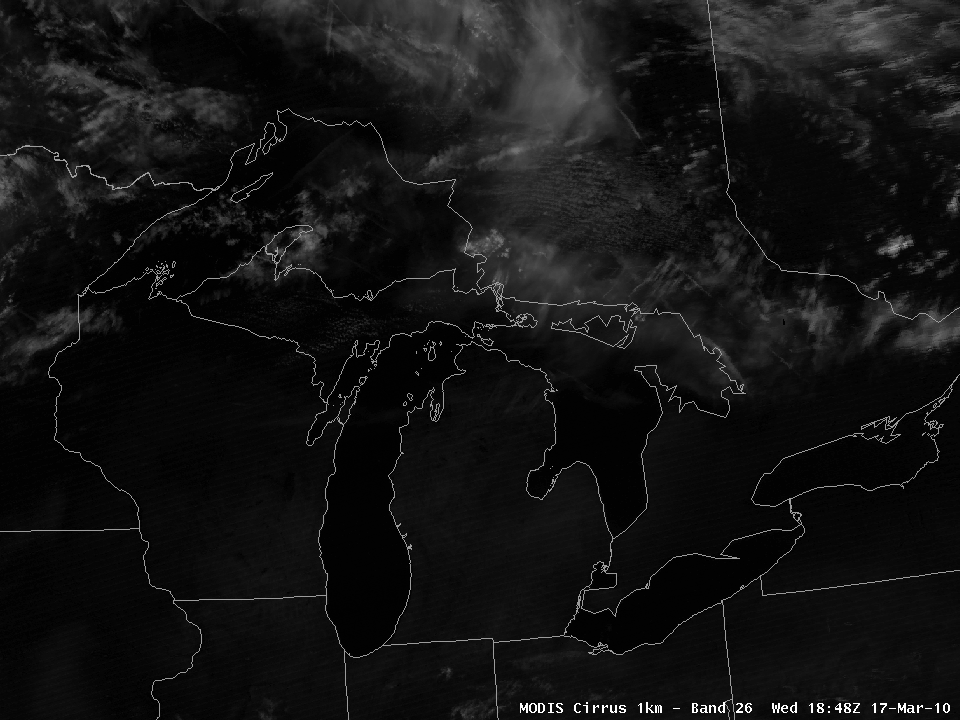
MODIS true color and false color images
A comparison of 250-meter resolution MODIS true color and false color Red/Green/Blue (RGB) images from the SSEC MODIS Today site (above) showed a large fire (perhaps a prescribed burn?) in a remote area of the Red Lake Indian Reservation, just to the west of the Upper and Lower Red Lakes in far northern Minnesota on 26 March 2010. On the false color RGB image, the fire hot spot shows up as a large bright red feature — note the rapid increase in areal coverage of the burn area between the time of the 17:04 UTC Terra satellite overpass and the 18:50 UTC Aqua satellite overpass. The still-frozen lakes appear as varying shades of cyan, while unfrozen bodies of water show up as a much darker blue color. On the true color RGB image, the hazy-looking smoke plume can be seen drifting northward (advected by surface winds from the south that were gusting as high as 29 knots).

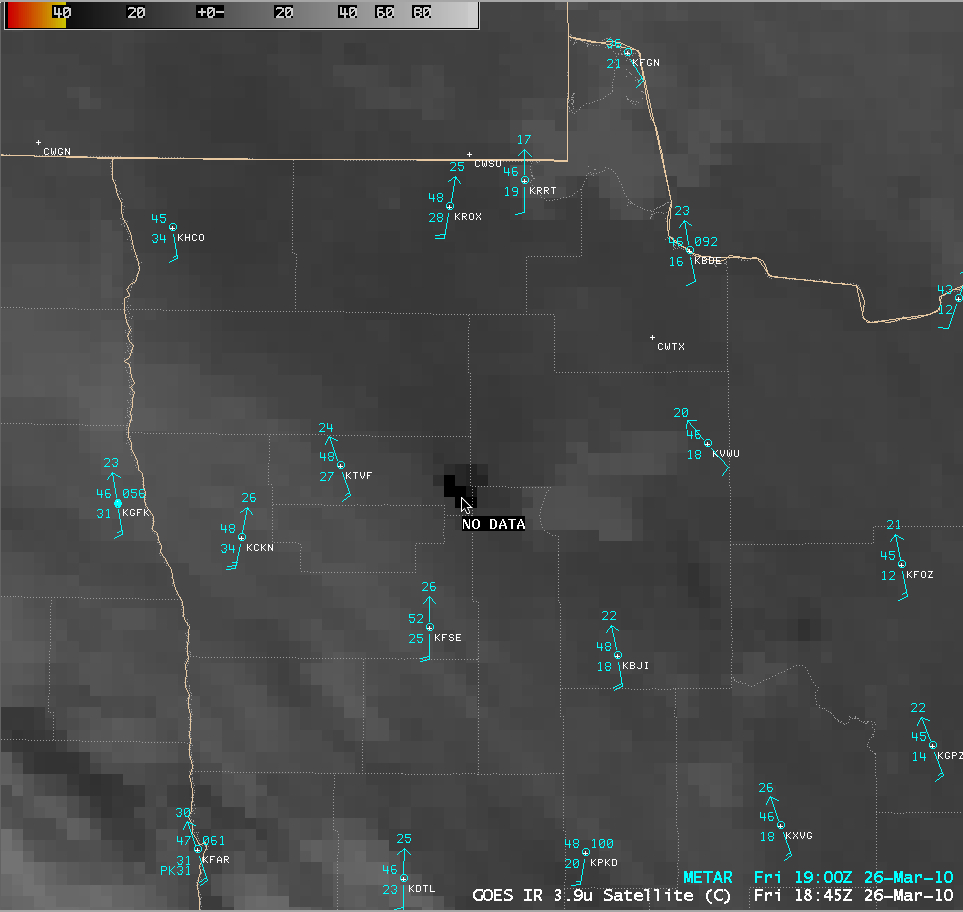
MODIS 3.7 µm, POES AVHRR 3.7 µm, and GOES-12 3.9 µm shortwave IR images
AWIPS images of the 1-km resolution MODIS 3.7 µm, the 1-km resolution POES AVHRR 3.7 µm, and the 4-km resolution GOES-12 3.9 µm shortwave IR channel data (above) shows some important differences in both the location of the hottest pixels (GOES-12 has the fire located farther to the west, in far eastern Pennington county) as well as the intensity of the hot spots: the 18:42 UTC MODIS image registered a maximum IR brightness temperature value of 46.5º C, and the 18:48 UTC POES AVHRR image registered a value as high as 54.5º C. At that same time, the cursor readout for the 18:45 UTC GOES-12 image read “NO DATA” — thus demonstrating the value of the 1-km resolution MODIS and POES AVHRR imagery for identifying the exact location of the hottest portion of the fire.
An animation of the 4-km resolution GOES-12 3.9 µm shortwave IR images (below) did show that the fire hot spot was gradually growing in size, and briefly began to exhibit IR brightness temperature values as high as 37.5º C at 17:45 UTC and 48.0º C at 18:15 UTC — but then the fire intensity exceeded the AWIPS temperature threshold and “NO DATA” was indicated by the AWIPS cursor readout before the fire hot spot eventually became obscured by a dense cirrus cloud canopy drifting overhead from the southwest..

GOES-12 3.9 µm shortwave IR images
The shortwave IR channels on the ABI instrument aboard the GOES-R satellite will have a spatial resolution of 2 km, which should produce images that more closely resemble the 1-km resolution MODIS and POES AVHRR images shown above (further enhancing our fire detection capabilities in the future).
View only this post Read Less


 image")

 mixing ratio")

