During 01 May – 02 May 2010 the 2-day total precipitation at Nashville, Tennessee was 13.57 inches — by far the wettest 2-day period on record for that location (the old record was 6.68 inches on 13-14 September 1979, in association with Hurricane Fredrick). With 7.25 inches falling on 02 May (5.57 inches... Read More

GOES-13 10.7 µm IR images
During 01 May – 02 May 2010 the 2-day total precipitation at Nashville, Tennessee was 13.57 inches — by far the wettest 2-day period on record for that location (the old record was 6.68 inches on 13-14 September 1979, in association with Hurricane Fredrick). With 7.25 inches falling on 02 May (5.57 inches of that in just 6 hours!), this also set a record for the wettest calendar day on record. And, remarkably, only 2 days into the month May 2010 is already the wettest May on record for Nashville. An animation of 24-hour observed precipitation can be seen here.
AWIPS images of 4-km resolution GOES-13 10.7 µm IR channel data (above) showed several rounds of deep convection moving northeastward across the region during the period, with some cells exhibiting IR cloud top brightness temperatures as cold as -74º C. This convection was developing along and ahead of a slow-moving cold frontal boundary.
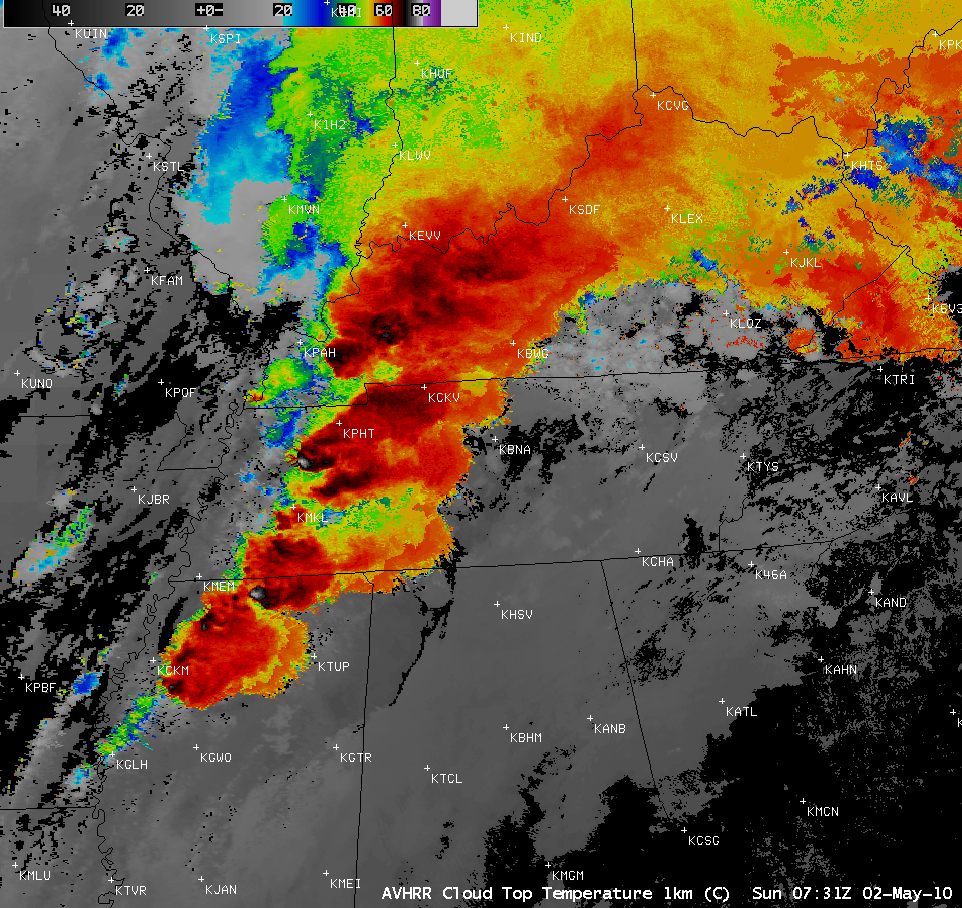
Images of 1-km resolution MODIS 11.0 µm IR data (below) revealed even colder cloud top IR brightness temperature values of -82º C with some of the stronger convection developing over far western Tennessee. The 1-km resolution AVHRR Cloud Top Temperature (CTT) product also indicated CTT values as low as -80º C for some of the stronger thunderstorms.

MODIS 11.0 µm IR image
==================================
 product")
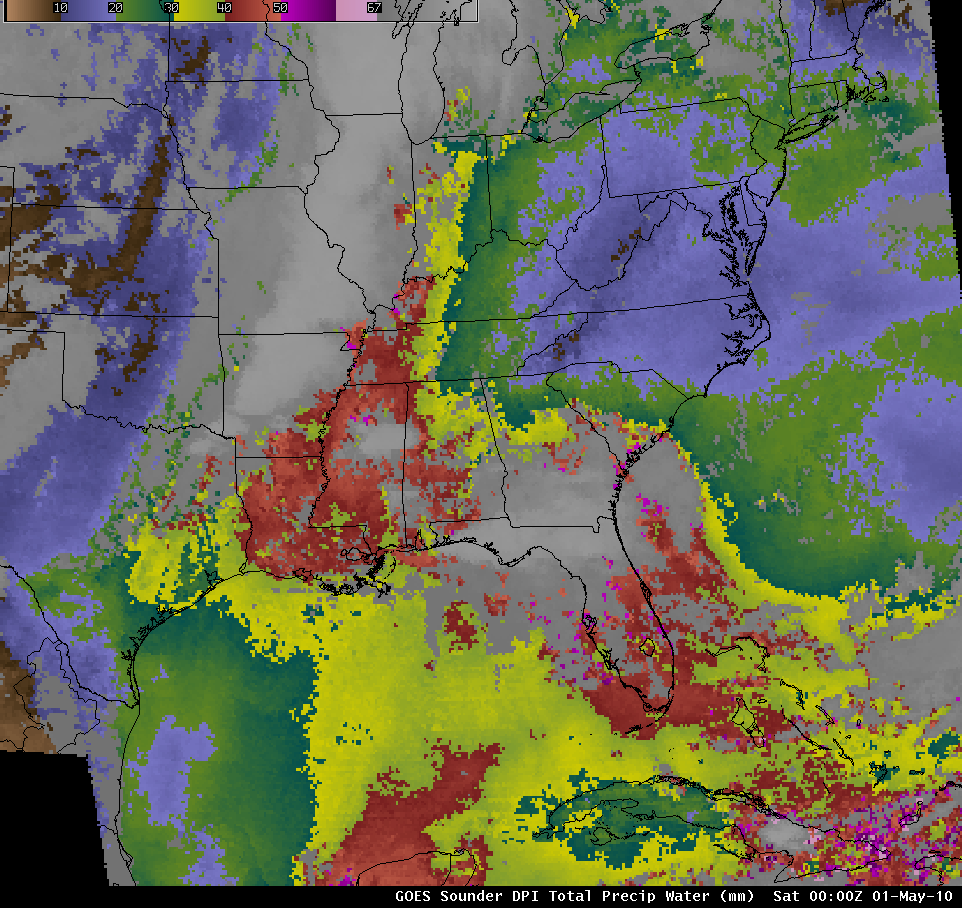
Blended Total Precipitable Water (TPW) product
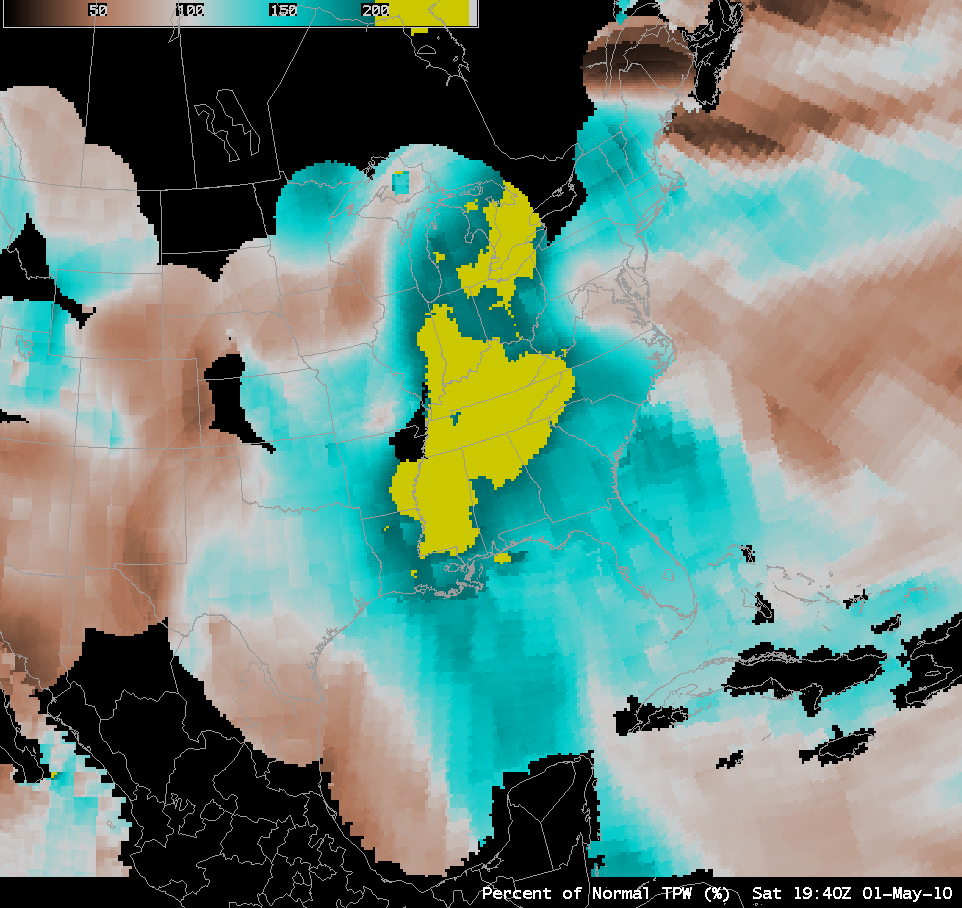
However, more important than the cold convective cloud top temperatures was the plume of rich moisture that was feeding northward across the Gulf of Mexico and into the Tennessee Valley. The Blended Total Precipitable Water (TPW) product (above) showed that TPW values began to exceed 50 mm across the Lower Mississippi River Valley late in the day on 01 May, with TPW within the moisture plume reaching 75 mm over the Gulf of Mexico late in the day on 02 May. TPW values were greater than 200% of normal across most of the Mississippi and Tennessee Valleys, as well as within the northward-moving moisture plume.
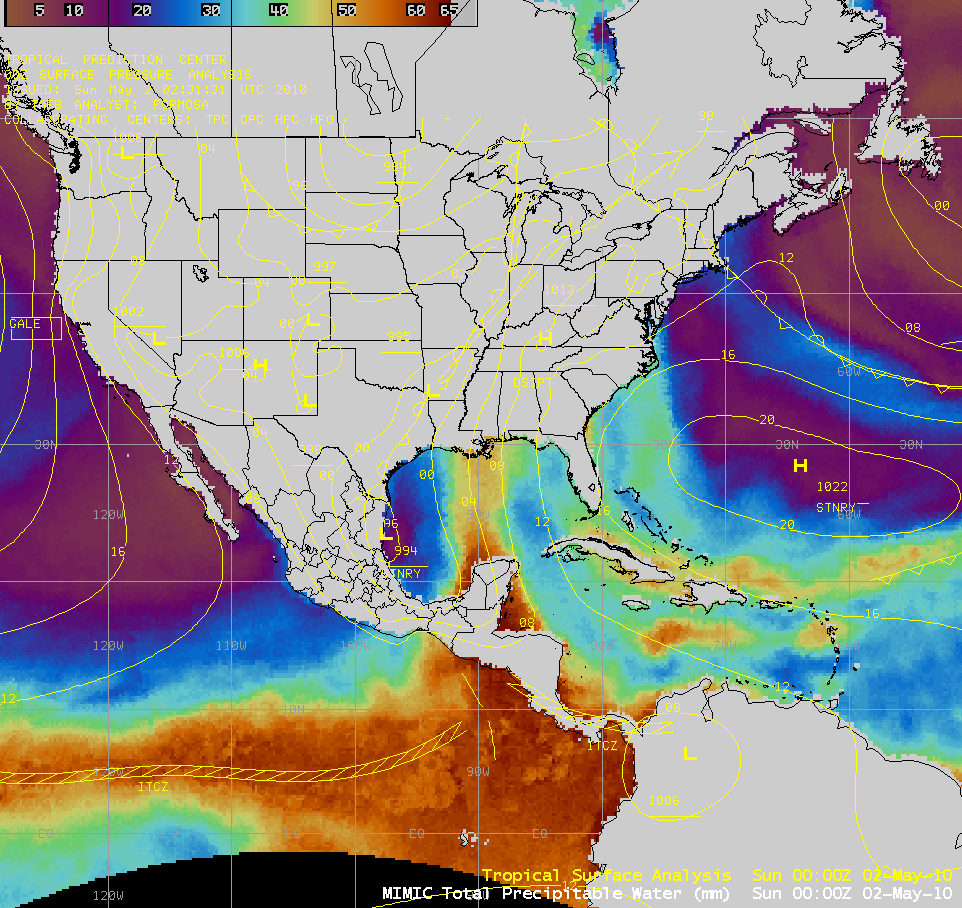
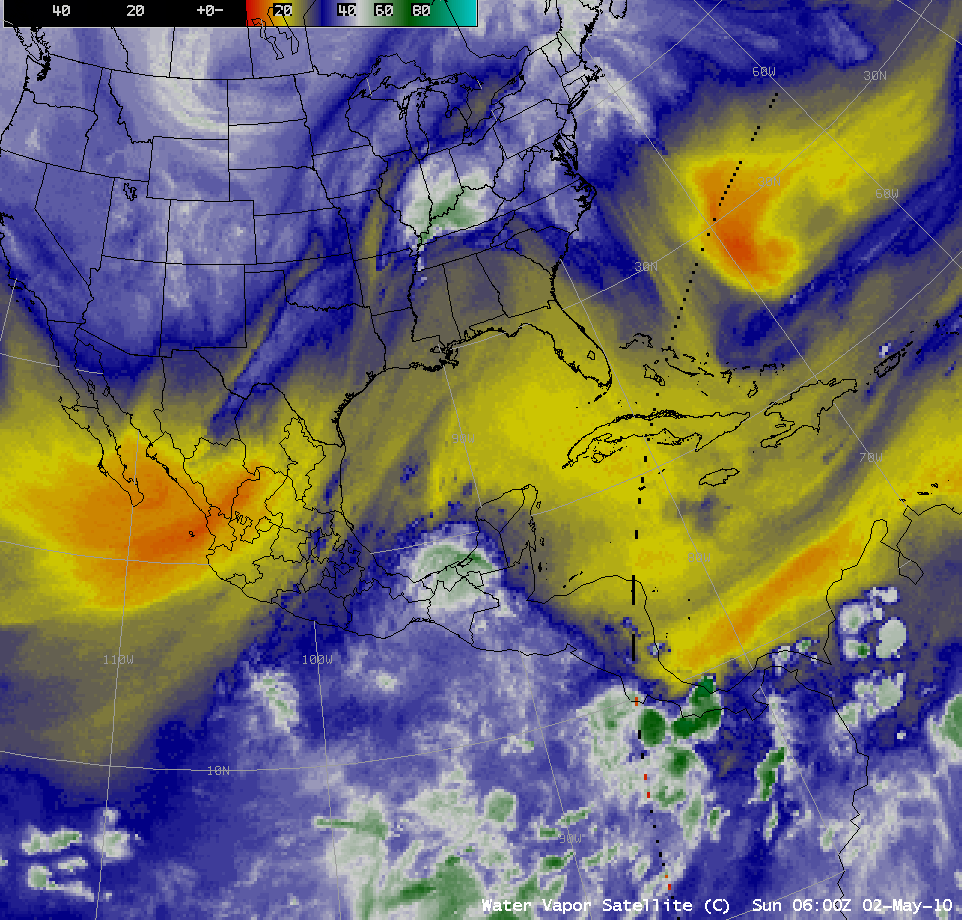
With the greater areal coverage on AWIPS of the MIMIC TPW product (below), it could be seen that the plume of moisture moving meridionally (northward) across the Gulf of Mexico actually originated from the zonal band of deep moisture associated with the Inter-Tropical Convergence Zone (ITCZ) that was located between the Equator and 10º N latitude over the far eastern Pacific Ocean. MIMIC TPW values over the Gulf of Mexico became greater than 60 mm late in the day on 02 May; GOES-13 Sounder TPW values were also as high as 66 mm over the Gulf of Mexico on 02 May.
Incidentally, this case also serves as a great example of why you can’t always identify and track important TPW plumes on standard water vapor imagery — the water vapor channel is often sensing radiation from a layer that is above that of the bulk of the TPW plume (comparison of GOES water vapor image and MIMIC TPW image).
 product")
MIMIC Total Precipitable Water (TPW) product
Rawinsonde data from Nashville (below) generally revealed a very moist atmosphere throughout much of the troposphere during the period, with TPW values as high as 2.00 inches at 00 UTC on 02 May.

Nashville, Tennessee rawinsonde data
===== 03 MAY UPDATE =====
 and after (03 May) MODIS false color RGB images")
Before (29 April) and after (03 May) MODIS false color RGB images
A comparison of before (29 April 2010) and after (03 May 2010) 250-meter resolution MODIS Red/Green/Blue (RGB) false color images (above) from the SSEC MODIS Today site shows dramatic changes in some of the smaller rivers across western and central Tennessee following the record-setting rainfall that occurred on 01-02 May. On the false color images (created using MODIS bands 7/2/1 as the R/G/B channels), water appears as darker shades of blue, while dense vegetation appears as brighter shades of green.
On the corresponding set of before/after MODIS true color images (created using MODIS bands 1/4/3 as the R/G/B channels), increased river water turbidity (varying shades of light brown) can be seen — a result of high amounts of sediment transport (below).
 and after (03 May) MODIS true color RGB images")
Before (29 April) and after (03 May) MODIS true color RGB images
AWIPS images of the MODIS 0.645 µm visible channel and the 2.1 µm near-IR “snow/ice channel” data (below) demonstrate how the 2.1 µm imagery can be used to better identify flooded areas that do not show up as well on the visible channel imagery. Water (like snow and ice) is a strong absorber at the 2.1 µm wavelength, and thus appears very dark on the “snow/ice” image.

MODIS 0.645 µm visible channel and 2.1 µm near-IR “snow/ice” channel images
CIMSS has been supplying a variety of MODIS images and products in AWIPS (some of which are displayed on this page) to a number of NWS forecast offices as a part of the GOES-R Proving Ground effort.
===== 05 MAY UPDATE =====

MODIS false color images from 03, 04, and 05 May 2010
A comparison of 250-meter resolution MODIS false color images from 03 May, 40 May, and 05 May 2010 (above) showed that while some of the smaller rivers and tributaries appeared to be receding somewhat, a number of the larger rivers did appear to remain swollen, with many areas still inundated with flood waters.
Related sites:
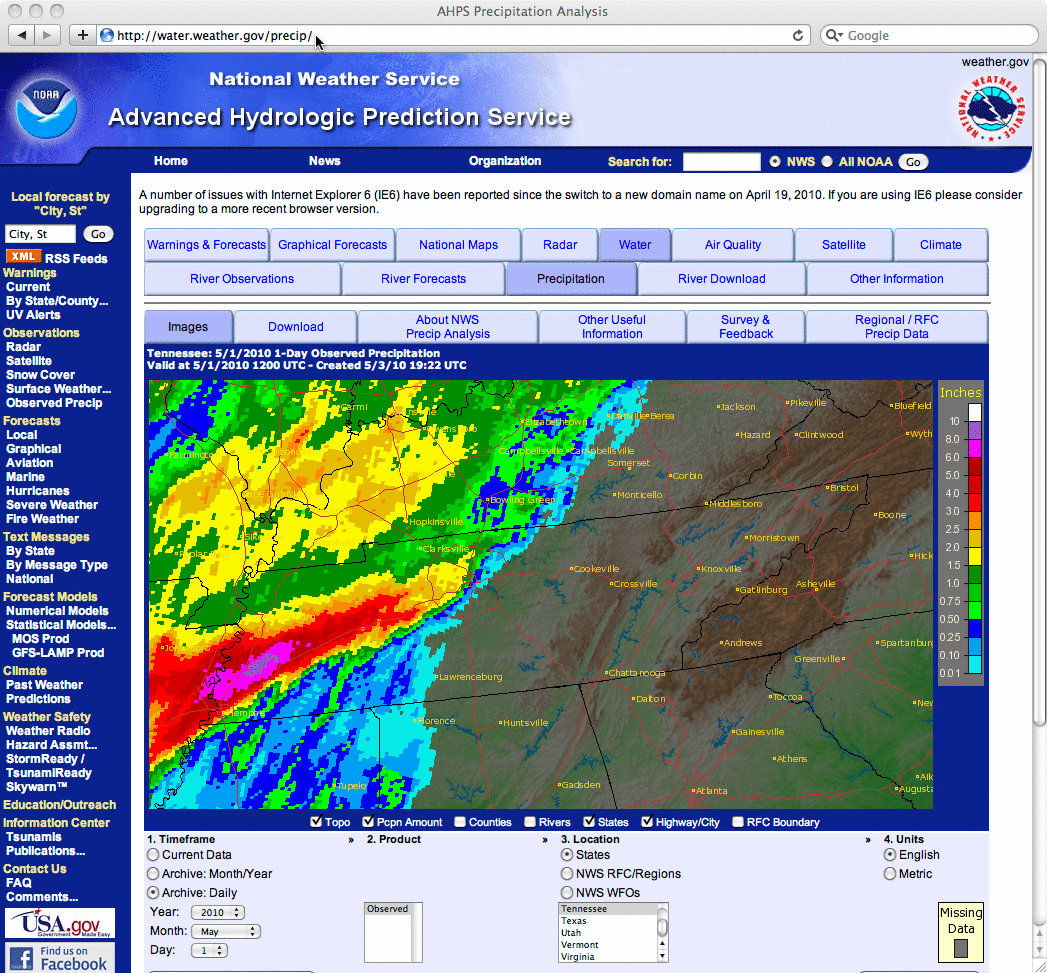
NWS Nashville precipitation total map
AccuWeather WeatherMatrix blog
Weather Underground blog
View only this post
Read Less

")

")
")

 product")

