A comparison of 250-meter resolution Aqua MODIS 0.65 µm and 0.87 µm visible channel images centered on Tuscaloosa, Alabama on 28 April 2011 (above) showed signatures of a few of the larger and longer tornado damage paths from the historic tornado outbreak (Read More
")
MODIS 0.65 and 0.87 µm visible images (centered on Tuscaloosa, Alabama)
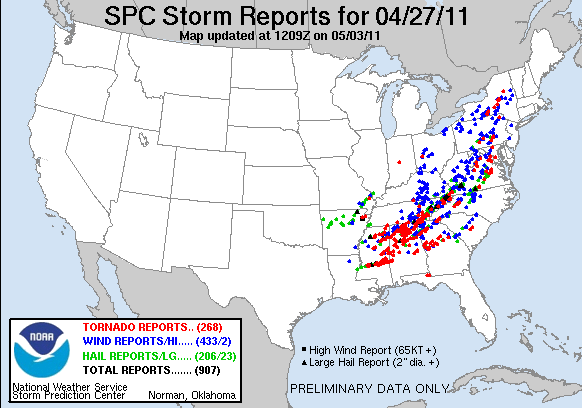
A comparison of 250-meter resolution Aqua MODIS 0.65 µm and 0.87 µm visible channel images centered on Tuscaloosa, Alabama on 28 April 2011 (above) showed signatures of a few of the larger and longer tornado damage paths from the historic tornado outbreak (SPC storm reports) that occurred on 27 April 2011. A collection of GOES, POES AVHRR, and MODIS images of the tornado outbreak are available on a separate CIMSS Satellite Blog post.
A comparison of before (17 April 2011) and after (28 April 2011) 250-meter resolution MODIS true color Red/Green/Blue (RGB) images from the SSEC MODIS Today site (below) also showed a few of the tornado damage paths — though some of the damage paths were not as evident as they were on the single-channel visible images above. In addition, another long tornado track can be seen across western Georgia.
 and after (28 April) the tornado outbreak")
MODIS true color images before (17 April) and after (28 April) the tornado outbreak
Below is the same before/after MODIS true color image comparison, viewed using Google Earth.
 and after (28 April) MODIS true color images (viewed using Google Earth)")
Before (17 April) and after (28 April) MODIS true color images (viewed using Google Earth)
A comparison of AWIPS images of 1-km resolution MODIS 0.65 µm visible channel data and the corresponding 1-km resolution Normalized Difference Vegetation Index (NDVI) product (below) revealed that a few of the larger tornado damage paths were characterized by a slightly lower NDVI value (lighter green color), due to the downed trees and damaged vegetation.

MODIS 0.65 µm visible image + MODIS Normalized Difference Vegetation Index product
One of the larger tornado damage tracks across northwestern Alabama was also apparent on GOES-13 0.63 µm visible channel imagery (below). An animation helps to confirm that the feature is not a contrail or some other type of linear cloud feature (which would be moving in an animation, rather than stationary). While the north-south spatial resolution of the GOES imager visible detectors is 1.0 km at the satellite sub-point (over the Equator), with the larger geostationary satellite viewing angle the north-south spatial resolution over northern Alabama is about 1.38 km.
")
GOES-13 visible images (centered along Mississippi/Alabama border region)
It is interesting to note that the larger tornado damage path which can been seen across northwestern Alabama on the GOES-13 visible image is very difficult to identify on the corresponding GOES-12 0.65 µm visible image (below). This is due to a change is the spectral response function on the visible channel of the GOES-13 and later series of imagery instruments — for more details, see this CIMSS Satellite Blog post.
 + GOES-12 0.65 µm visible image (right)")
GOES-13 0.63 µm visible image (left) + GOES-12 0.65 µm visible image (right)
Update 29 April 2011: A Terra MODIS pass from late morning on April 29th shows the damage paths more clearly through central Alabama. As the churned-up vegetation within the damage path slowly browns, the contrast to undamaged vegetation outside the damage path should increase, allowing for a clearer picture of the damage path. The bowtie-corrected MODIS imagery for visible channel 1 (0.65 microns, below) and visible Channel 2 show three lines of damage through central Alabama. (Here is an animation of the two visible channels).

Since this day was less cloudy than the previous, here is a better before (17 April) versus after (29 April) comparison of 250-meter resolution MODIS true color images from the SSEC MODIS Today site (below, viewed using Google Earth).
 and after (29 April)")
MODIS true color images from before (17 April) and after (29 April)
Update 30 April 2011: A few of the tornado damage paths across northern Alabama were also evident on an AWIPS image of the 1-km resolution MODIS Land Surface Temperature (LST) product (below). The LST values within the damage paths were in the low to middle 80s F (darker red color enhancement), compared to surrounding LST values in the upper 70s F (orange color enhancement), indicating that the damage paths with destroyed vegetation and tornado debris were able to heat up a few degrees more than the adjacent undisturbed vegetation. The urban areas of the cities of Tuscaloosa (KTCL) and Birmingham (KBHM) also exhibited warmer LST values (darker red) than the surrounding less urbanized, more densely forested areas.

MODIS Land Surface Temperature product
CIMSS participation in GOES-R Proving Ground activities includes making a variety of MODIS images and products available for National Weather Service offices to add to their local AWIPS workstations.
View only this post
Read Less

 images")
")
")


")

