")
GOES-13 0.63 µm visible images (click image to play animation)
The tornado outbreak that affected much of the Southeast US on 27 April 2011 was one of historic proportions, in terms of the number of strong to violent tornadoes produced and the number of resulting fatalities. McIDAS images of 1-km resolution GOES-13 0.63 µm visible channel data (above; click image to play animation; also available as a QuickTime movie) showed the multiple clusters of severe thunderstorms that developed across the region during the day. The GOES-13 satellite had been placed into Rapid Scan Operations (RSO), supplying imagery as frequently as every 5-10 minutes. Zoomed-in versions of GOES-13 RSO 0.63 µm visible images covering the period of the long-track (80 mile) EF-4 Tuscaloosa (KTCL) / Birmingham (KBHM) tornado are available here, which show that the storms exhibited a number of distinct overshooting tops during the time period between 20:40 UTC and 23:25 UTC.
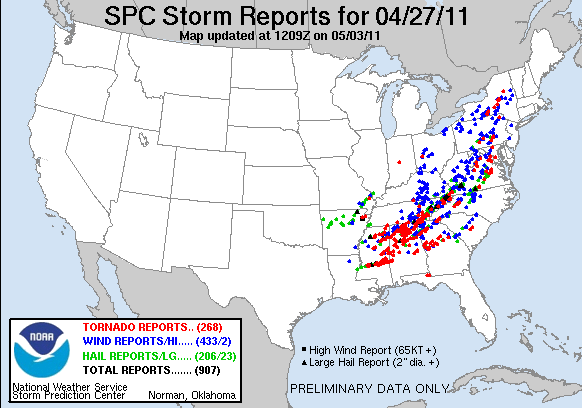
AWIPS images of 4-km resolution GOES-13 10.7 µm IR channel data with overlays of severe weather reports (below; click image to play animation) showed the first round of large storms with cold cloud top IR brightness temperatures (red to black to white color enhancement) that moved through the area during the pre-dawn hours (which produced mainly damaging wind reports), followed by the development later in the afternoon and early evening hours of the stronger storms that produced numerous reports of large hail and strong tornadoes ahead of an advancing cold front (SPC storm reports). Zoomed-in versions of GOES-13 RSO 10.7 µm IR images covering the period of the long-track (80 mile) EF-4 Tuscaloosa (KTCL) / Birmingham (KBHM) tornado are available here — cloud top IR brightness temperature values during the 20:40 UTC to 23:25 UTC time period were as cold as -75ºC at 22:25 UTC.
")
GOES-13 10.7 µm IR images (click image to play animation)
With the higher 1-km spatial resolution of the POES AVHRR IR imagery (below), more detail could be seen in the cloud top IR brightness temperature structure, and much colder cloud top temperatures could be detected in the vicinity of the strongest overshooting tops (as cold as -83ºC, violet color enhancement). Other similar 1-km resolution POES AVHRR IR and MODIS IR image examples (with overlays of storm reports) are available at 16:28 UTC, 18:10 UTC, 18:12 UTC, 18:35 UTC, 19:48 UTC, 19:52 UTC, 20:13 UTC, 00:01 UTC, and 03:34 UTC.

POES AVHRR 12.0 µm IR image + SPC storm reports
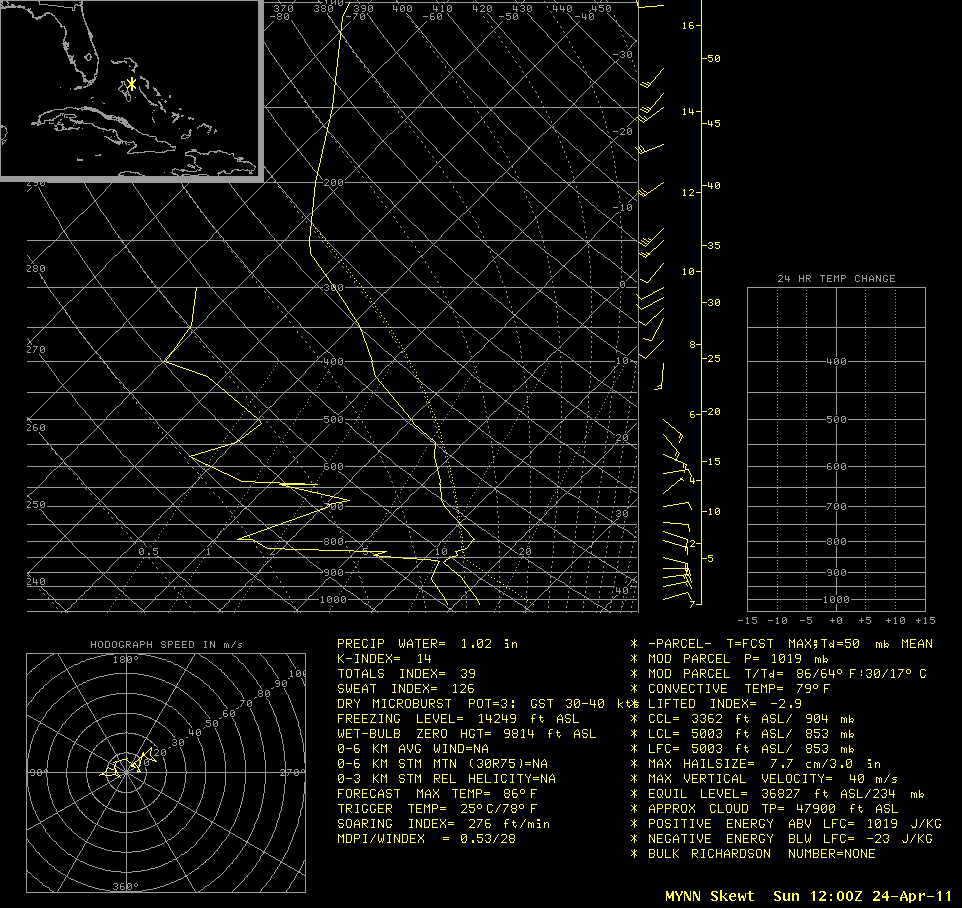
Although there was widespread cloudiness across much of the Southeast US, hourly GOES-13 Sounder Convective Available Potential Energy (CAPE) derived product images (below) were still able to provide some indication as to the instability of the air mass that was feeding northward into the region that morning.

GOES-13 Sounder CAPE derived product imagery
Another important ingredient was the approach of a strong trough aloft, along with an associated strong mid-level jet streak as seen in a comparison of 1-km resolution MODIS 6.7 µm water vapor imagery and CRAS model 500 millibar (hPa) wind speeds (below).

MODIS 6.7 µm water vapor channel image + CRAS model 500 MB wind speeds
CIMSS participation in GOES-R Proving Ground activities includes making a variety of POES AVHRR, MODIS, and additional GOES Sounder images and products available for National Weather Service offices to add to their local AWIPS workstations. The VISIT training lessons “POES and AVHRR Satellite Products in AWIPSâ€, “MODIS Products in AWIPS“, and “Water Vapor Imagery and Potential Vorticity Analysis” are available to help users understand these products and their applications to weather analysis and forecasting.
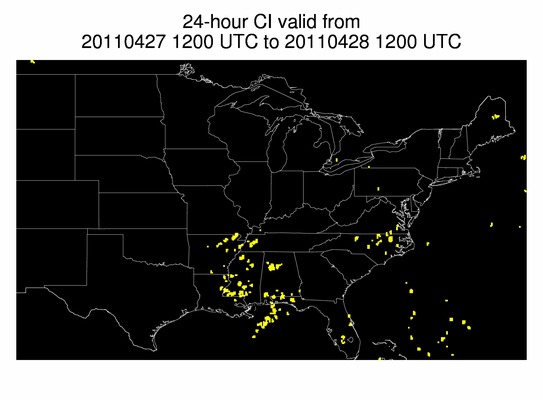
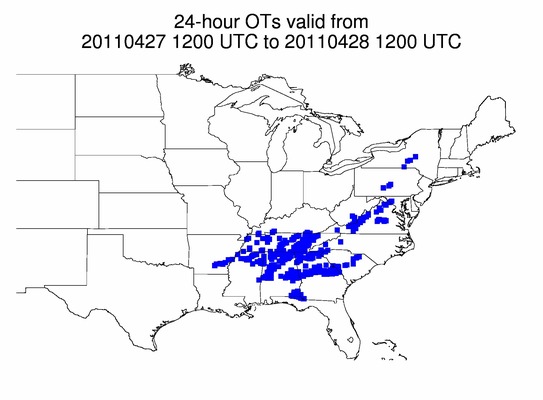
To prepare for the upcoming GOES-R era, new products are being developed and tested at CIMSS using the current generation of satellite data — in fact, some of these new products are now being distributed to and evaluated by a few NWS Offices. Specially-tailored products such as Convective Initiation, Overshooting Tops, and Enhanced-V will allow for the automatic detection of the various developmental stages of convection.
View only this post Read Less
")

")
")


