
MODIS and GOES-13 fog/stratus product images
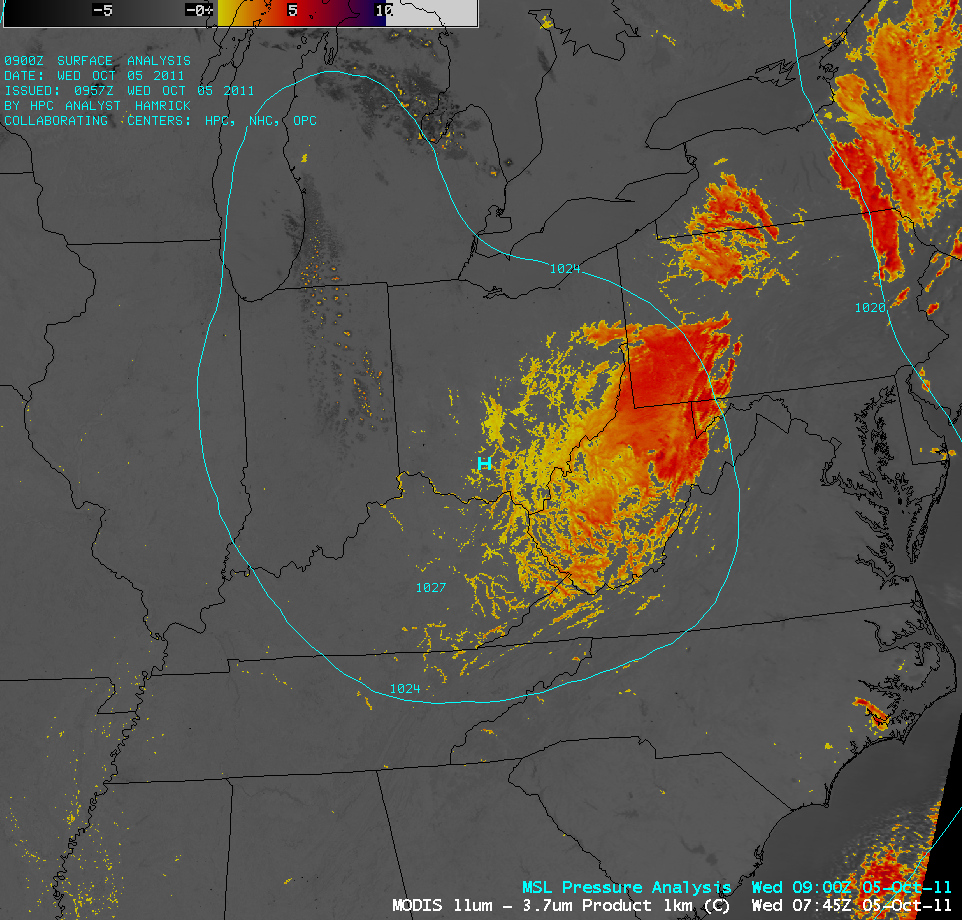
Strong nocturnal radiational cooling beneath a large area of high pressure centered over the Ohio River Valley led to the formation of widespread areas of fog and stratus on 05 October 2011. AWIPS image comparisons of the 1-km resolution MODIS and the 4-km resolution GOES-13 fog/stratus products at 03:30 UTC or 11:30 pm local time (above) and 07:45 UTCÂ or 3:45 am local time (below) demonstrated the clear advantage of having improved spatial resolution to detect the more subtle features such as river valley fog.

MODIS and GOES-13 fog/stratus product images
To compliment the improved fog/stratus detection capabilities offered by higher spatial resolution, other products are being developed (as part of the CIMSS participation in GOES-R Proving Ground activities) that provide more quantitative information about areas of fog and/or low cloud: for example, Fog Depth, Marginal Visual Flight Rules (MVFR) Probability, and Instrument Flight Rules (IFR) Probability (below). In this case, the 07:45 UTC products indicated that the Fog Depth values were as high as 1231 feet (cyan color enhancement) over parts of northern West Virginia, where there were also MVFR Probabilities greater than 90% and IFR Probabilities greater than 75% (brighter red color enhancement).

GOES-13 fog/stratus product, Fog Depth, MVFR Probability, and IFR Probability
View only this post Read Less
 and 03 October (right)")

")

")


")
")

