A significant rain and snow event occurred across parts of southeastern Wyoming and western Nebraska on 08 October 2011 (see NWS Cheyenne story) — snowfall amounts as high as 12.0 inches were reported near Cheyenne , Wyoming with 2.73 inches of rain reported farther to the... Read More
 image")
MODIS true color Red/Green/Blue (RGB) image
A significant rain and snow event occurred across parts of southeastern Wyoming and western Nebraska on 08 October 2011 (see NWS Cheyenne story) — snowfall amounts as high as 12.0 inches were reported near Cheyenne , Wyoming with 2.73 inches of rain reported farther to the northeast near Crawford in western Nebraska. Two days later (on 10 October 2011), a large patch of low-elevation snow cover could still be seen in far southeastern Wyoming on a 250-meter resolution MODIS true color Red/Green/Blue (RGB) image from the SSEC MODIS Today site (above, viewed using Google Earth).

MODIS 0.65 µm visible channel image + MODIS 2.1 µm "snow/ice channel" image
On a comparison of AWIPS images of 1-km resolution MODIS 0.65 µm visible channel and MODIS 2.1 µm “snow/ice channel” data (above), snow cover (along with clouds) appears bright on the visible image, but snow appears very dark on the snow/ice image (since snow is a very strong absorber at that particular wavelength).
Another method to discriminate between clouds and snow cover is to use different MODIS images to create a 3-channel RGB false color image — snow cover appears darker red on such a false color image (below), which used MODIS channels 01/07/07 as the Red/Green/Blue components.
 image")
MODIS 0.65 µm visible image + MODIS false color Red/Green/Blue (RGB) image
In far southeastern Wyoming, the areas that still had significant snow cover exhibited much colder MODIS Land Surface Temperature (LST) values (below), with LSTs ranging from the middle 30s F (darker green color enhancement) over deeper snow cover to the upper 60s to low 70s (darker orange color enhancement) over adjacent areas of bare ground.

MODIS Land Surface Temperature product
With the high October sun angle helping to produce warm temperatures (the daytime high at Cheyenne, Wyoming that day reached 59ºF or 15ºC) the patch of lower-elevation snow cover just to the north of Cheyenne began to melt during the day, as can be seen on an animation of GOES-15 0.63 µm visible channel images (below; click image to play animation).
")
GOES-15 0.63 µm visible channel images (click image to play animation)
============================

MODIS 11.0 µm IR image + topography
Another feature of interest on the satellite images was the formation of a “cloud banner†or “cloud crest†just downwind of the ridge of higher terrain that ran northwest to southeast across the Wyoming/Colorado border region — this cold cloud feature could be seen on the 1-km resolution MODIS 11.0 µm IR image (above). The 4-km resolution MODIS Cloud Phase product (below) showed this to be an ice phase cloud feature (salmon color enhancement), with the 4-km resolution MODIS Cloud Top Temperature (CTT) product indicating CTT values as cold as -45ºC (darker blue color enhancement).

MODIS Cloud phase product + MODIS Cloud Top Tempeature product
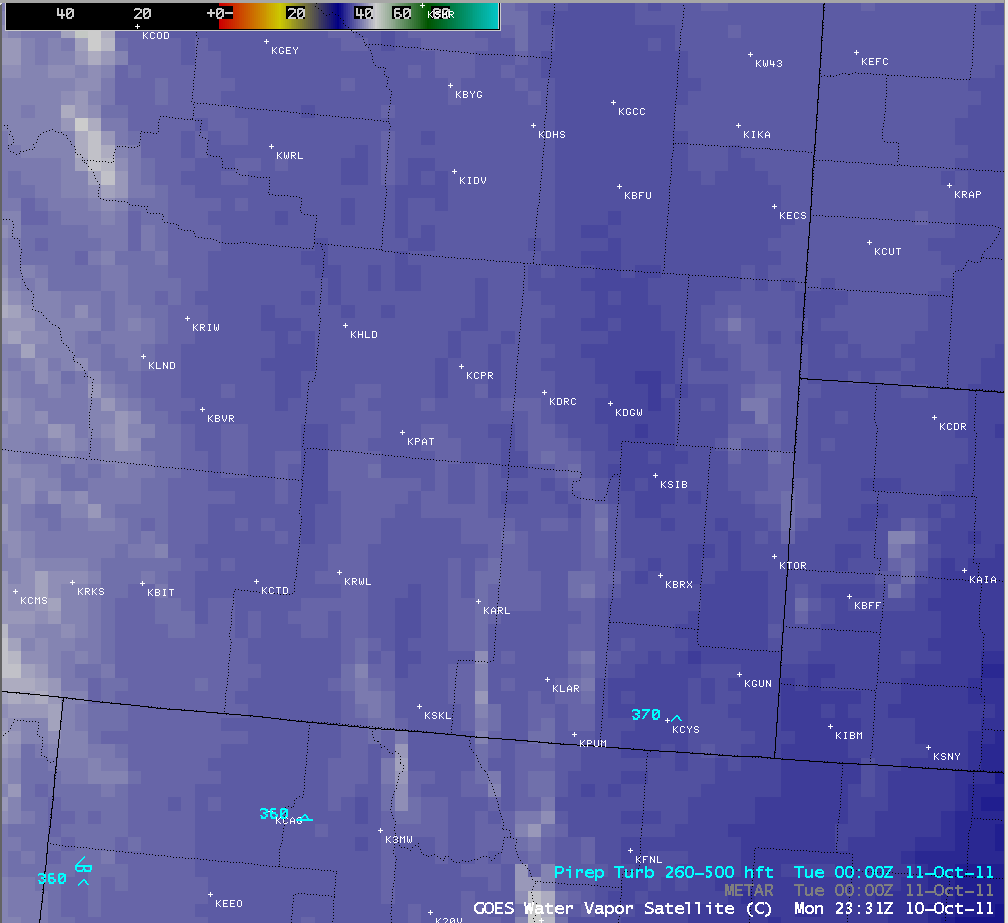
The 1-km resolution MODIS 6.7 µm water vapor channel image (below) revealed a signature of mountain waves farther downwind of the cloud banner feature. A few hours later (at 23:58 UTC), there was a pilot report of light turbulence in that region at an altitude of 37,000 feet.

MODIS 6.7 µm water vapor channel image
CIMSS participation in GOES-R Proving Ground activities includes making a variety of MODIS images and products available for National Weather Service offices to add to their local AWIPS workstations. Currently there are 49 NWS offices receiving MODIS imagery and products from CIMSS.
View only this post
Read Less
")

")

")


")
